
580 California St., Suite 400
San Francisco, CA, 94104
This research area investigates the role of solvent characteristics—such as viscosity, vapor pressure, surface tension, density, and acoustic absorption—in optimizing cavitation and acoustic energy transfer in sonochemistry. It is critical for advancing green chemistry by combining ultrasonic irradiation with environmentally benign or non-conventional solvents, to enhance reaction rates, yields, and sustainability in organic synthesis and materials science.
This theme focuses on employing advanced data analysis frameworks such as instrumental variable analysis, regression discontinuity, and chemometrics to address confounding factors, multivariate complexity, and uncertainties inherent in chemical system measurements. Key applications range from atmospheric aerosol chemistry to electrochemistry and spectroscopic analyses, aiming to enhance interpretability, robustness, and quantitative accuracy of instrumental data by integrating statistical and causality-based methodologies.
This theme explores the development and application of advanced infrared and Raman spectroscopic techniques, especially reflection FTIR and vibrational spectroscopy, combined with tailored data processing to identify organic and inorganic compounds non-invasively. These approaches are crucial for heritage conservation, intraoperative medical diagnostics, and cultural artifact analysis, where maintaining sample integrity is paramount.
![Figure 5. Schematic of the three-layer artificial neural network [46]. 0 overcome the poor precision of the calibration curve methods and the limitations of nonline roblems, scholars have proposed the use of statistical methods for the quantitative analysis | IBS. Artificial neural networks (ANNs) are computing systems inspired by the biological neut etworks that constitute animal brains. Such systems learn (progressively improve performanc ) do tasks by considering examples, generally without task-specific programming. The follov 1g outstanding advantages of artificial neural networks have attracted great attention in rece ears: (1) it can fully approximate any complex nonlinear relationship; (2) all the quantitative ualitative information is stored in the neurons in the network, so it has strong robustness a1 ault tolerance; (3) ANNS adopts the parallel distribution processing method, so that it c erform a large number of operations quickly; (4) ANNS can learn and adapt to unknown ncertain system; and (5) it can handle both quantitative and qualitative information at the san me. An artificial neuron network (ANN) is a computational model based on the structure a1 inctions of biological neural networks. Artificial neural networks usually contain input lay idden layer (competitive layer) and output layer, as shown in Figure 5.](https://figures.academia-assets.com/89438361/figure_006.jpg)
![Figure 7. Boltzmann plot containing some data resulting from the analysis of an aluminum alloy. The three lines represent the results of a linear best fit of the Al(I), Mn(II) and Mg(II) data [48]. LIBS offers a strong potential for analysis in situ and in real time, not requiring complex sample preparation. This allows it to be applied quickly and extensively to qualitative analysis, but quantitative analysis is very difficult. Even with a given experimental configuration, the laser-induced breakdown spectrum is not only dependent on the concentration of the analyte but also dependent on the composition of the matrix and their polymerization state. Matrix effects play an important role in quantitative analysis of LIBS. In order to overcome the matrix](https://figures.academia-assets.com/89438361/figure_008.jpg)
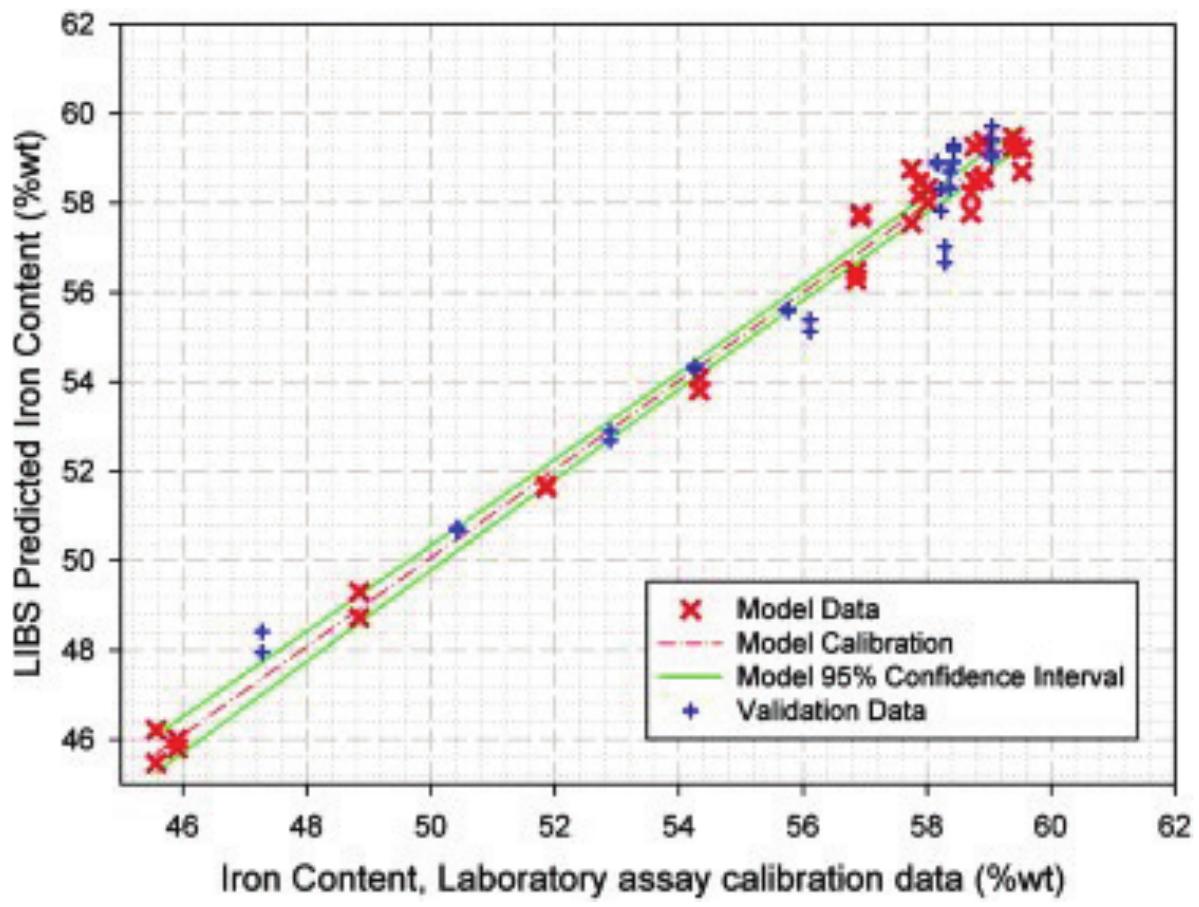
![Figure 3. Simple linear regression calibration curves for Ce [38].](https://figures.academia-assets.com/89438361/figure_003.jpg)
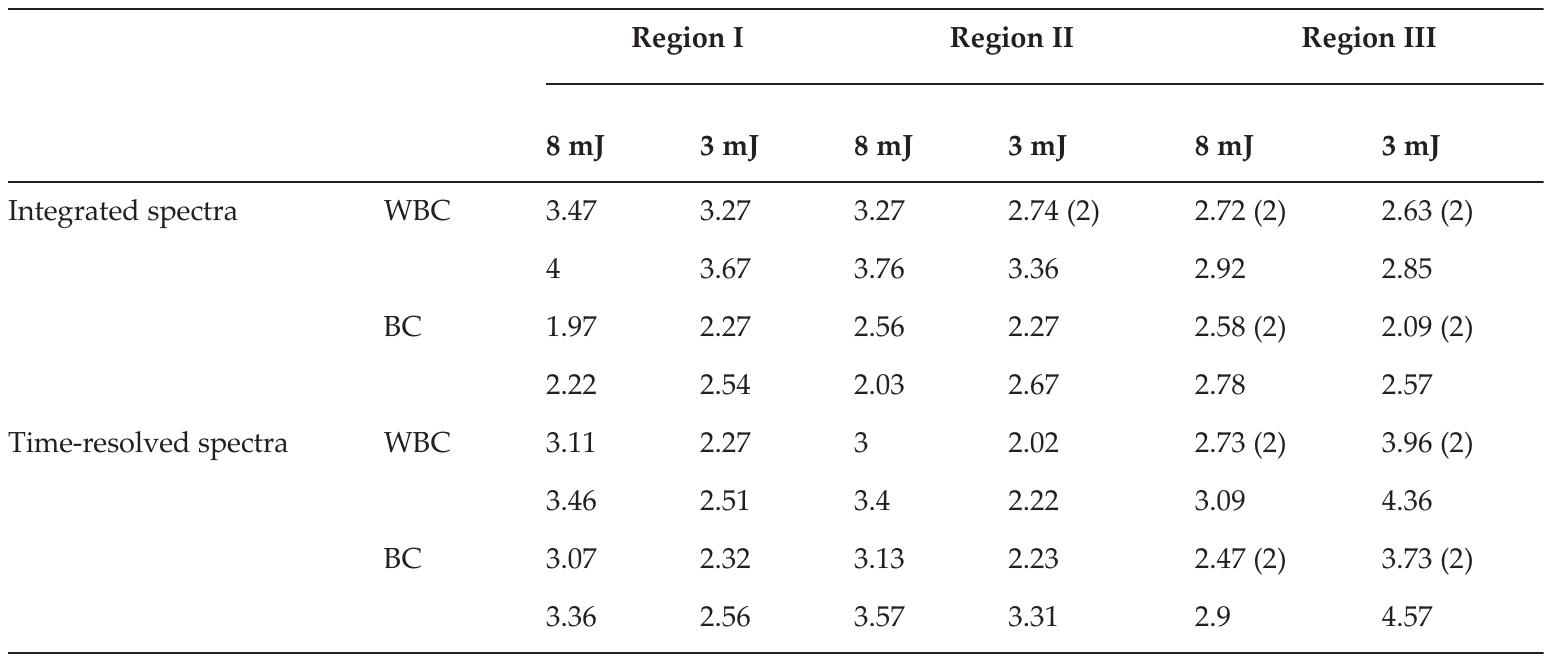
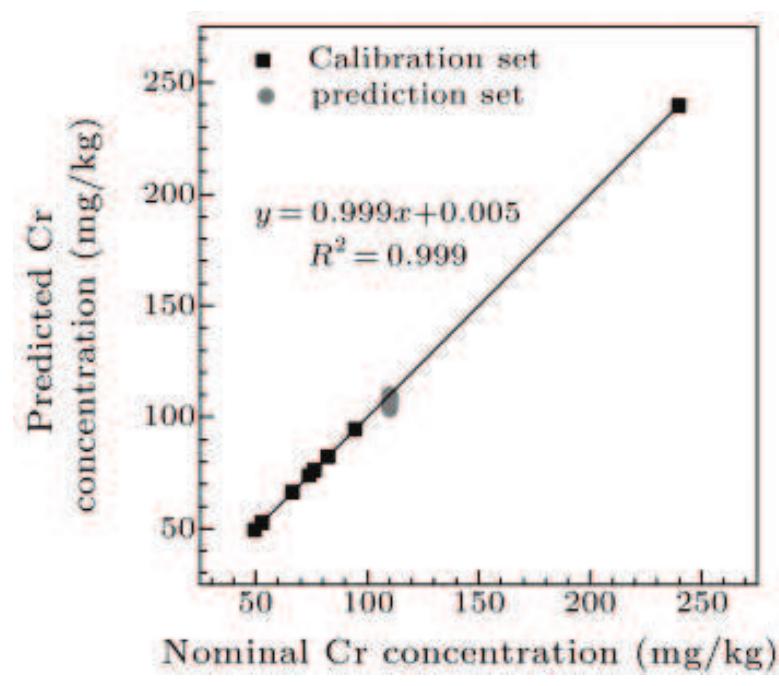
![Table 4. Average relative errors of calibration (REC) and prediction (REP). For example, Gu et al. [47] used three segmental spectra of 393-397 nm, 422-423 nm and 425— 427 nm as the input variables of SVR model to predict the content of Cr in soil samples. They got better predictive results that R* = 0.999 and the absolute relative error is 2.61% and the slope of the calibration curve is closer to 1, as shown in Figure 6.](https://figures.academia-assets.com/89438361/table_003.jpg)