
580 California St., Suite 400
San Francisco, CA, 94104
This theme investigates the kinetics, pathways, and mechanistic insights into degradation intermediates formed during the transformation of persistent organic pollutants such as cyclic nitramine explosives, nitroaromatic explosives, pesticides like lindane, and ester nitrates under various oxidation-driven and photolytic remediation treatments. Understanding these intermediates is critical for designing effective remediation strategies, predicting environmental fate, and assessing potential toxicological effects of degradation compounds.
This theme centers on the chemical degradation pathways of active pharmaceutical ingredients (APIs) under stress conditions such as hydrolytic, photolytic, oxidative, and thermal stresses typically used in forced degradation studies. Analytical characterization of degradation intermediates by advanced liquid chromatography-mass spectrometry and nuclear magnetic resonance techniques facilitates mapping degradation mechanisms informing stability assessments, formulation development, and regulatory submissions in pharmaceutical sciences.
This theme explores the interplay of microbial enzymatic activity, substrate availability, and environmental conditions in mediating degradation intermediates of persistent xenobiotics, including polymers like polyethylene and plastics such as PET. It addresses numerical simulation of substrate-limited biodegradation kinetics and the identification of microbial and fungal species capable of degradation at various temperatures, highlighting biotechnological pathways to enhance environmental sustainability through improved degradation control.
![Fig.8 Photoelectron U4f spectral regions for SUT (uranium/titania) (a) and SUA (uranium/alumina) (b) catalysts during in situ experiments. The plots correspond to: the initial samples (1); after 450-nm LED irradiation for different time periods (2-4). Reprinted with permission from Ref. [52]](https://figures.academia-assets.com/102285378/figure_008.jpg)
![Fig. 11 DRIFTS spectra for the in situ analysis of the carbon dioxide reduction with water for titania (TiO,) and back-titania (H-TiO,_,) samples at dark (a, b) and under visible illumination (c, d). Repro- duced with permission from Ref. [82]](https://figures.academia-assets.com/102285378/figure_011.jpg)
![Fig. 13 Integrated FTIR absorbance bands between 1680 and 1708 cm! for acetaldehyde on a TiO, sur- face without (a) and with (b) baseline corrections. Surface coverage of adsorbed acetaldehyde, croton- aldehyde, and formate as a function of reaction time during four consecutive cycles of acetaldehyde gas dosing (D), purging in synthetic air (P), and UV irradiation (UV), respectively, on ¢ TiO,, and d SO,— TiO, films. Solid curves represent results from the micro-kinetic modeling. Reprinted with permission from Ref. [95]](https://figures.academia-assets.com/102285378/figure_013.jpg)
![Fig. 7 Images of the three facets from Raman microscope (a—c), and the corresponding Raman spectrum (d-f) for (211), (110), and (101) facets, respectively. Reproduced with permission from Ref. [50]](https://figures.academia-assets.com/102285378/figure_007.jpg)
![Fig.6 Schematic view of the sample and experimental conditions. The sample is confined in a cell, which allows simultaneous gas phase treatment and illumination from to top side. Arrows show the direc- tion of the gas flow, illumination, and incident X-ray micro-beam. The X-ray micro-beam probes non- noble metal chemical states and structure as a function of the depth from the surface. Panels at the right hand depict the most relevant metal-containing phases (Cu(0) brown color; Cu(II) black color) for differ- ent depths described by the light intensity received. Cu and CuNi samples are considered. Reproduced with permission from Ref. [36]](https://figures.academia-assets.com/102285378/figure_006.jpg)
![Fig.9 Schematic illustration of the in situ XPS test procedure, which introduces an optical fiber into the vacuum chamber (a). The in situ XPS spectra of b Bi 4f, ¢ Ti 2p, and d O1 s under visible light illumina- tion. Reprinted with permission from Ref. [53]](https://figures.academia-assets.com/102285378/figure_009.jpg)
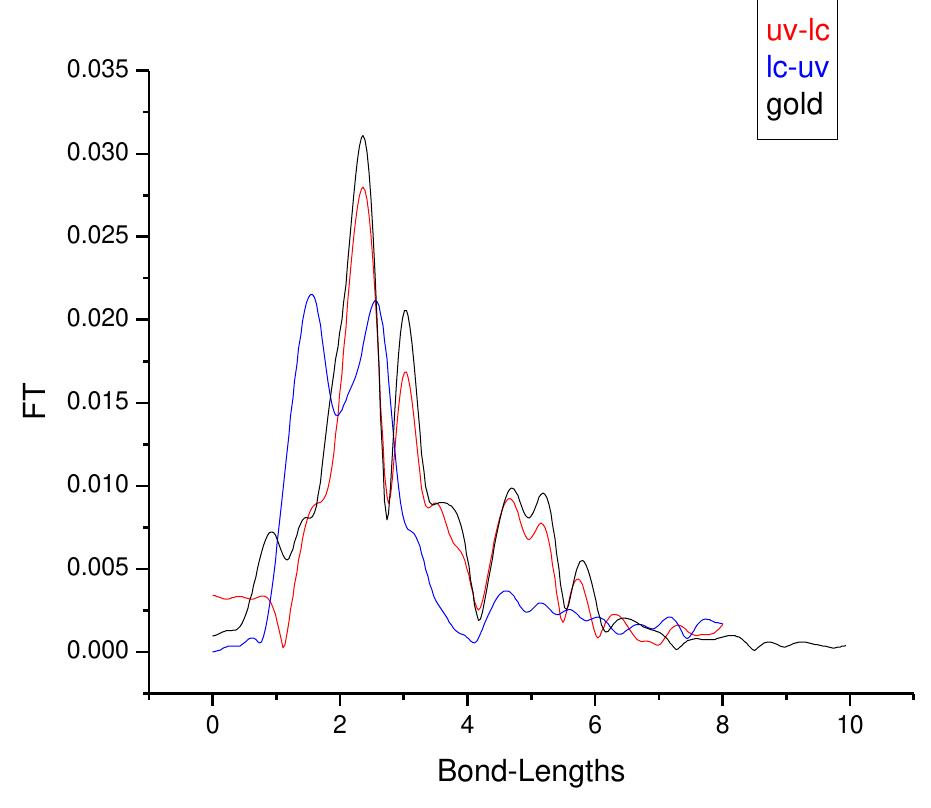
![Fig.5 a Time profile of H, production by Co-Ru-UIO-67(bpy) under 447 nm LED illumination at 9 mW in the presence of TEOA (0.3 ml) and H,O (0.4 ml) in acetonitrile solution (3 ml). The inset is the duration of induction period as a function of Co-Ru-UIO-67(bpy) concentration and LED power. b In situ XANES spectra of Co-Ru—UIO-67(bpy) as a function of irradiation times. The insets are enlarged regions I and II. e The offset first derivative of in situ XANES spectra. d In situ XANES spectra of Co-Ru-UIO-67(bpy) after LED was switched off to observe change back to the original spectrum. The comparison of XANES (e), EXAFS (inset of e), and EXAFS spectra in R space f of Co-Ru-UIO-67(bpy) before illumination and the intermediate species formed after the induction period ends. Reproduced with permission from Ref. [43]](https://figures.academia-assets.com/102285378/figure_005.jpg)
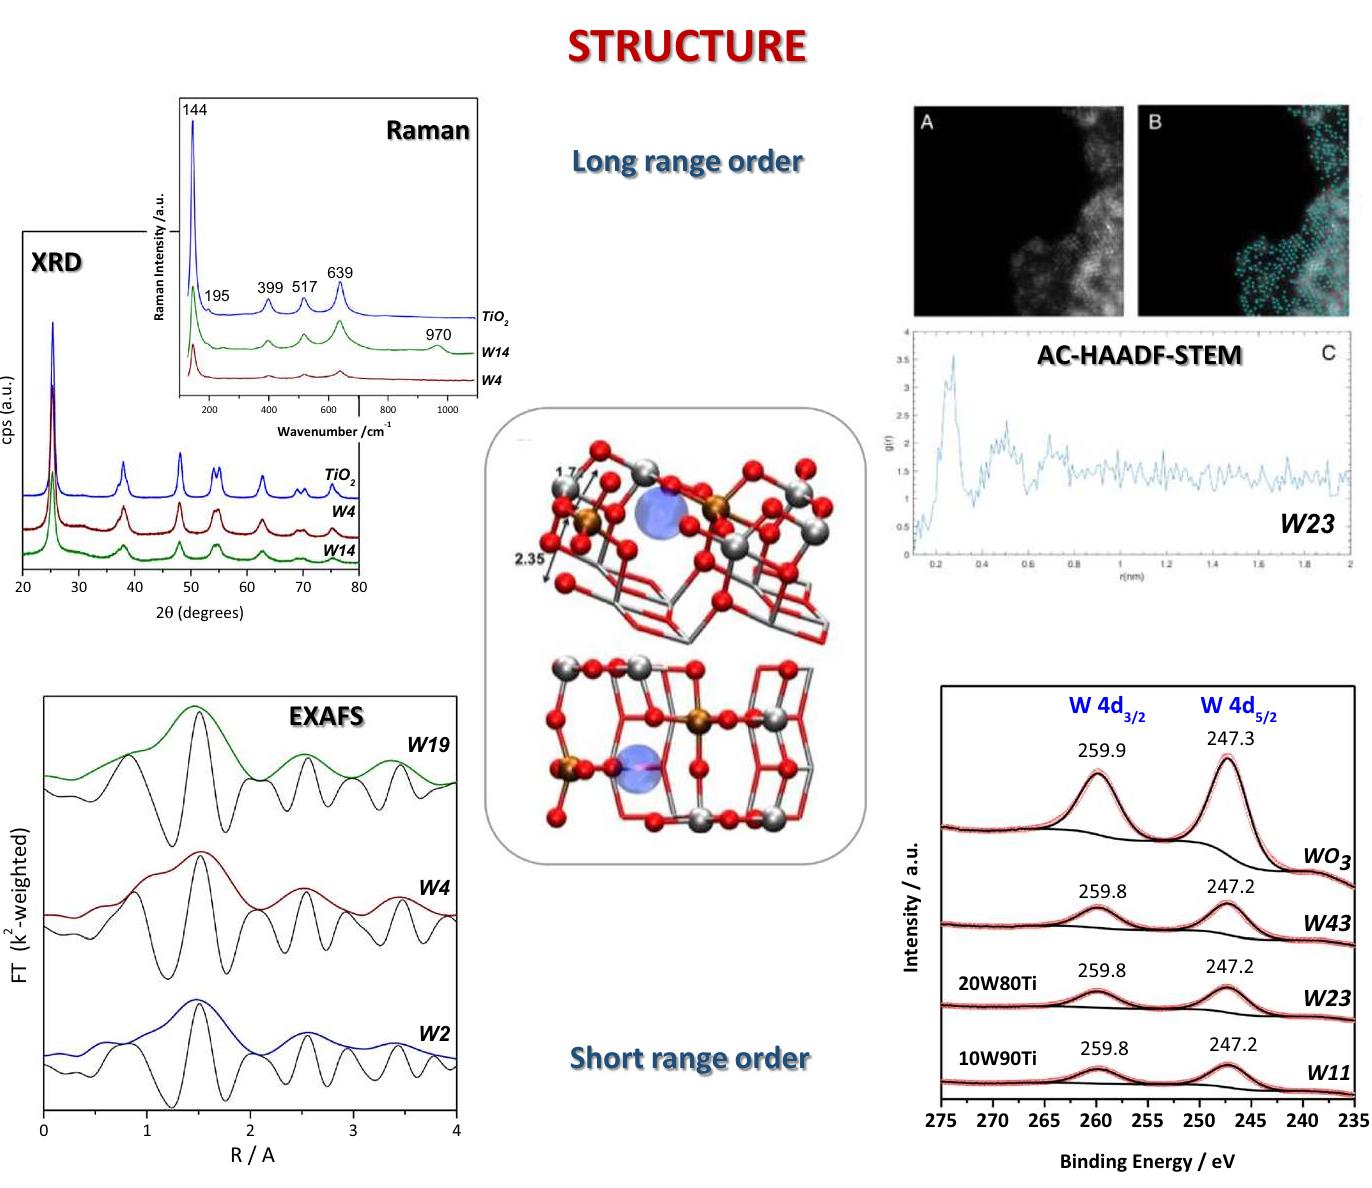
![Fig. 2 Results from experimental techniques used for electronic characterization of catalytic solids; anatase-based W-Ti mixed or composite oxides with names presenting the W atomic percentage in cati- onic basis. Center: schematic representation of main electronic bands and localized states at anatase. See text for details and anions of the material [30, 31]. In Fig. 2, we show the W L,-edge XANES spectra of tungsten cations at the anatase structure together with the W3d XPS peaks. The analysis of the XANES edge and XPS binding energy positions for these W-related signals indicates the presence of W(VJ) species in all Ti—W solid samples. The pre-edge of the XANES spectra (located at ca. 12107.1 eV) shows differences with respect to an octahe- dral W reference indicative of tetrahedral type local symmetry (which can be fur- ther detailed combining the data with EXAFS results, see above), as well as minor changes in the sp electronic density, which can be finely analyzed using the con- tinuum resonances (peaks after the edge). Combined with an analysis of the W Lym-edge XANES spectra, we can obtain a complete picture of the spd (cation) elec- tronic density and how it evolves in the Ti-W mixed oxide materials as a function of the tungsten content. This can be contrasted or combined with the information com- ing from an analysis of the valence band by XPS or by a combination of UPS (ultra- violet photoelectron spectroscopy) and XPS. The result is that a W(VIJ) cation has a](https://figures.academia-assets.com/102285378/figure_002.jpg)