The synthesis of various nanoscale materials, such as nanoparticles, nanowires of Au, Pt, Ni Co, Fe, Ag etc., by electrodeposition techniques have been demonstrated in this article. Both potentiostatic and galvanostatic methods were...
moreThe synthesis of various nanoscale materials, such as nanoparticles, nanowires of Au, Pt, Ni Co, Fe, Ag etc., by electrodeposition techniques have been demonstrated in this article. Both potentiostatic and galvanostatic methods were employed to carry out the electrodeposition process under different potential ranges, time durations, and current densities. The electrochemical behavior of the deposited nanoparticles on various substrates was investigated by cyclic voltammetric and chronoamperometric techniques. The synthesis of mono-dispersed gold (Au) nanoparticles on indium tin oxide (ITO) coated glass, preparation of Au nanorods on nanoporous anodic alumina oxide (AAO), formation of Au nanoclusters on polypyrrole-modified glassy carbon electrode and one-step electrodeposition of nickel nanoparticle chains embedded in TiO 2 etc. have been highlighted in this article. The potential applications of synthesized nanoparticles such as the role of maghemite (Fe 2 O 3) in arsenic remediation, higher electrocatalytic activity of Ag nanoclusters for the reduction of benzyl chloride, and the role of C 60 nanoparticle-doped carbon film in fabrication processes are also presented in this article.

![Figure 7. (a) N> adsorption isotherm at -196 °C and (b) pore size distribution of the materials studied. recently [18].](https://figures.academia-assets.com/67118185/figure_006.jpg)
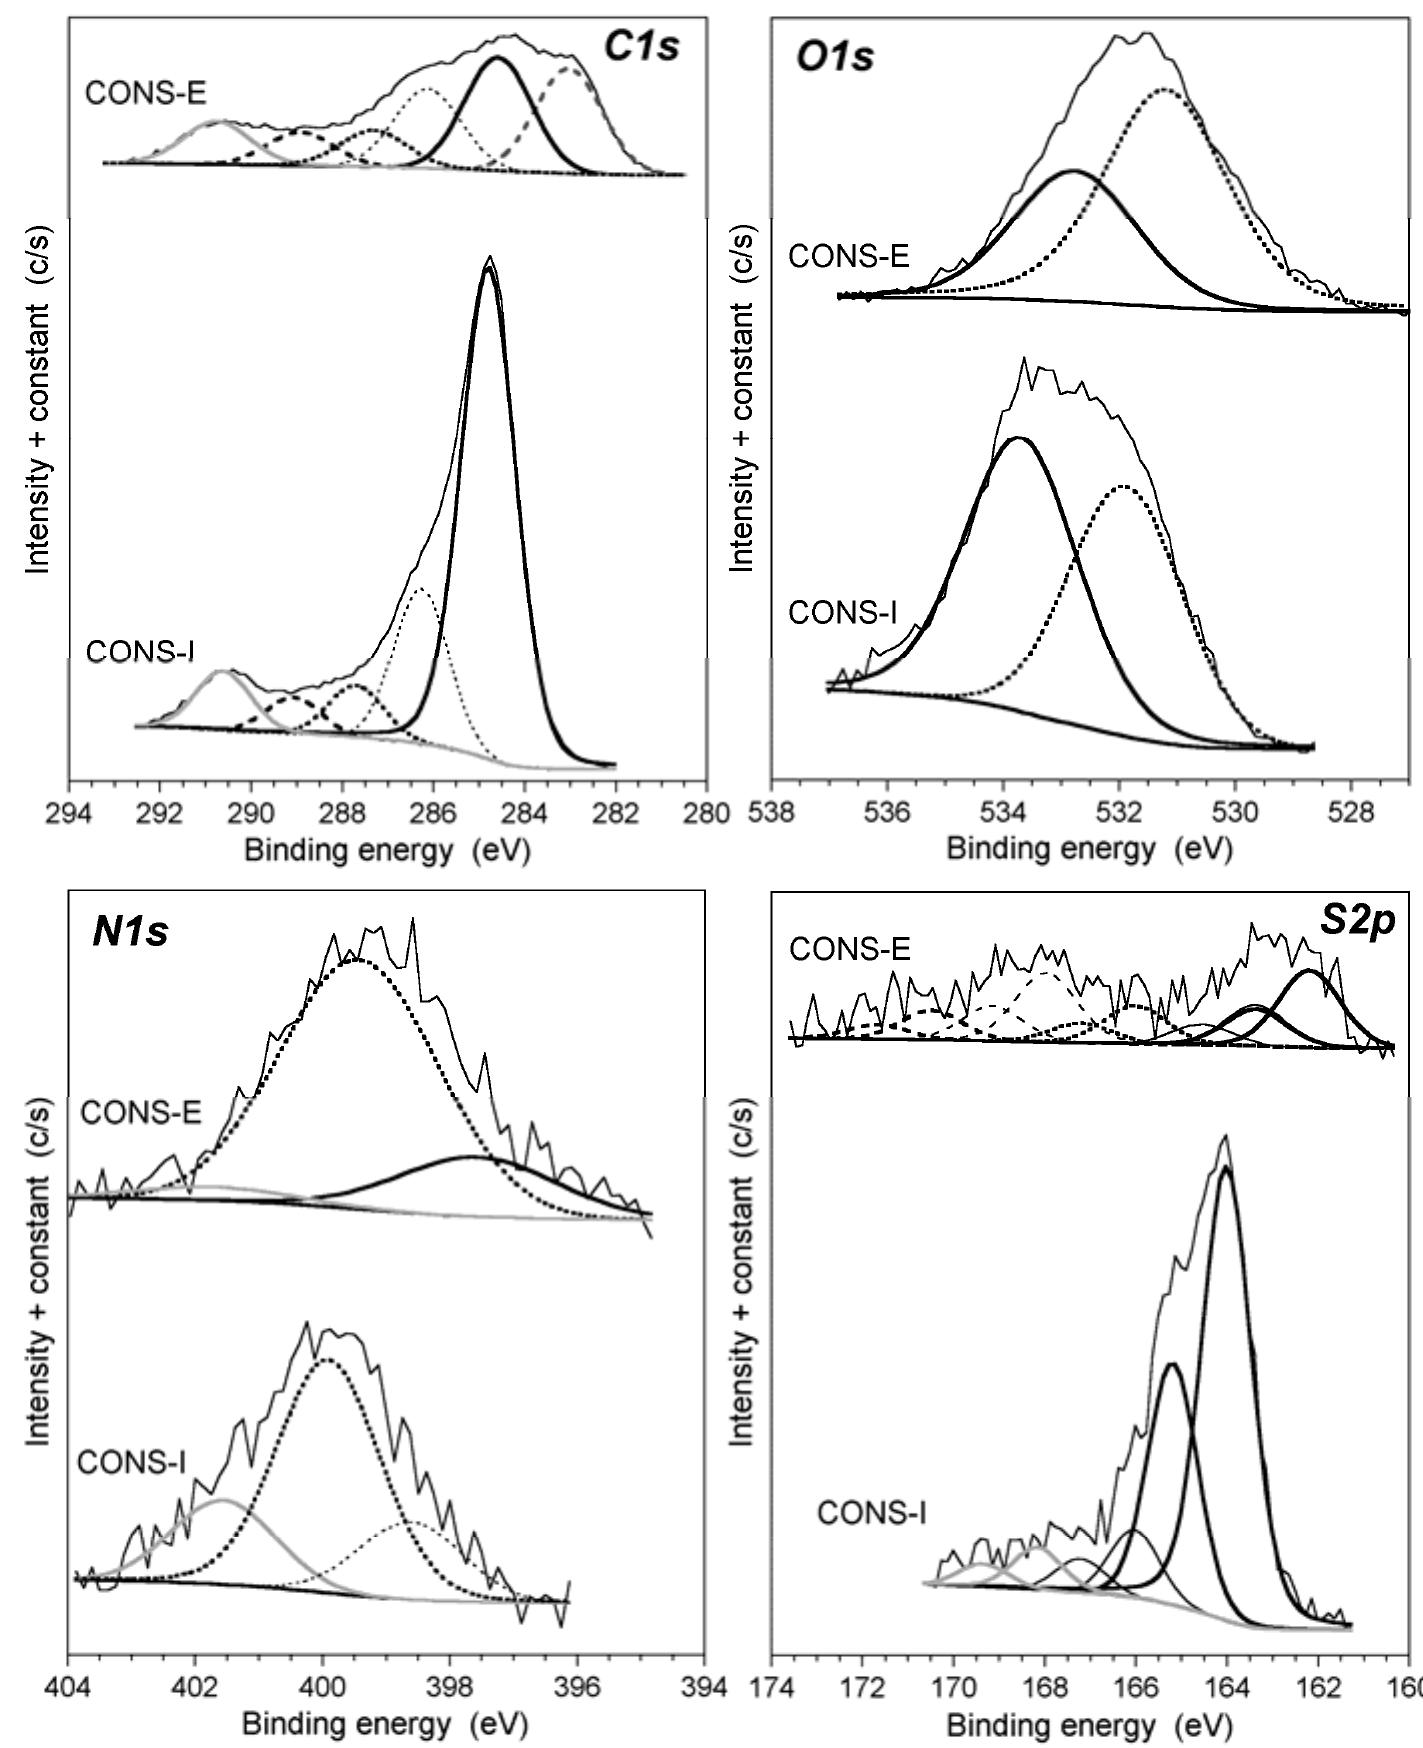
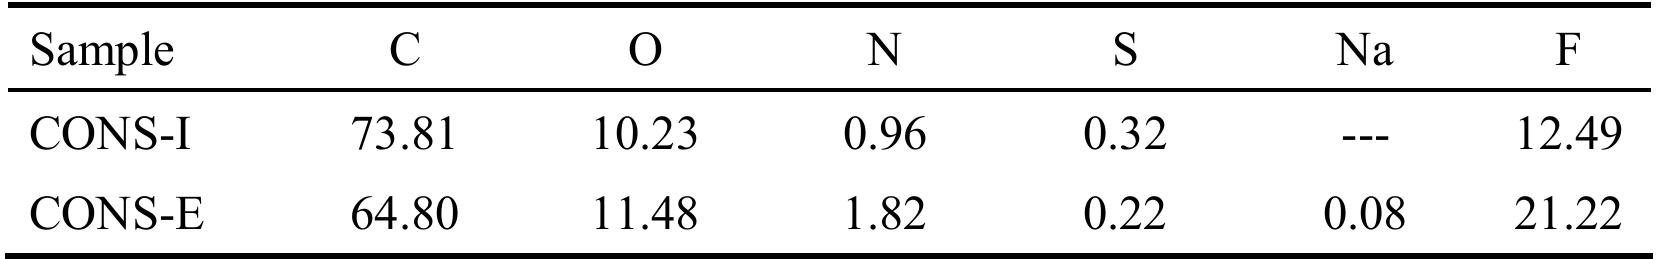
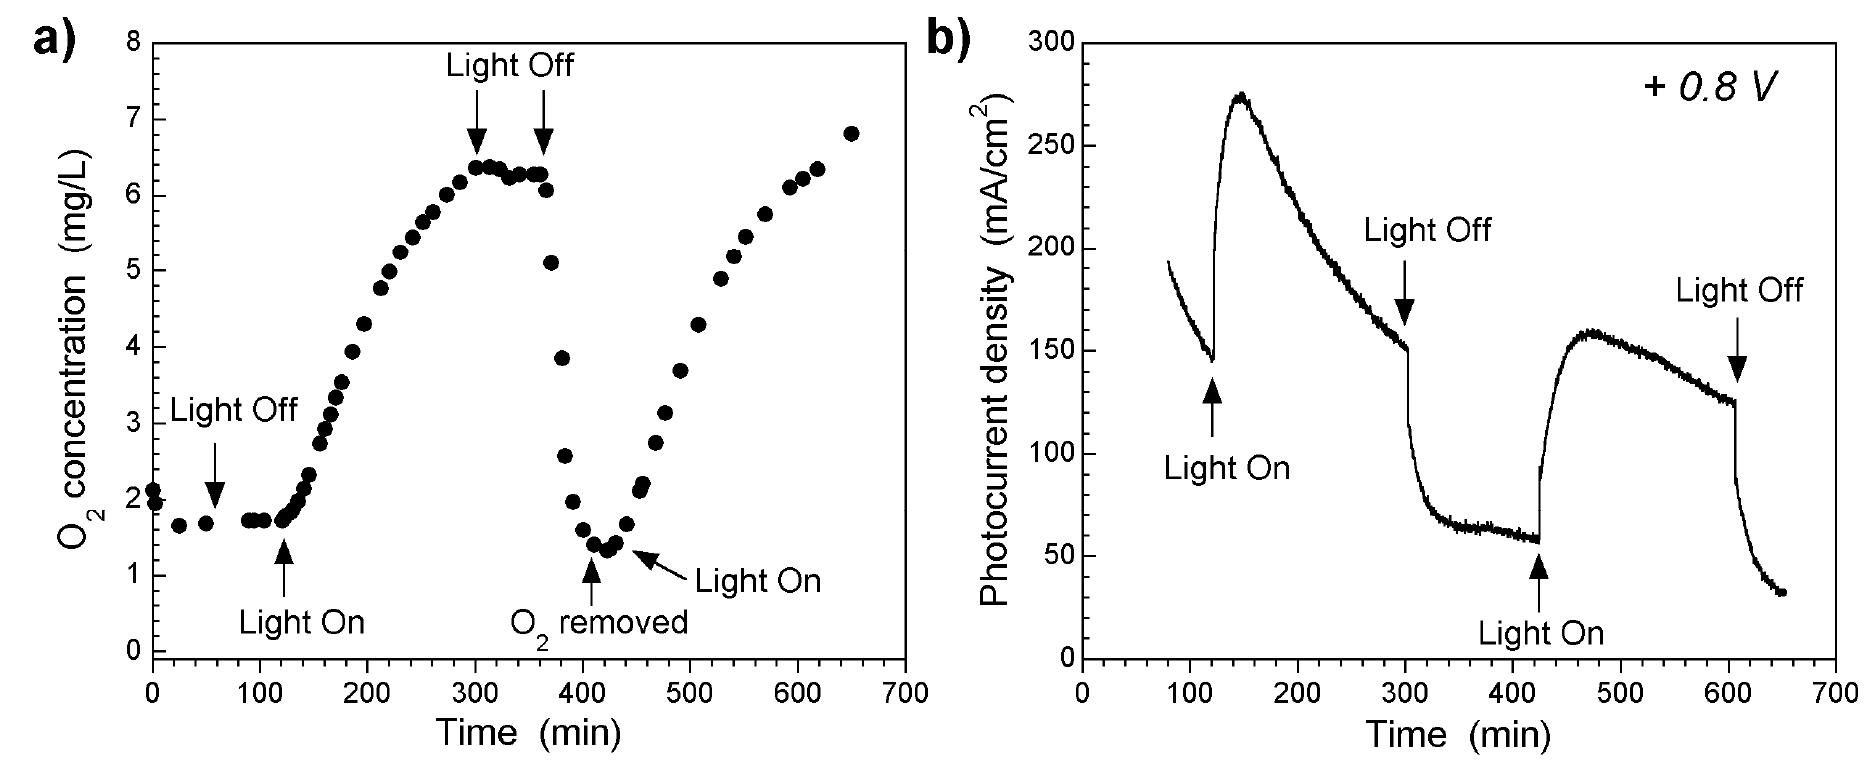
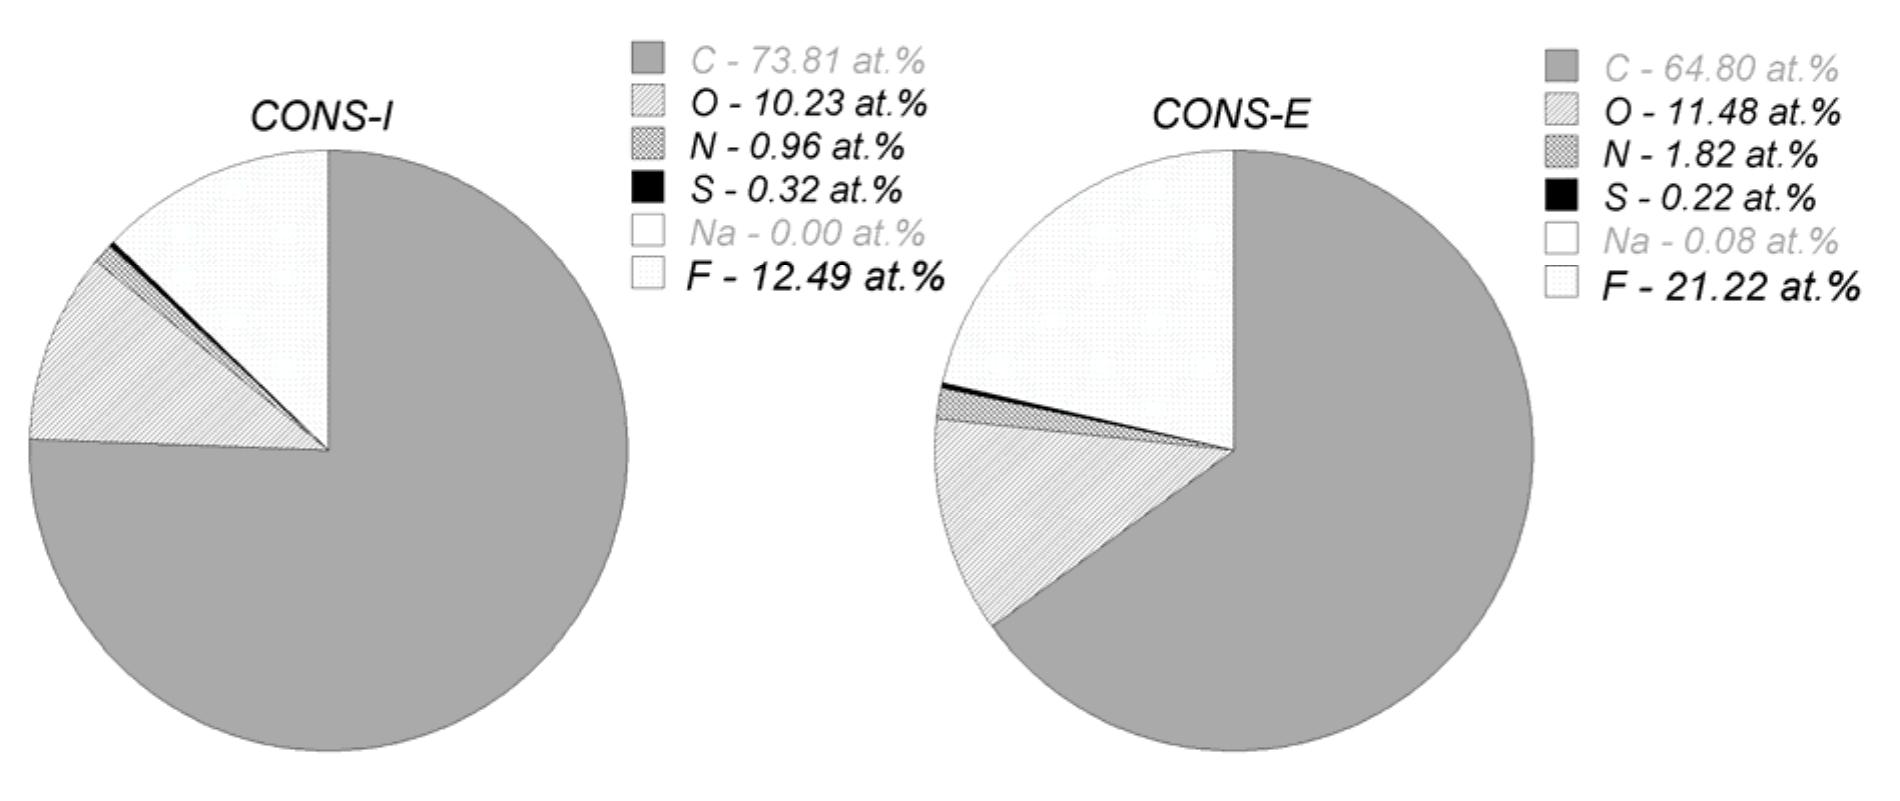
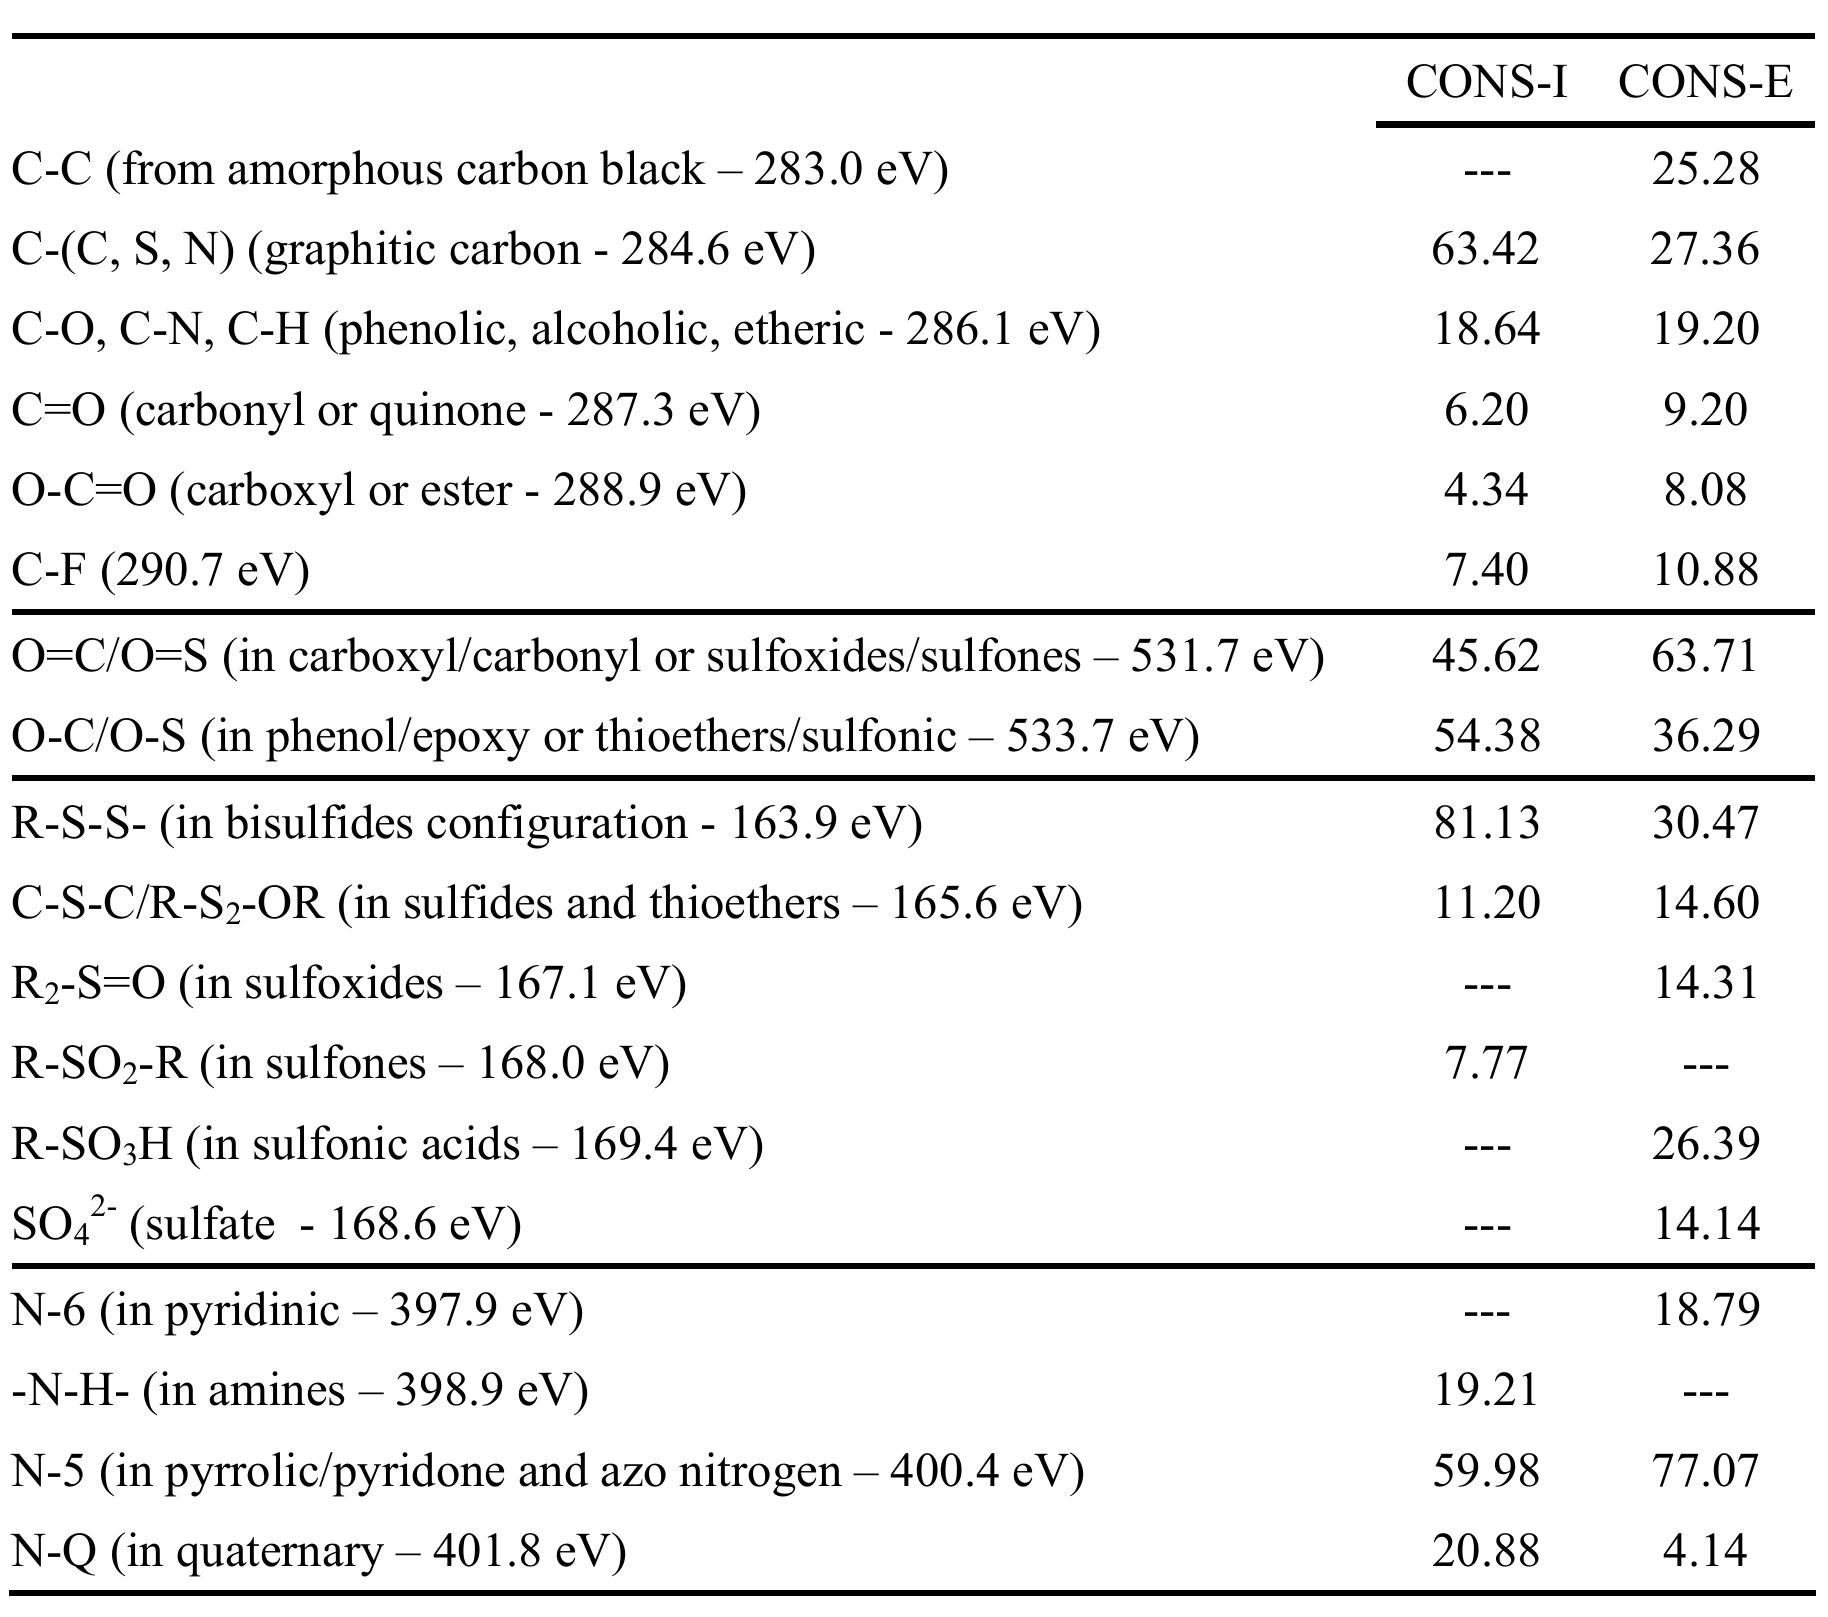
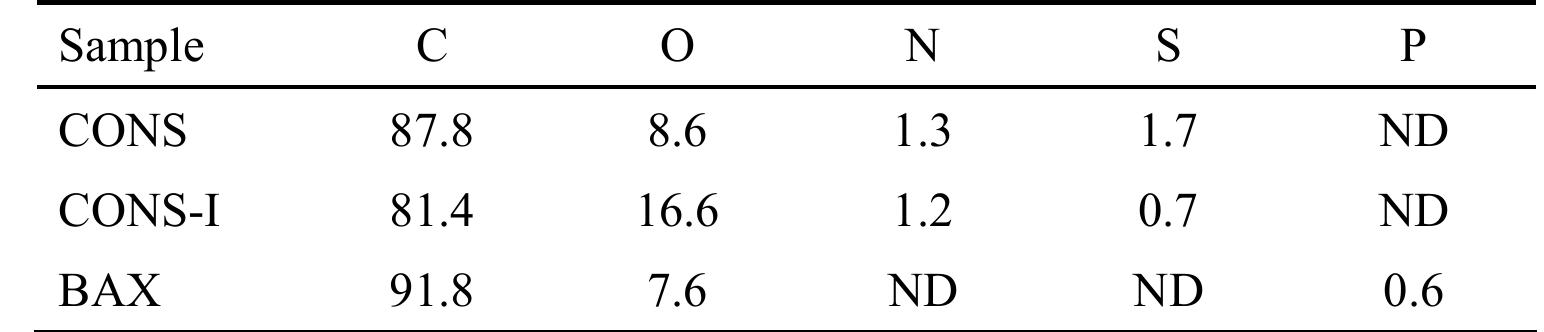
![Figure 5. Surface concentration (at. %) of carbon, oxygen, sulfur and nitrogen species obtained by fitting the C 1s, O 1s, S 2p and N 1s core level peaks of XPS spectra. electrode by the photogenerated O», can also take place [25].](https://figures.academia-assets.com/67118185/figure_004.jpg)
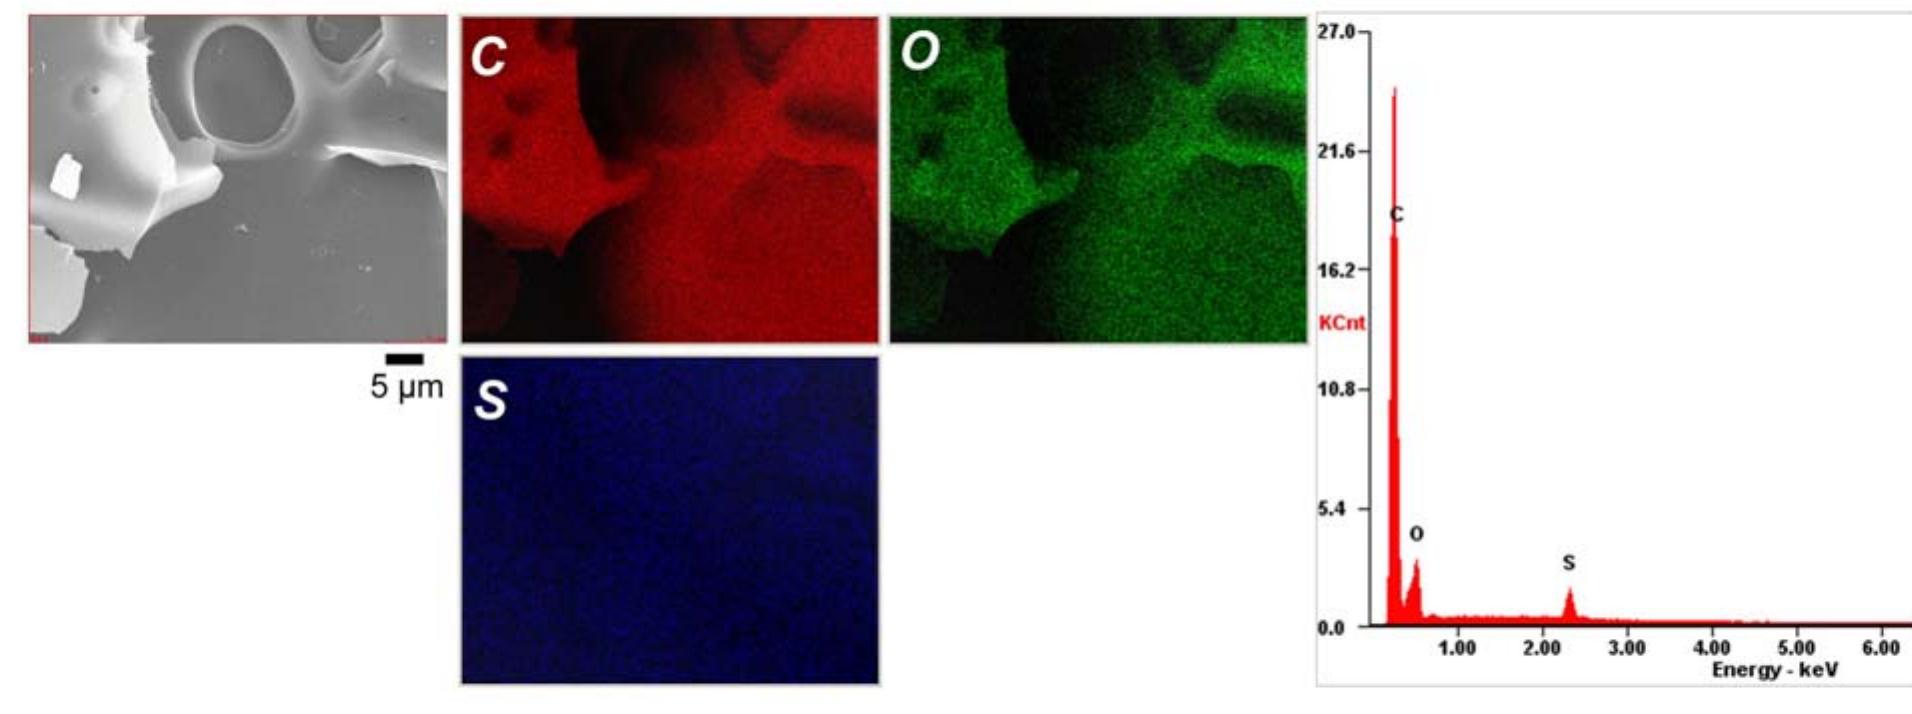
![Figure 8. Characterization of the materials studied: a) HRT] EM; b) SI EM images, respectively; c) DC conductivity. As seen from Table 2 is it three orders of magnitude greater than that for the The optical properties of amorphous carbon materials (photoactivity and photoluminescence)](https://figures.academia-assets.com/67118185/figure_007.jpg)
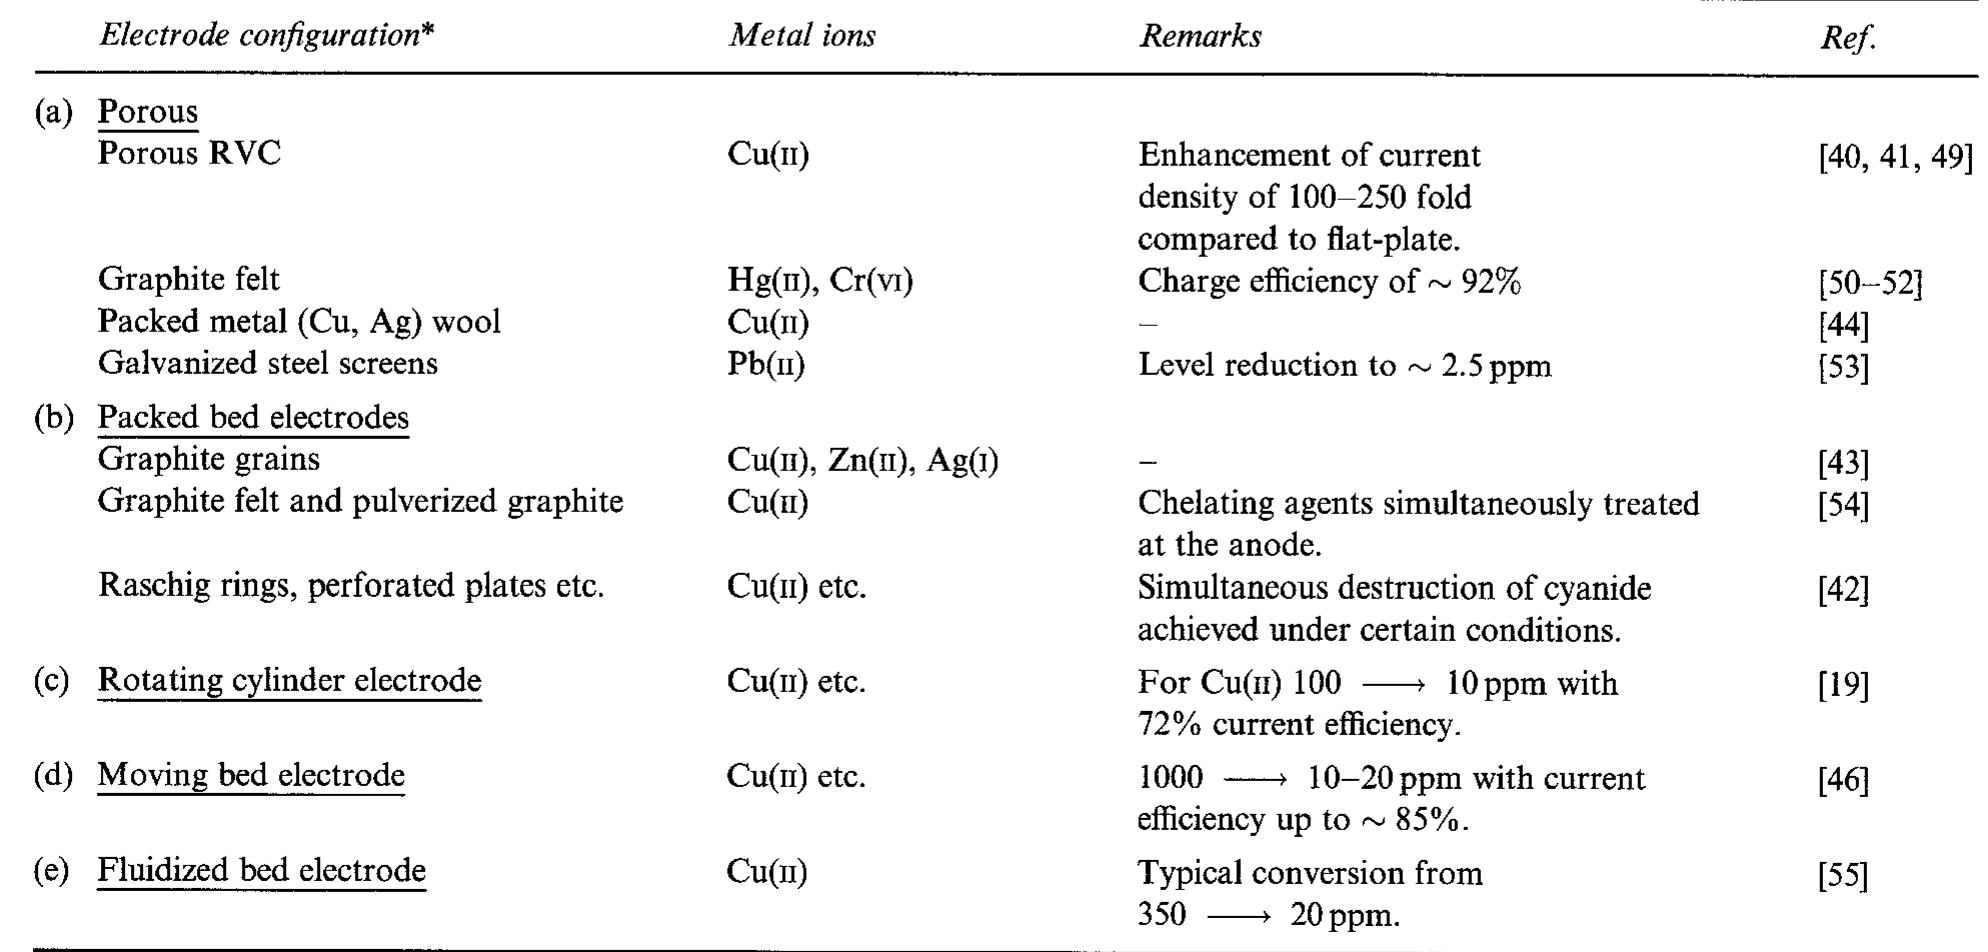
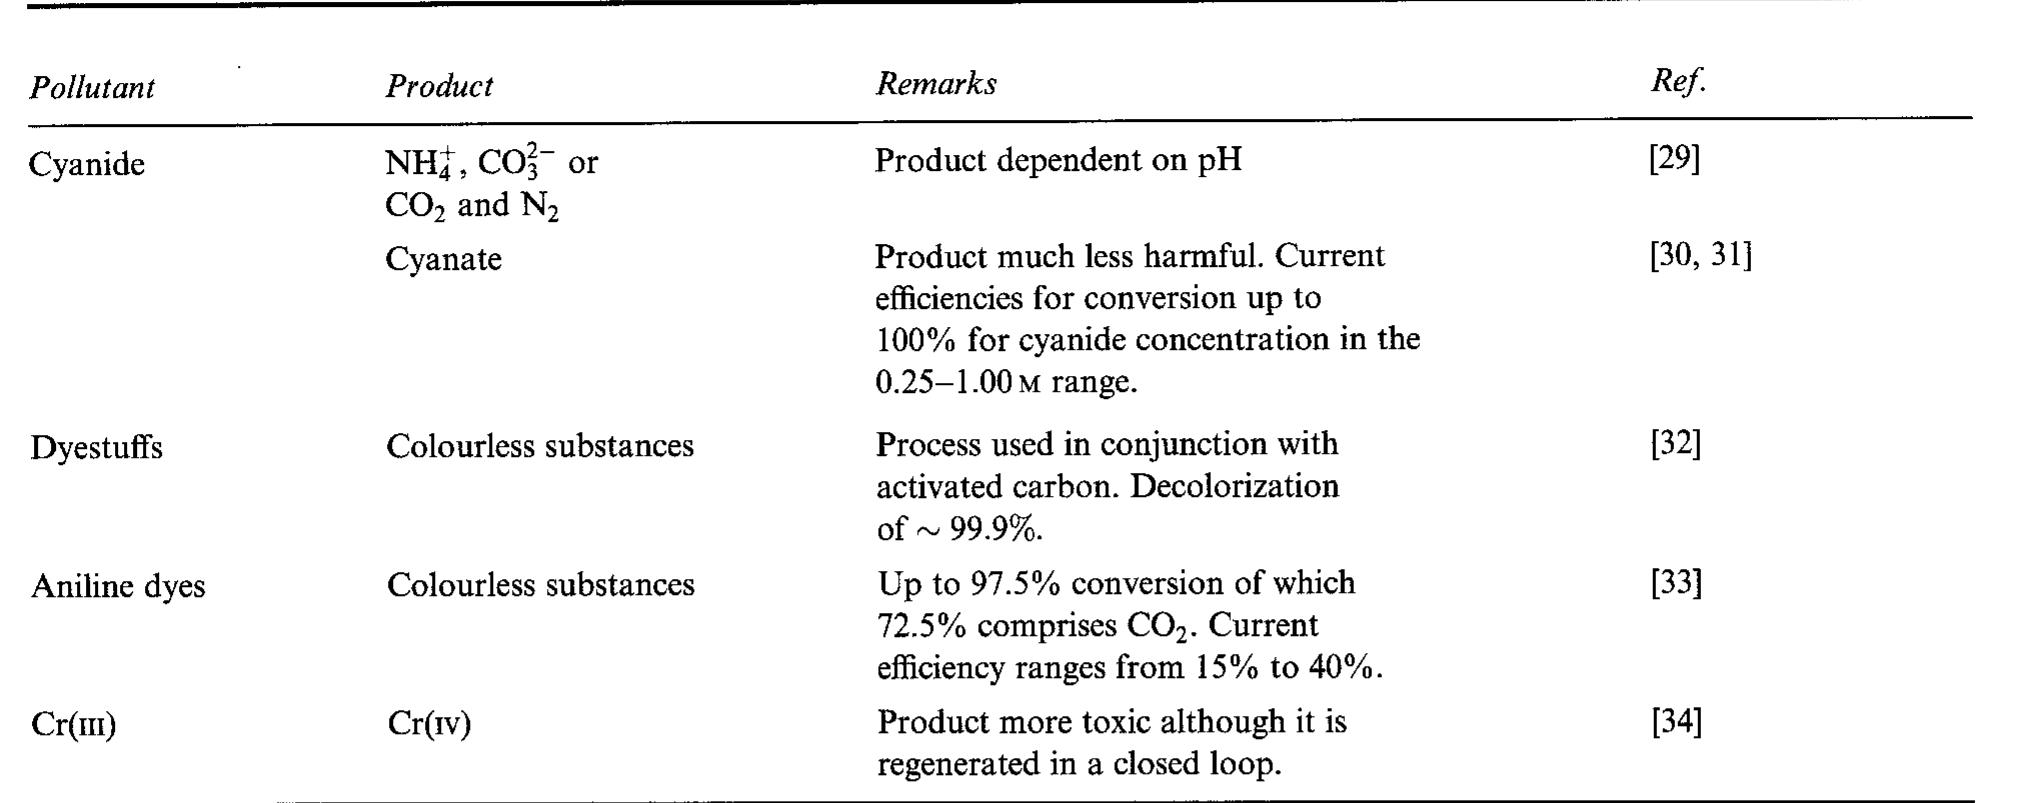
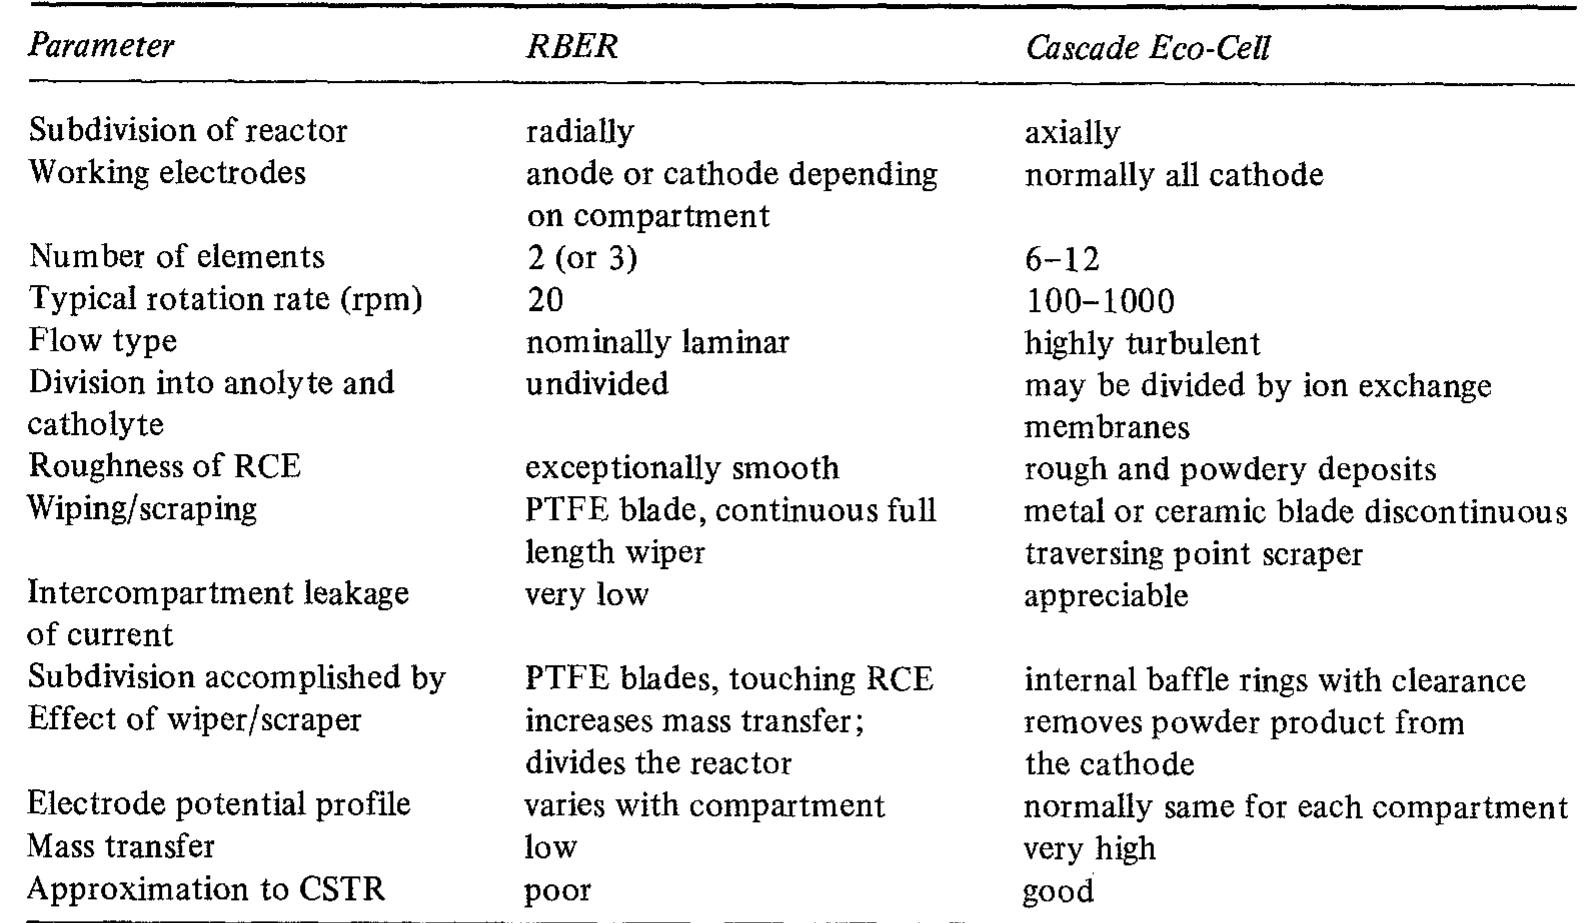
![Table 3. Some examples of indirect electrolytic processes rotating cylinder cells), whereas if [M"*] is below say lppm, three-dimensional electrodes are more appropriate (cf. Fig. 1). A review of electrochemical reactor systems for the recovery of metals and for pollution control applications, including a com- parative economic analysis is available [25]. separation step. To avoid the need for separation, the redox couple (e.g. SnO,, CrO3, Sb,O3) can be immobilized on an electrode surface [30, 65, 66].](https://figures.academia-assets.com/43721619/table_003.jpg)
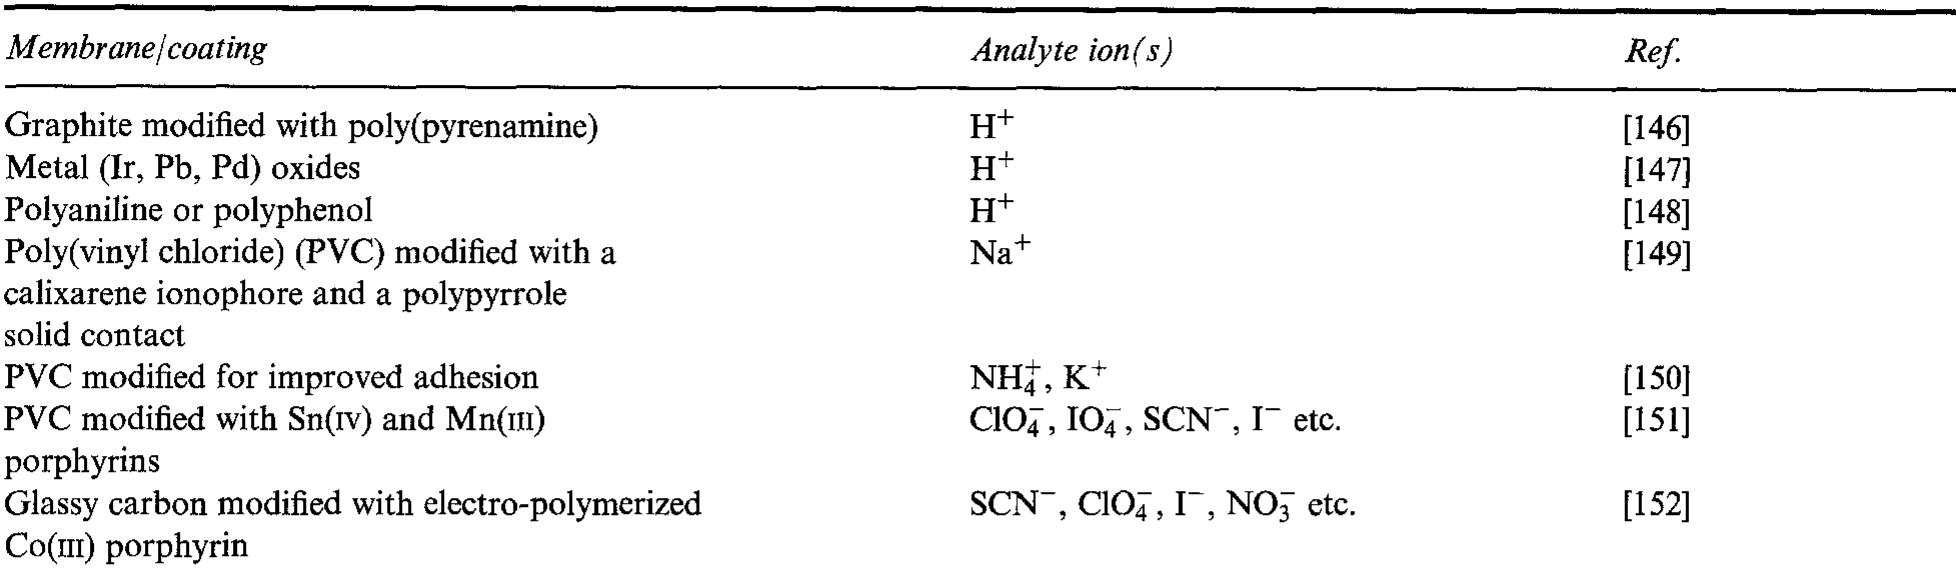
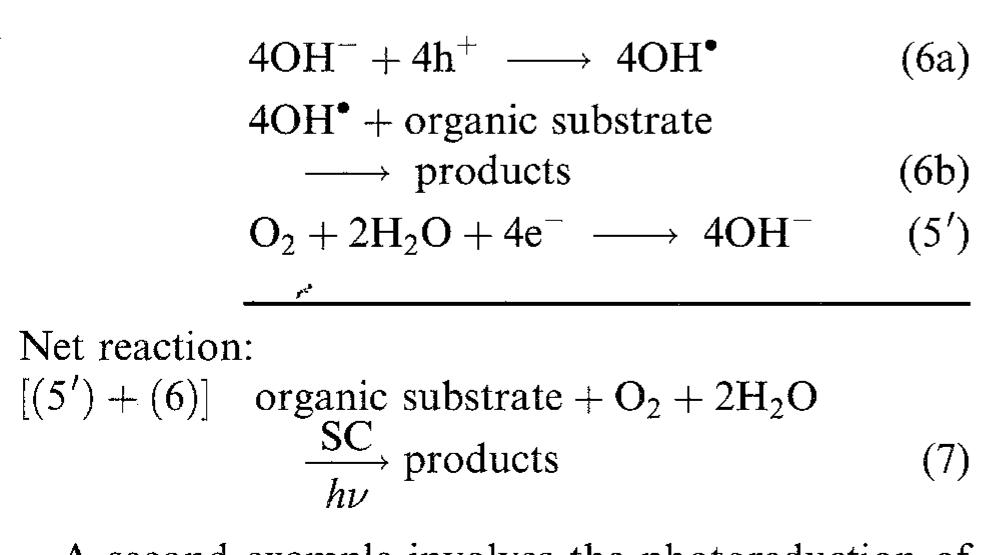
![Table 5, Representative examples of trace analyses using stripping voltammetry solvent, electrode material, membrane characteristics, pH, electrode potential, temperature, etc. The adsorp- tive accumulation of the analyte (i) improves the sen- sitivity of the measurement (10 to 100-fold over solution phase voltammetry), an especially useful attribute when low concentrations of analyte must be detected, (ii) renders the analysis less prone to mass-transfer limitations, (iii) improves the selectiv- ity of the measurement in complex matrices, and (iv) reduces interference from organic constituents of the sample matrix which can interfere with the mass trans- port to the electrode surface and the electron transfer between the analyte and the electrode surface. depends on their oxidation state and chemical form [199]. For example, inorganic mercury is much more toxic than the organoderivatives. Arsenic(v) is about 50 times less toxic than As(). Similarly, Cr(v1) is much more toxic than Cr(m). Finally, like mercury, organolead compounds are much more toxic than the inorganic derivatives. Electro- analytical chemistry offers a convenient route to metal speciation and selective assay. Let us consider arsenic as a model system.](https://figures.academia-assets.com/43721619/table_005.jpg)
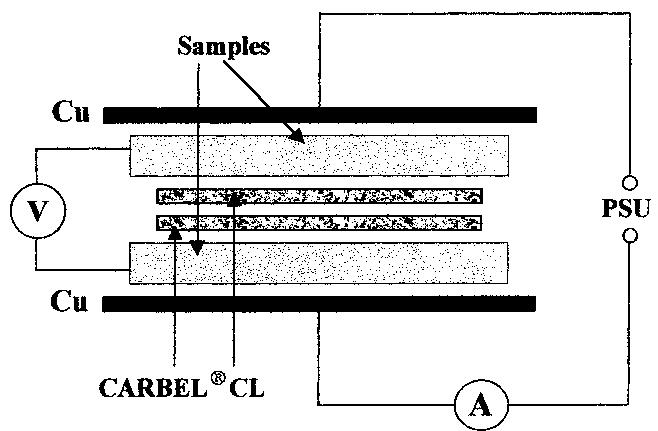
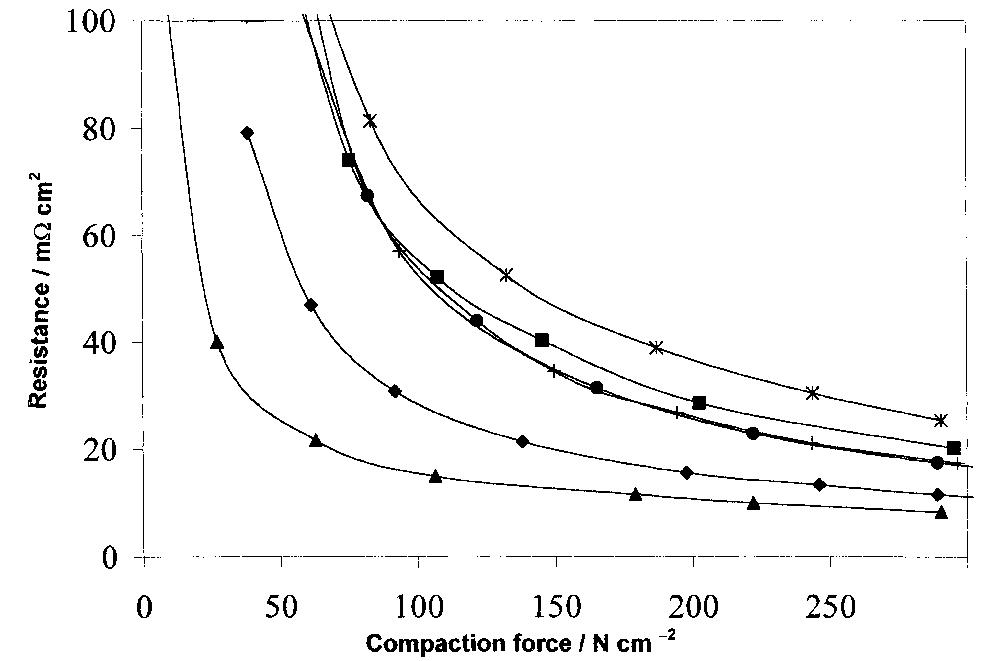
![Table 2. Data for bipolar plate materials* * Stainless steel grades using the American Iron and Steel Institute (AISI) convention. Surface resistance measured at 220 N cm~? technique described t Balance iron [16] using tl](https://figures.academia-assets.com/49512107/table_002.jpg)
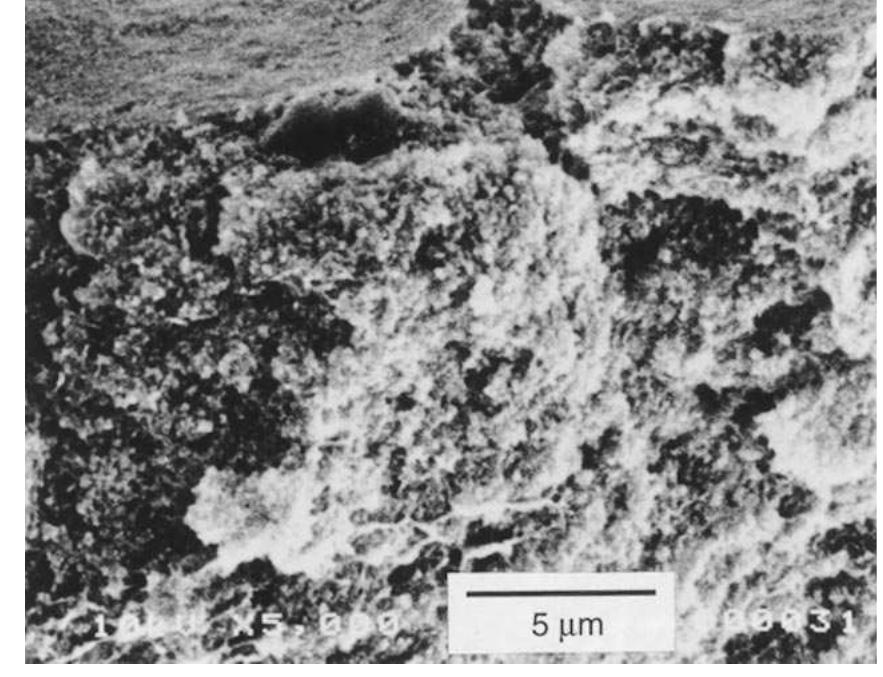
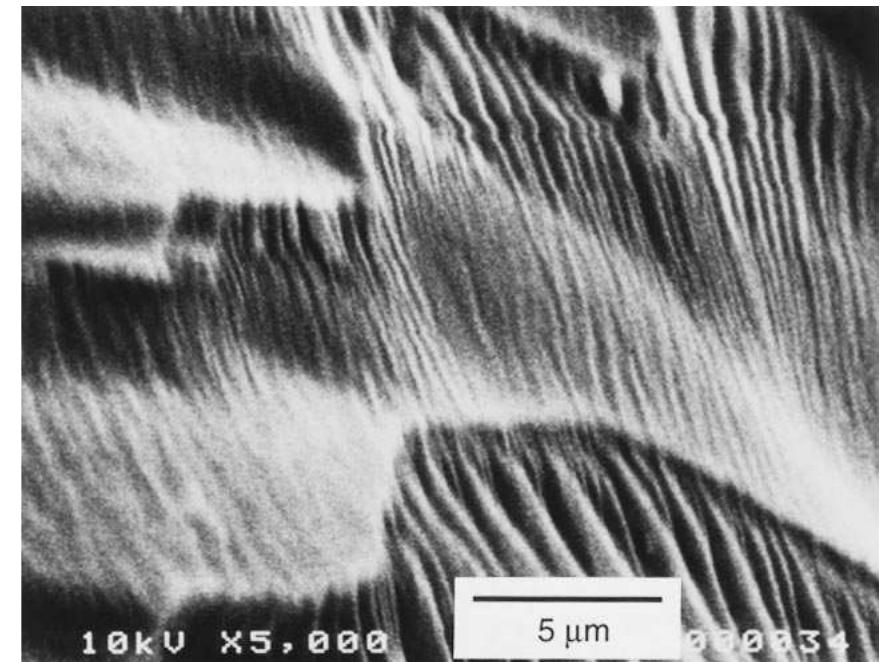
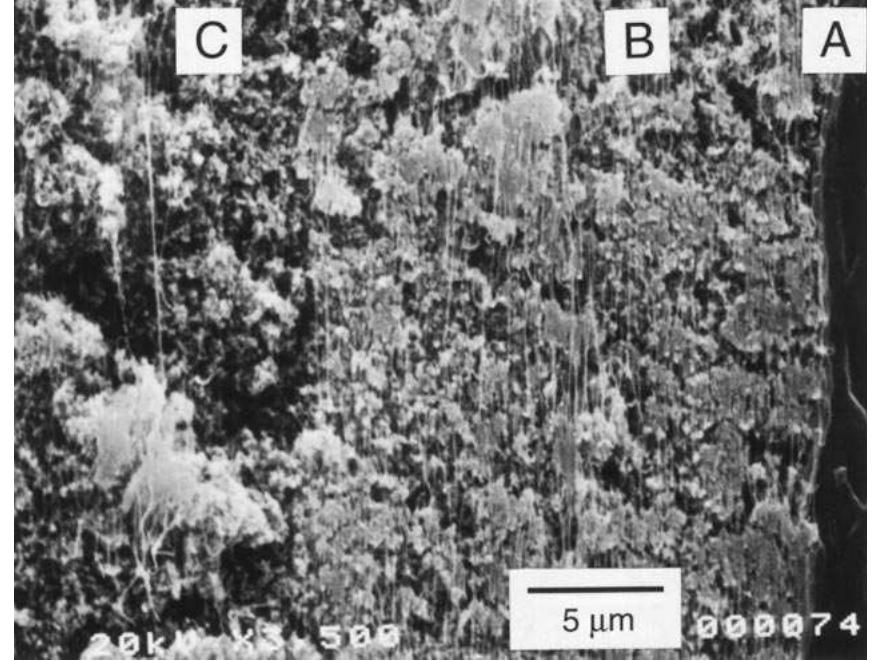
![Fig. 9. Freeze-fractured cross section of the membrane®-electrode assembly: (a) Nafion® 117 membrane, (b) impregnated active cat- alyst layer. A SEM study was carried out for the membrane— electrode assembly and the Nafion®/carbon compo- site. These two samples were chosen in order to il- lustrate the structure of the active catalyst layer for membrane-electrode assemblies obtained by two different techniques: electrode impregnation with Nafion® solution and hot-pressing to the Nafion® membrane [22], and mixing of Nafion® solution with catalyst particles and hot-pressing to the membrane (uncatalysed carbon paper or carbon cloth is later used as a gas diffusion backing) [31]. Figures 9 and 10 show parts of the membrane-electrode assembly where the membrane is hot-pressed to the im-](https://figures.academia-assets.com/49796741/figure_010.jpg)
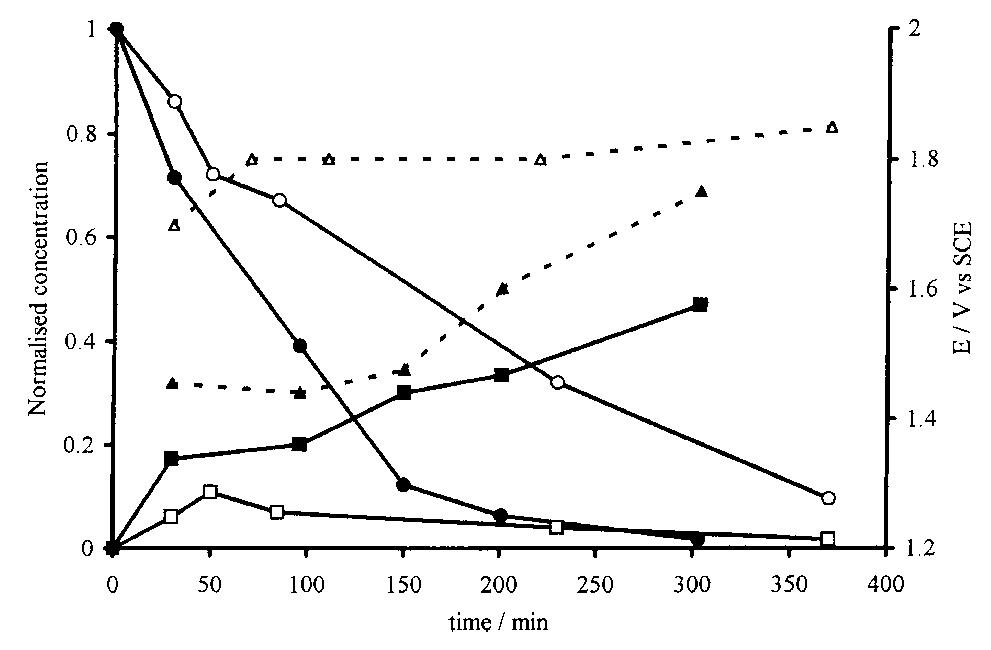
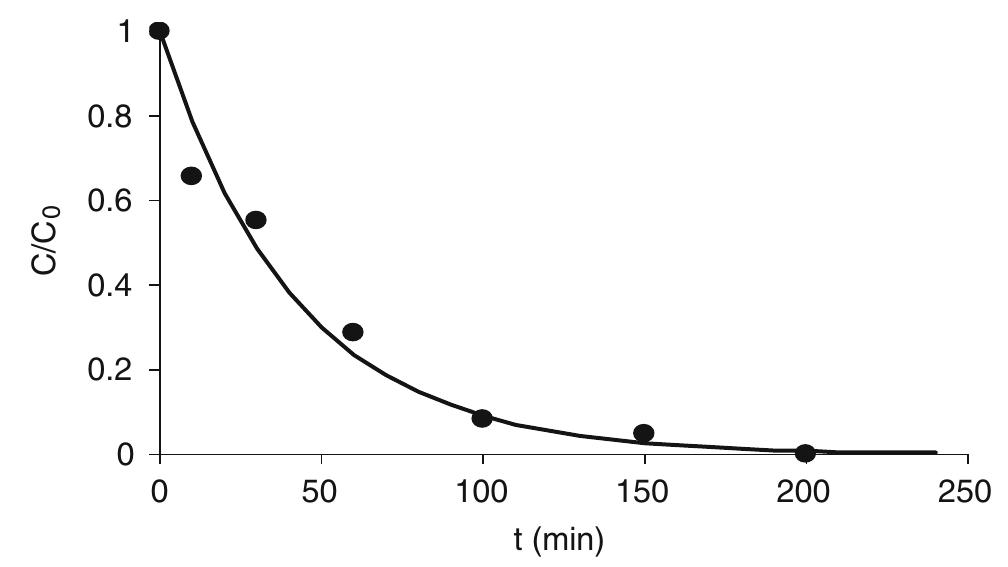
![Fig. 2. Trend in time of residual normalized COD (initial value, 1000 mg I”'; working temperature 25°C) during electrolyses in different experimental conditions. Ti/PbO,, en = 0: i= 8mAcm~ (0); i = 16mAcm™” (A); Ti rgPbO2 I ol lgdm™?: i = 8mA om (@); 7 = 16 mA cm™, (©); en [Cl] = 0,i = 16 mA cm” (®).](https://figures.academia-assets.com/42424522/figure_002.jpg)
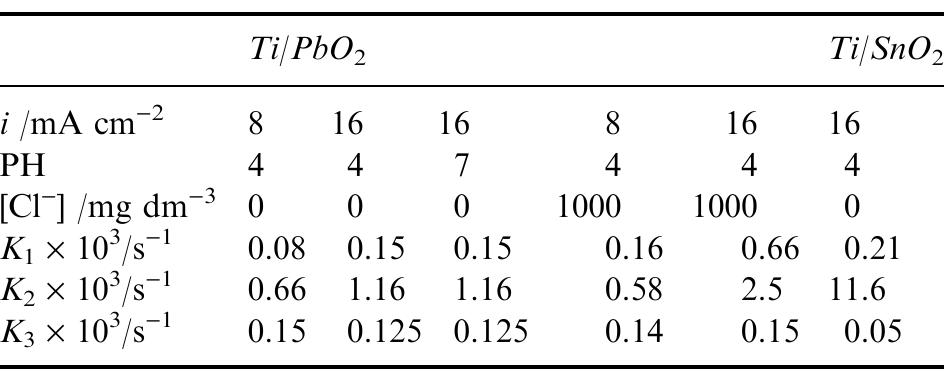
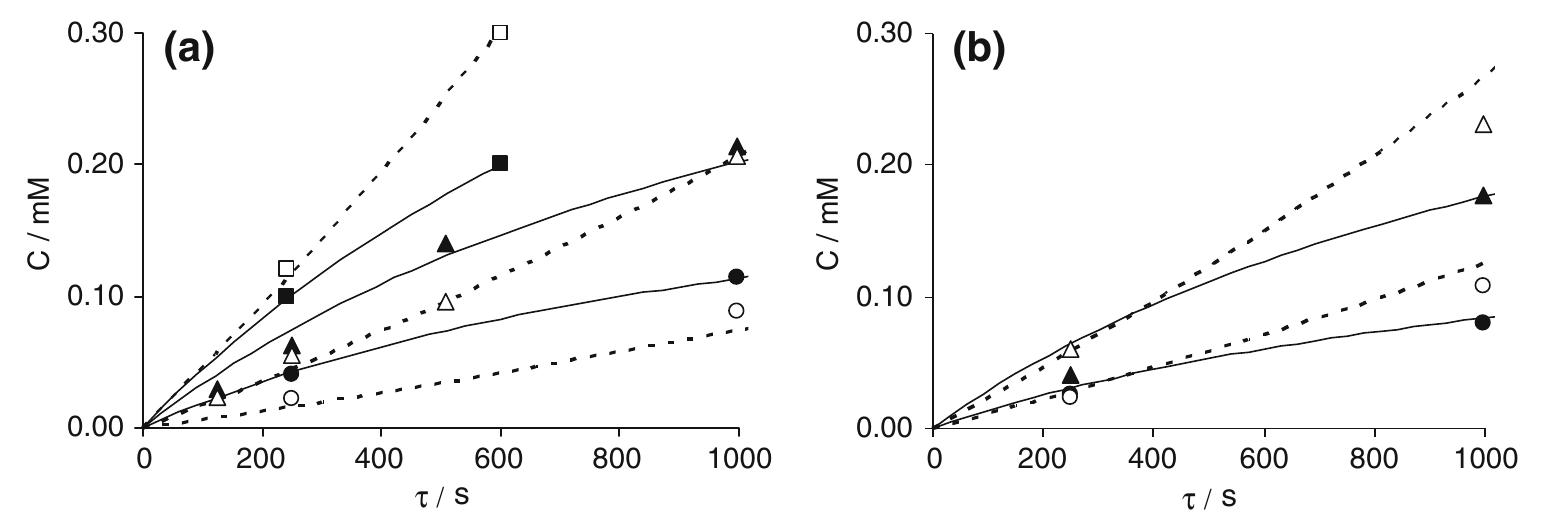
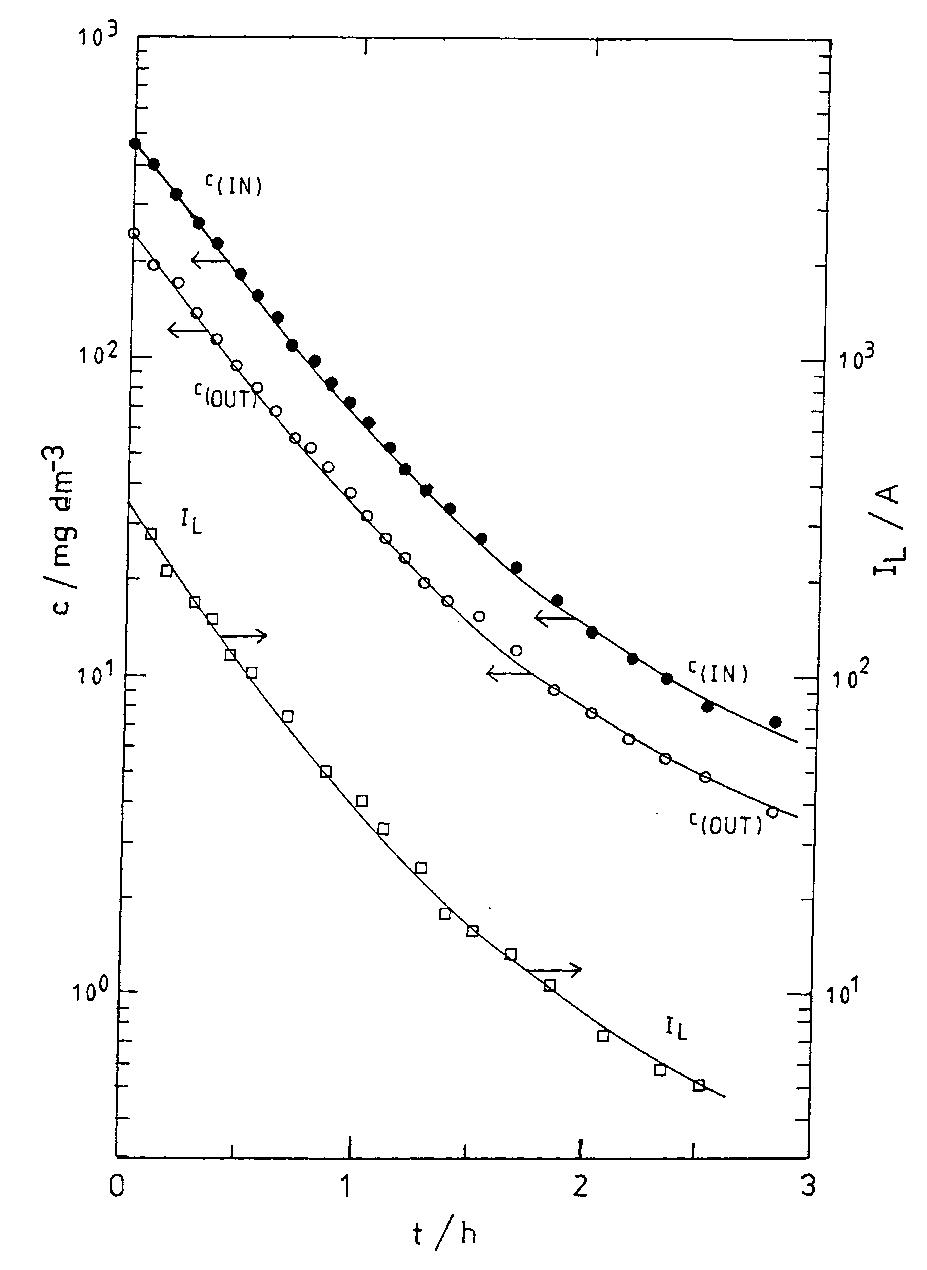
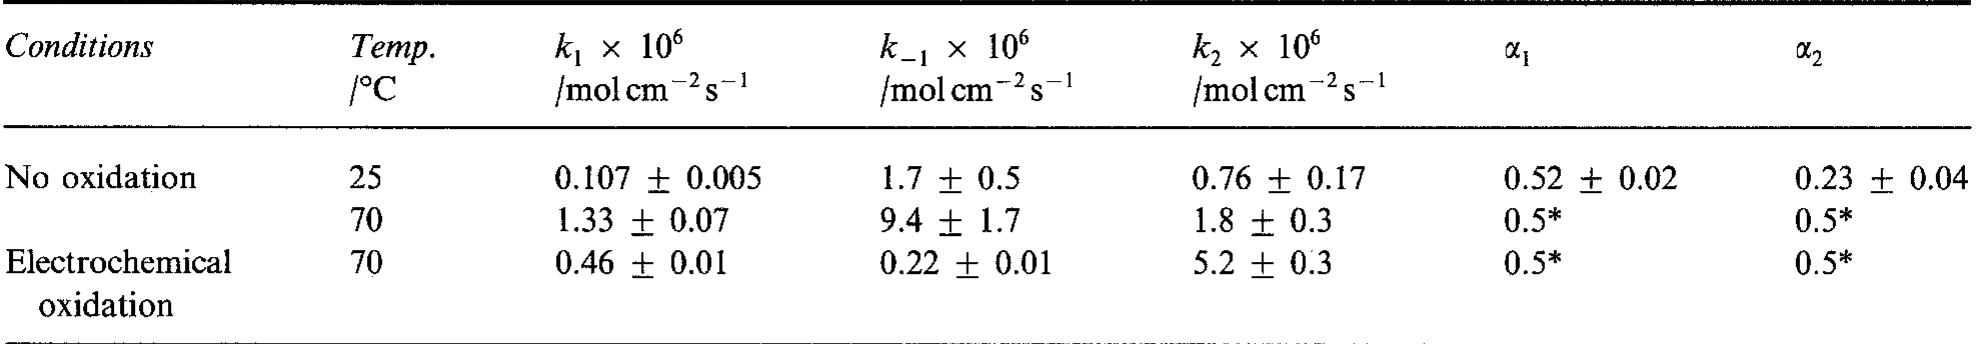
![As also observed from Table 1, the presence of NaCl in the electrolyte causes an increase in K;, but it does not influence K3. The specific catalytic action of Moreover, at both kinds of electrode the second reaction step (ring opening) is faster than the first one in which quinonic compounds originate from chlorophenol oxidation. In particular, higher values of K, and Ky, as well as of the K/K, ratio, are ob- tained at Ti/SnO2 rather than at Ti/PbO2 anodes, so that a different distribution of cyclic intermediates was observed during electrolysis: a small amount of quinonic compounds was measured at Ti/PbO, an- odes while they were practically absent at Ti/SnO, anodes. This demonstrates the influence of the elec- trode material on the kinetics of the different reaction stages. Indeed, a previous study showed that the opening of aromatic rings became the controlling s c ep, when the electrochemical degradation of hlorophenols was performed at carbon electrodes [11]. Analogous results were obtained during oxida- tion of phenol [1]: quinonic compounds accumulated during electrolysis at Pt anodes, while small amounts of these compounds were found at SnO, electrodes.](https://figures.academia-assets.com/42424522/figure_004.jpg)
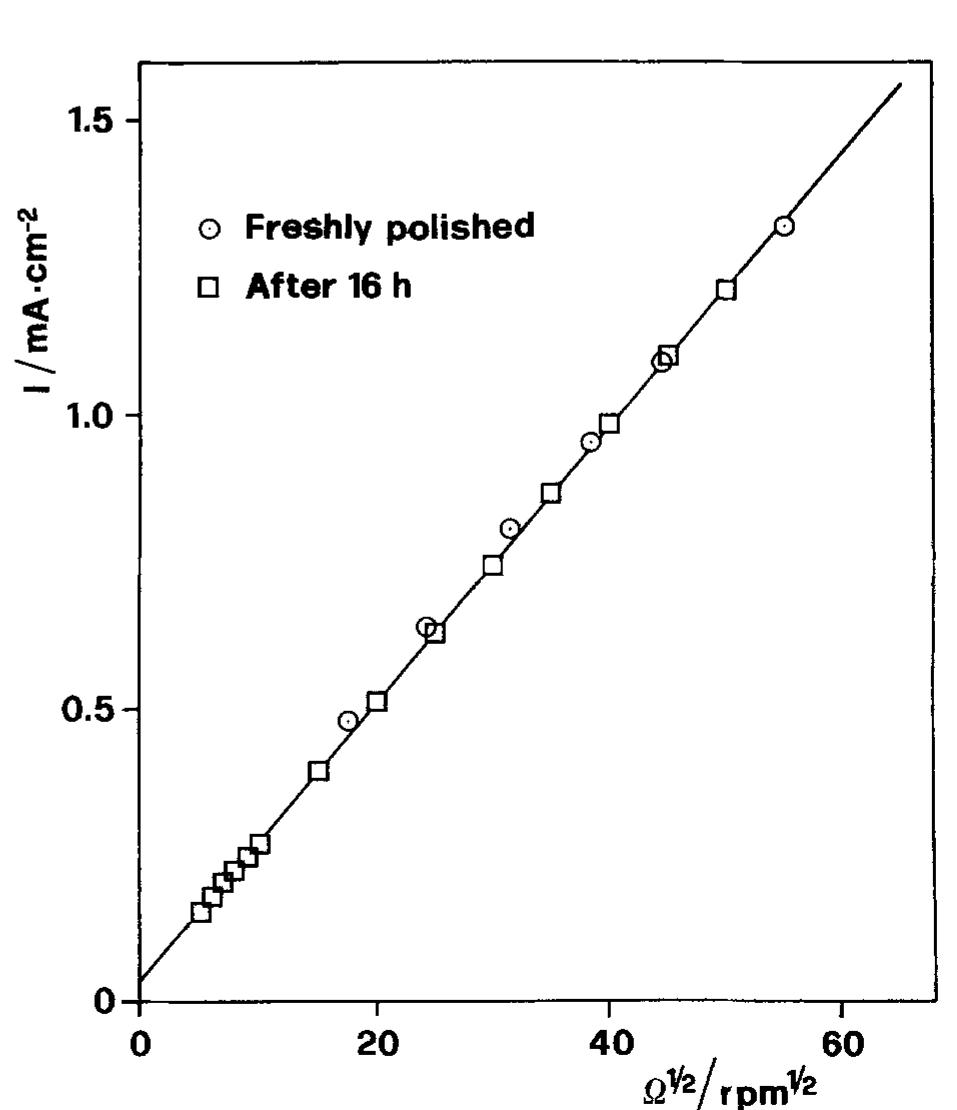
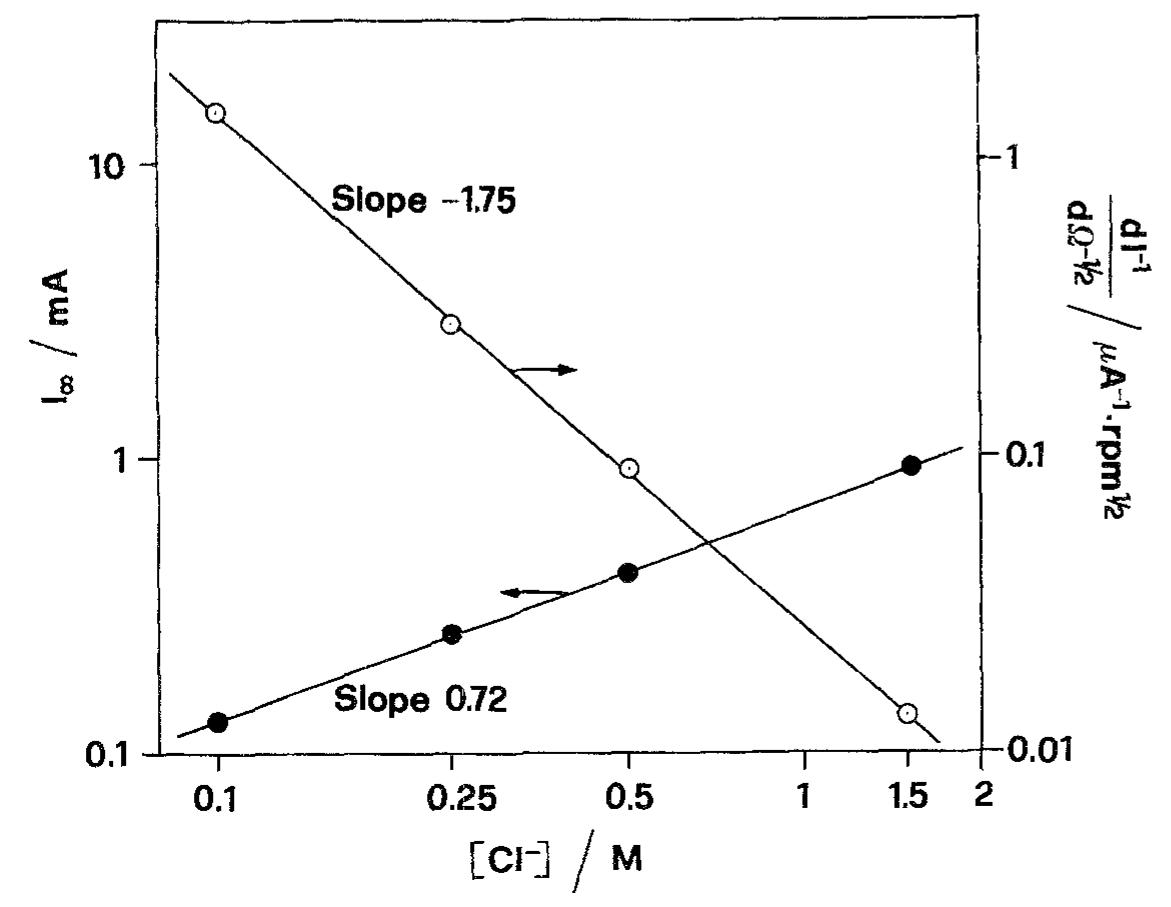
![Fig. 10. Corrosion current densities of Cu in aerated 0.5M NaCl as a function of rotation rate and immersion time. Recently Tribollet and Newman [24] also considered the global reaction but used the general kinetic equation](https://figures.academia-assets.com/45526330/figure_010.jpg)
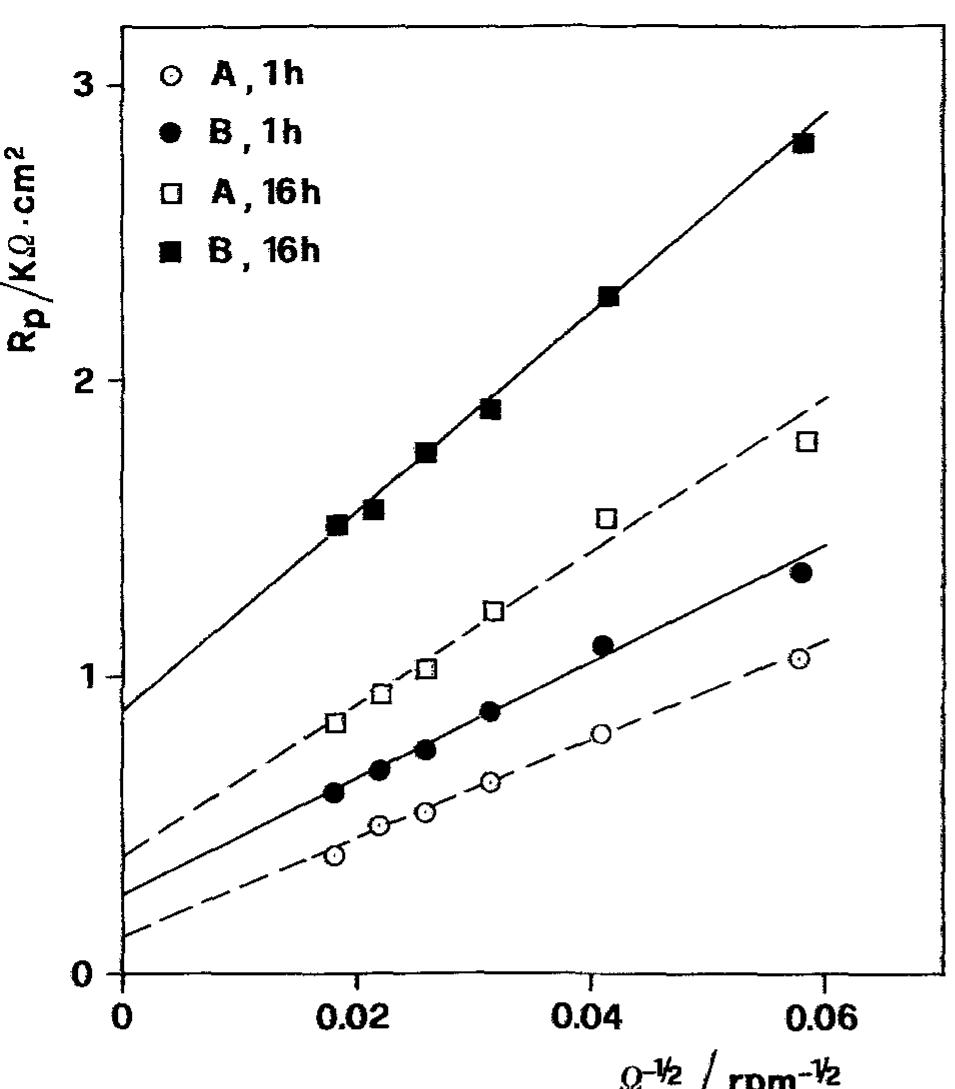
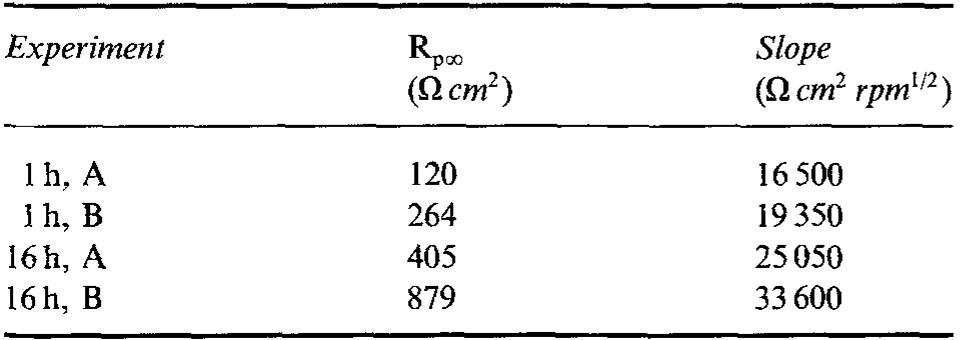
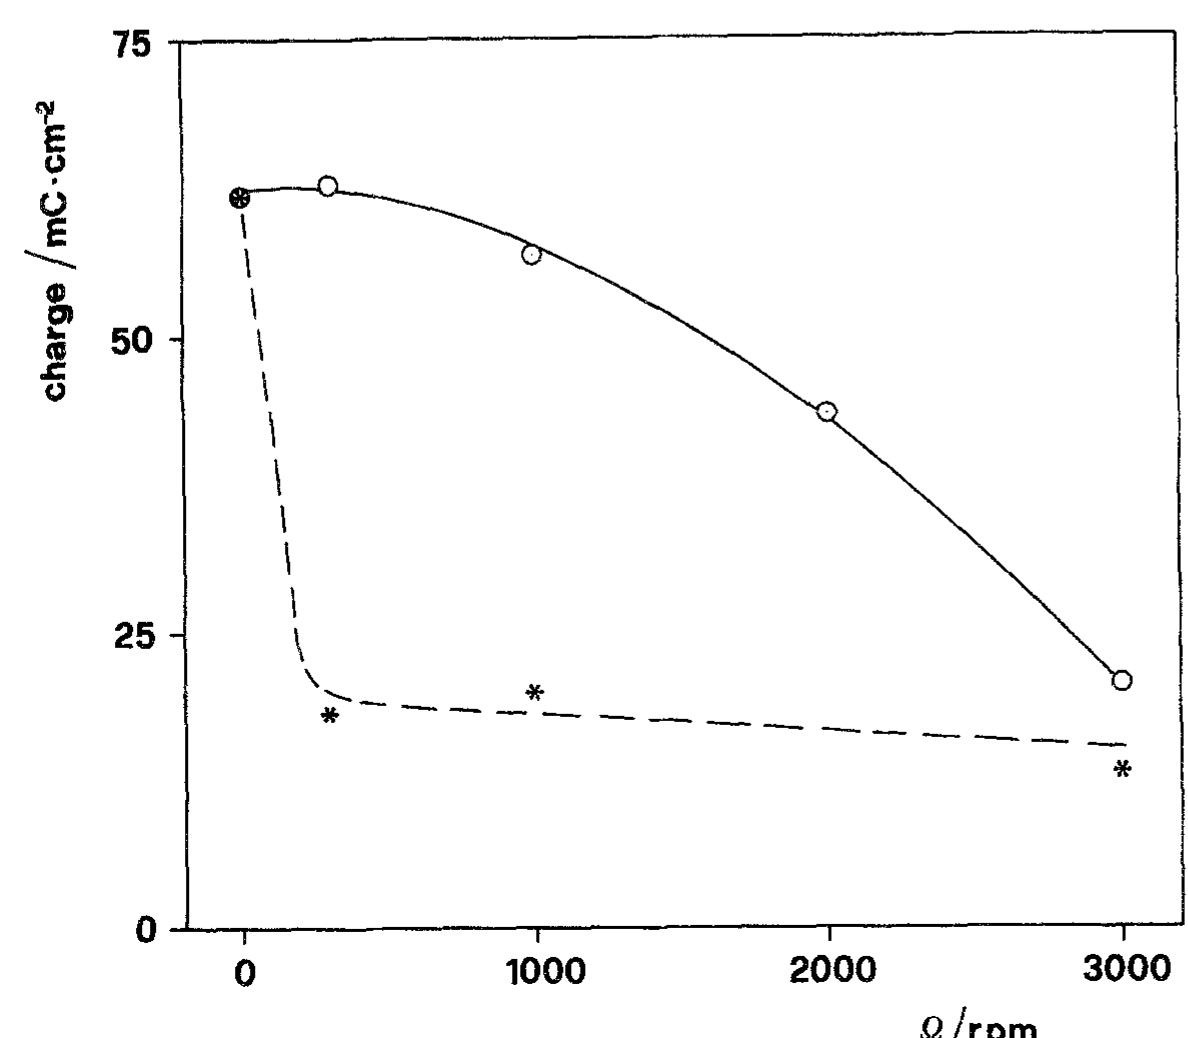
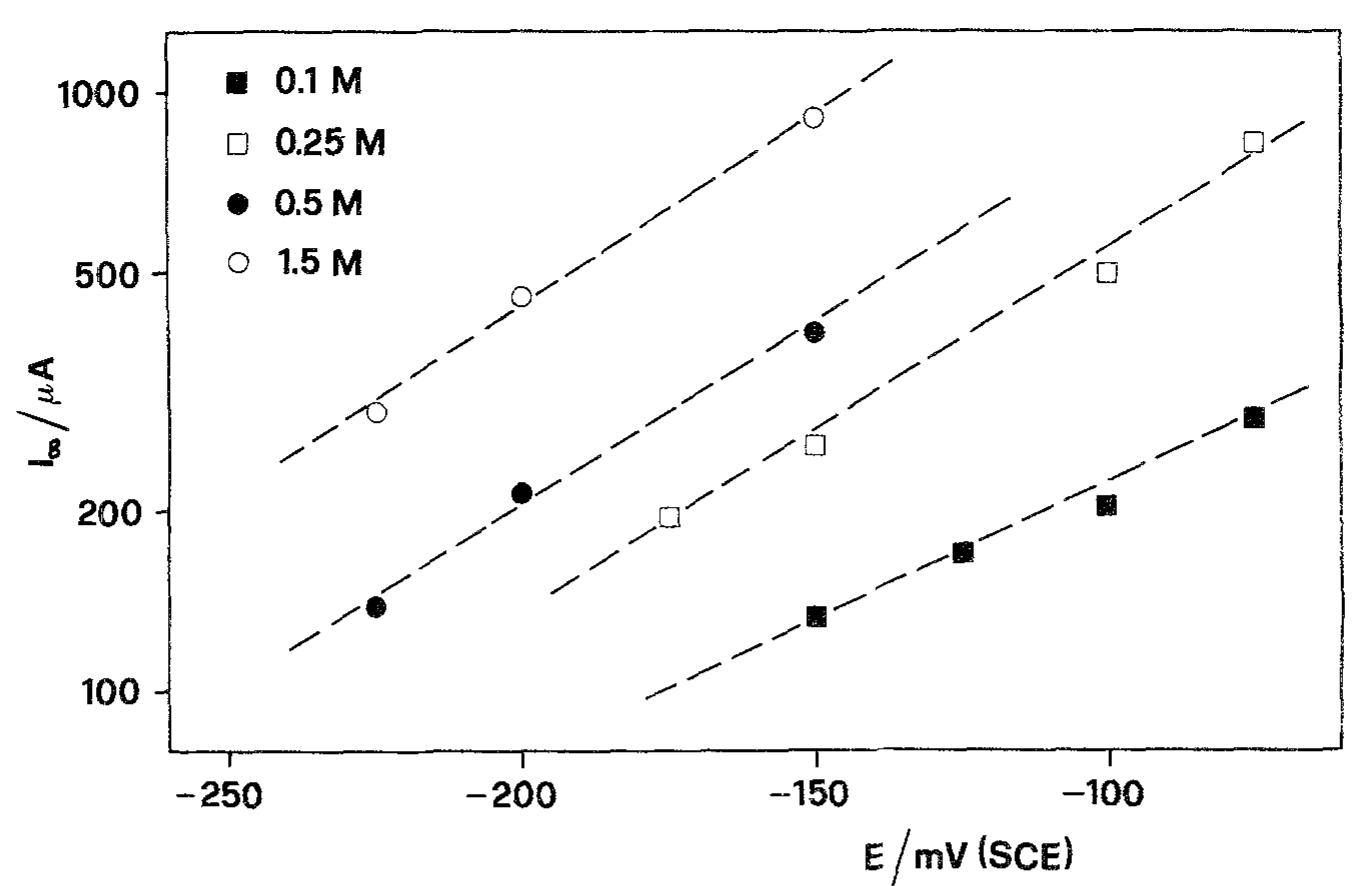
![Fig. 6. Dependence of the slope (d/~'/dQ~'”) on potential. Polarization resistance values (R,) obtained for various Q and two exposure times are reported in Fig. 9. For each exposure time (1h or 16h) two sets of data are reported. The empty points refer to experi- The common technique of determining the corrosion current from R, [22] was found by Grubitsch et al. [23] to yield, for the Cu/seawater system, results in agree- ment with weight loss measurements, provided no pitting occurs. Grubitsch [23] and later Heitz [9] calculated [,,,, a8 [.,,, = B/R,, with B = 0.019 V. The numerical value of the constant B was obtained by assuming a pure activation mechanism for both the anodic and the cathodic reactions. This corresponds](https://figures.academia-assets.com/45526330/figure_006.jpg)
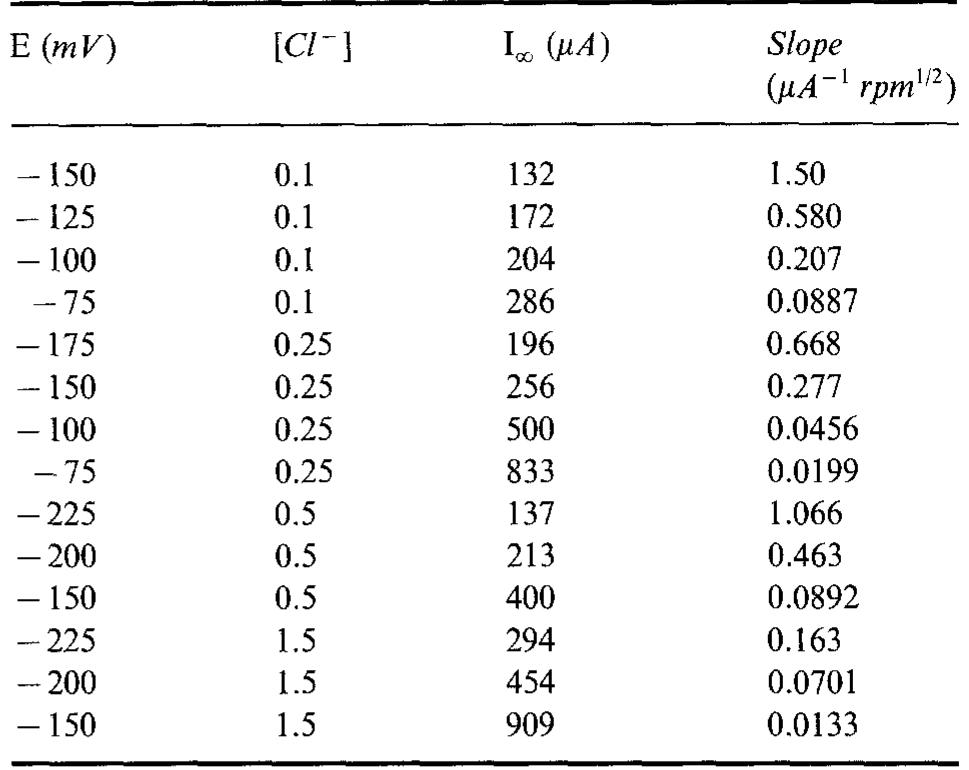
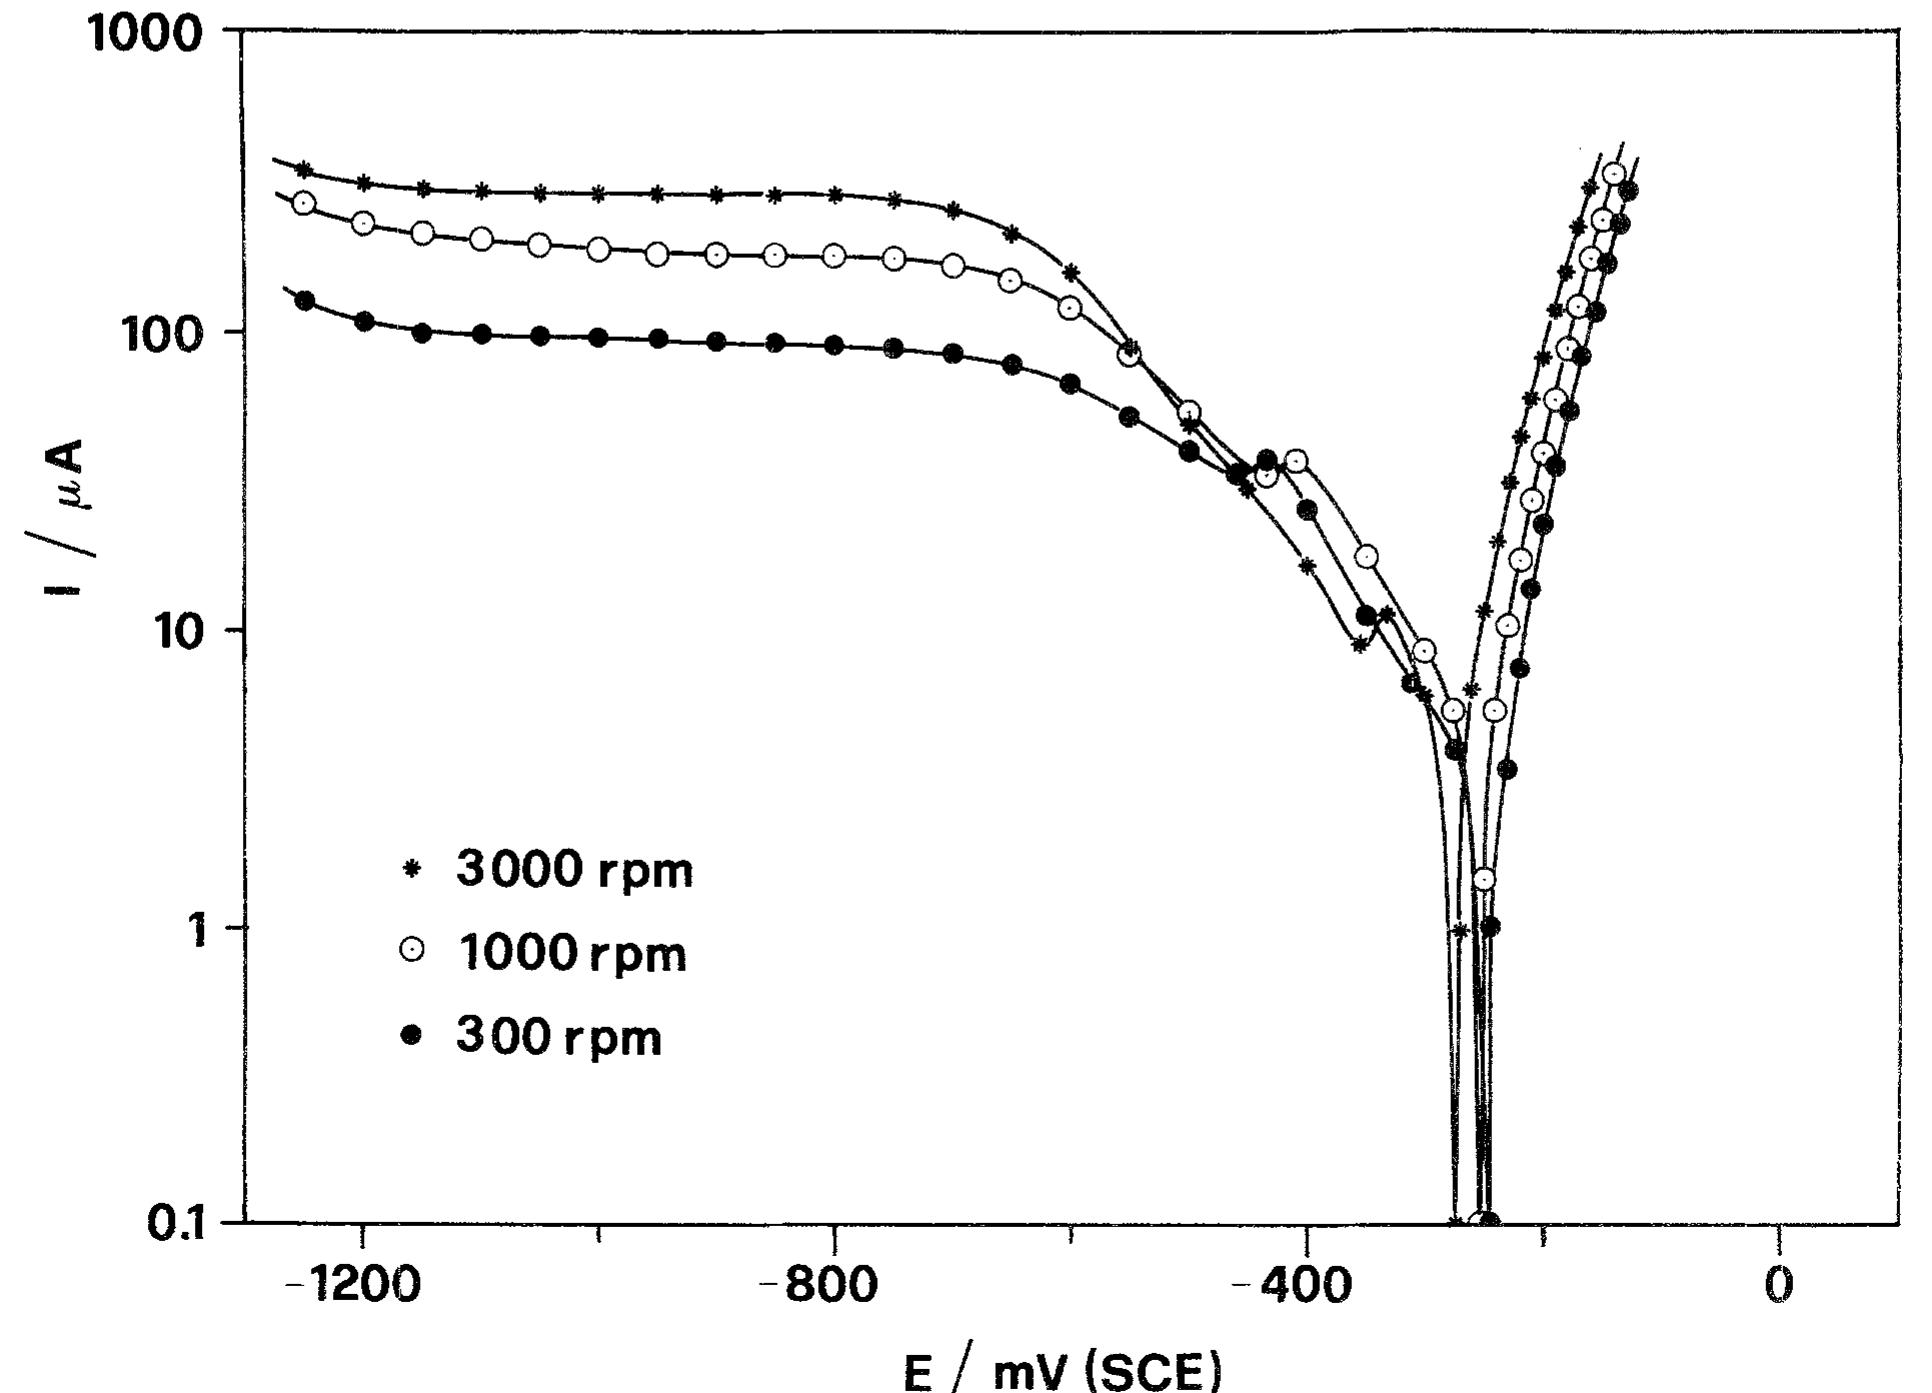
![Fig. 5. Anodic J~' vs Q-'? plots obtained on Cu for various combinations of potential and [CI ].](https://figures.academia-assets.com/45526330/figure_005.jpg)
![™ AISO S€e [L£U, 22, ZO, /2]. BTEX = benzene, toluene, ethylbenzene and xylene. TCE=tri- chloroethylene, DDT = dichlorodiphenyltrichloroethane [or more correctly, 2,2-bis-(p-chlorophenyl)-1,1,1-trichloroethane], PCB = polychlorinated biphenyls. Table 1. Organic pollutants successfully treated by TiO -basec photocatalysis*](https://figures.academia-assets.com/48321897/table_001.jpg)
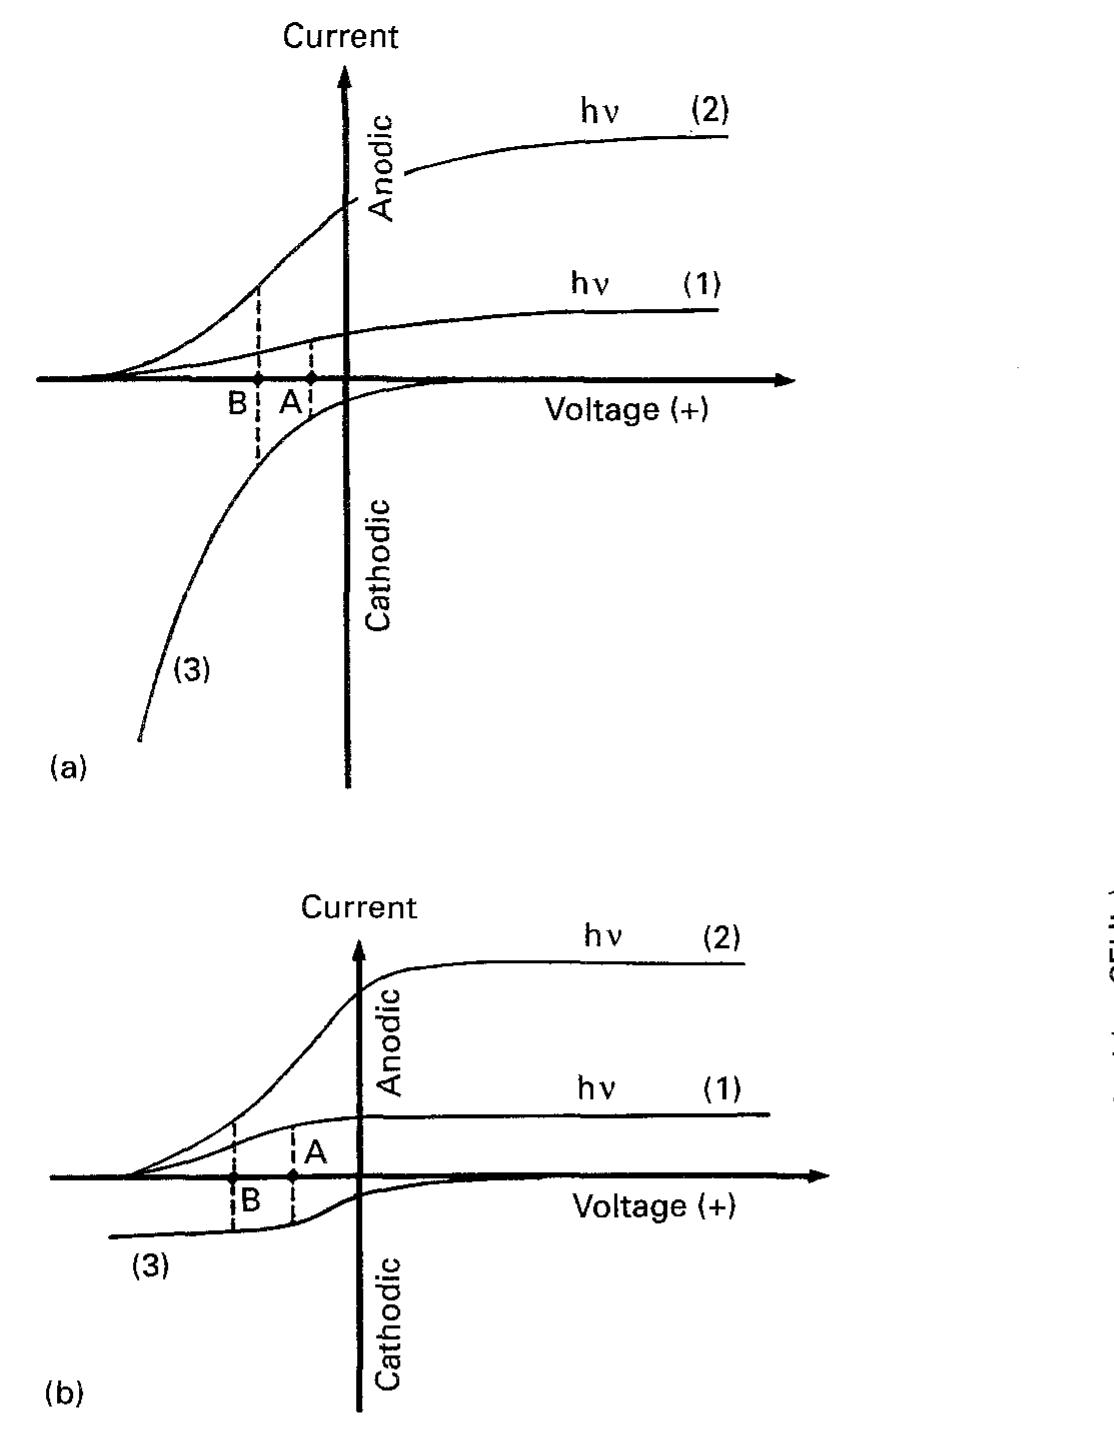
![Fig. 4. A Wagner diagram (c.f. [109]) of the conjugate processes at an irradiated TiO, particle. The hole process is shown as curve 1; two different cases are shown for the conjugate electron process involving one with sluggish (curve 2) and facile (curve 3) kinetics. The (dashed) ‘tie-lines’ correspond to particle potentials (A and B) at which the anodic and cathodic branches are balanced.](https://figures.academia-assets.com/48321897/figure_006.jpg)
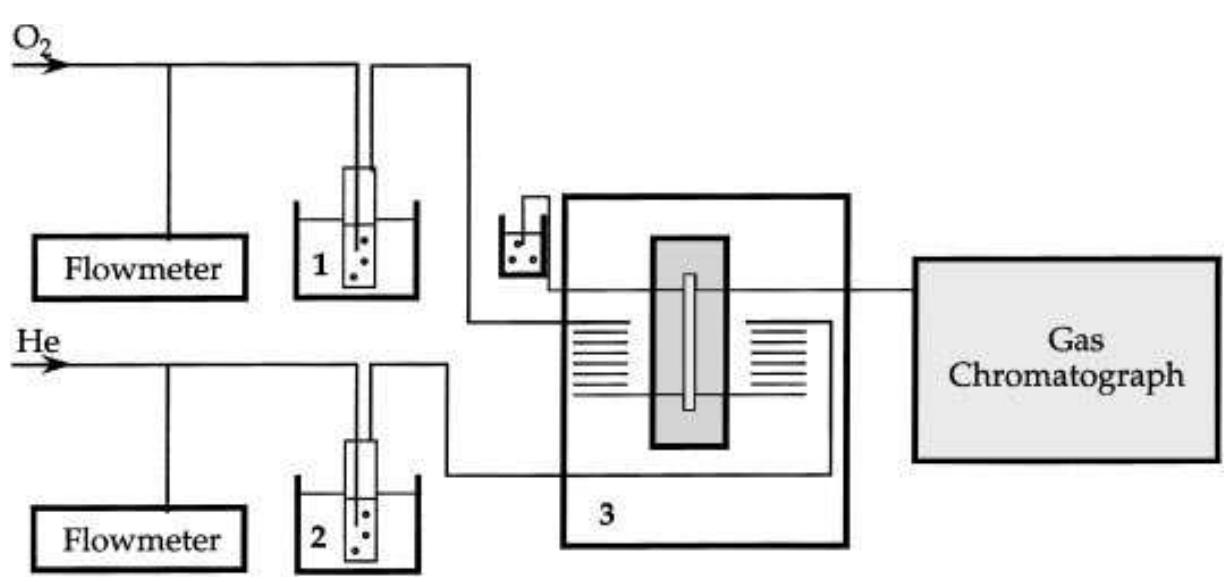
![Fig. 6. Influence of oxygen on the efficiency of TiO, to reduce Cr(v1) (a) or to kill E. coli (b). The data in (a) and (b) are from [80] and [78], respectively. The bactericidal activity of TiO, in (b) is expressed as_ the percentage survival of colony forming units (CFUs).](https://figures.academia-assets.com/48321897/figure_008.jpg)
![Fig. 7. Annular and spiral reactors for PC treatment of pollutants. (Reprinted with permission from [18] and [79]).](https://figures.academia-assets.com/48321897/figure_009.jpg)
![Fig. 8. Estimated treatment costs for a field test site for a variety of technologies. (Reprinted with permission from [188]). Within the PC treatment framework itself, cost comparisons of electric-u.v. lamp and solar units have yielded interesting insights [188]. The gas phase and aqueous phase PC treatment approaches were](https://figures.academia-assets.com/48321897/figure_010.jpg)
![Table 5. Competing technologies for the treatment of organic-, metal- and microorganism-laden air and water approach wherein complete mineralization of toxic organic compounds is possible, air stripping generates secondary pollutants and, in many cases, unacceptable air emission. Similarly, the carbon adsorption technology simply transfers the pollutant from one phase to the other, and the spent carbon will have to be disposed of. In the case of metal treat- ment, the solid waste from current technologies may be a sludge or a contaminated (resin) adsorbant. On the other hand, metal recycling may be readily built into a PC reactor as we have demonstrated for the Cr(v1) —— Cr(im) system [80].](https://figures.academia-assets.com/48321897/table_005.jpg)
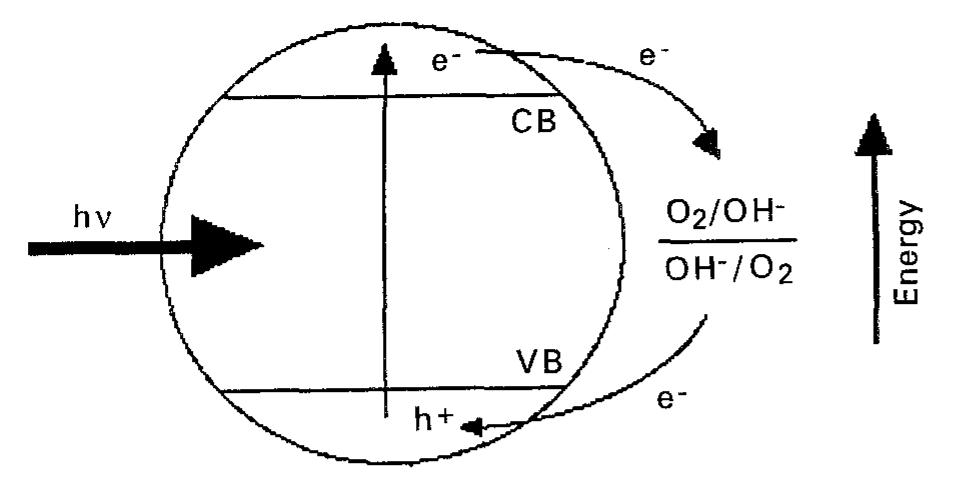
![surface. In this instance, Reactions 4 and 8 form a conjugate pair: The concept of quantum yield is of great value in photochemistry [104]. The quantum yield is generally defined as the number of events occurring per photon absorbed. The difficulty with defining such a parameter for heterogeneous systems is related to uncertainties arising from light scattering by the photocatalyst par- ticles. (Catalyst particle size is comparable in many cases to the incident photon wavelength.) Accord- ingly, an apparent quantum yield is often quoted wherein the inherent assumption is that all the incident light is absorbed by the semiconductor particle. How- ever, a special sample cell has been designed to mini- mize losses due to scattering [105]. This cell was tested using a model system comprising the PC bleach- ing of methylene blue using irradiated TiO, [105].](https://figures.academia-assets.com/48321897/figure_003.jpg)
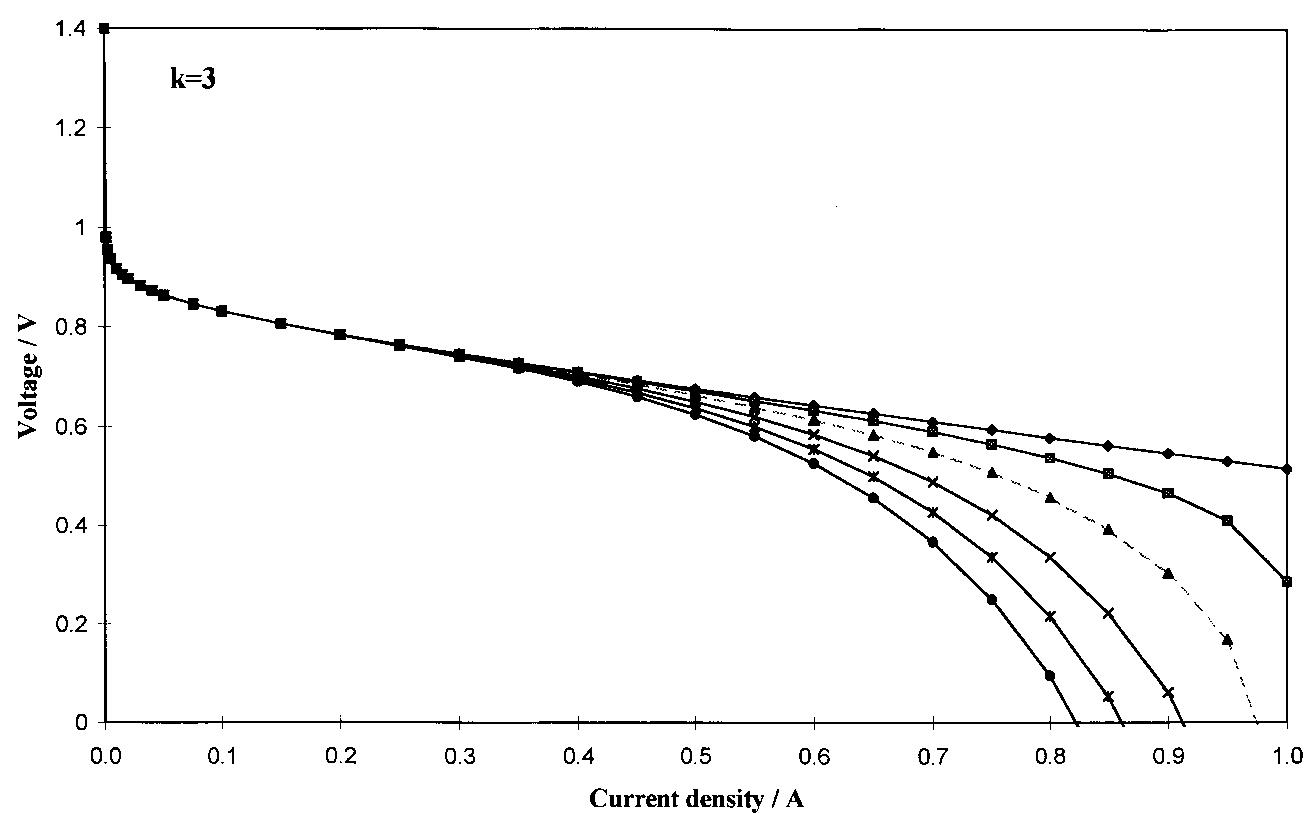
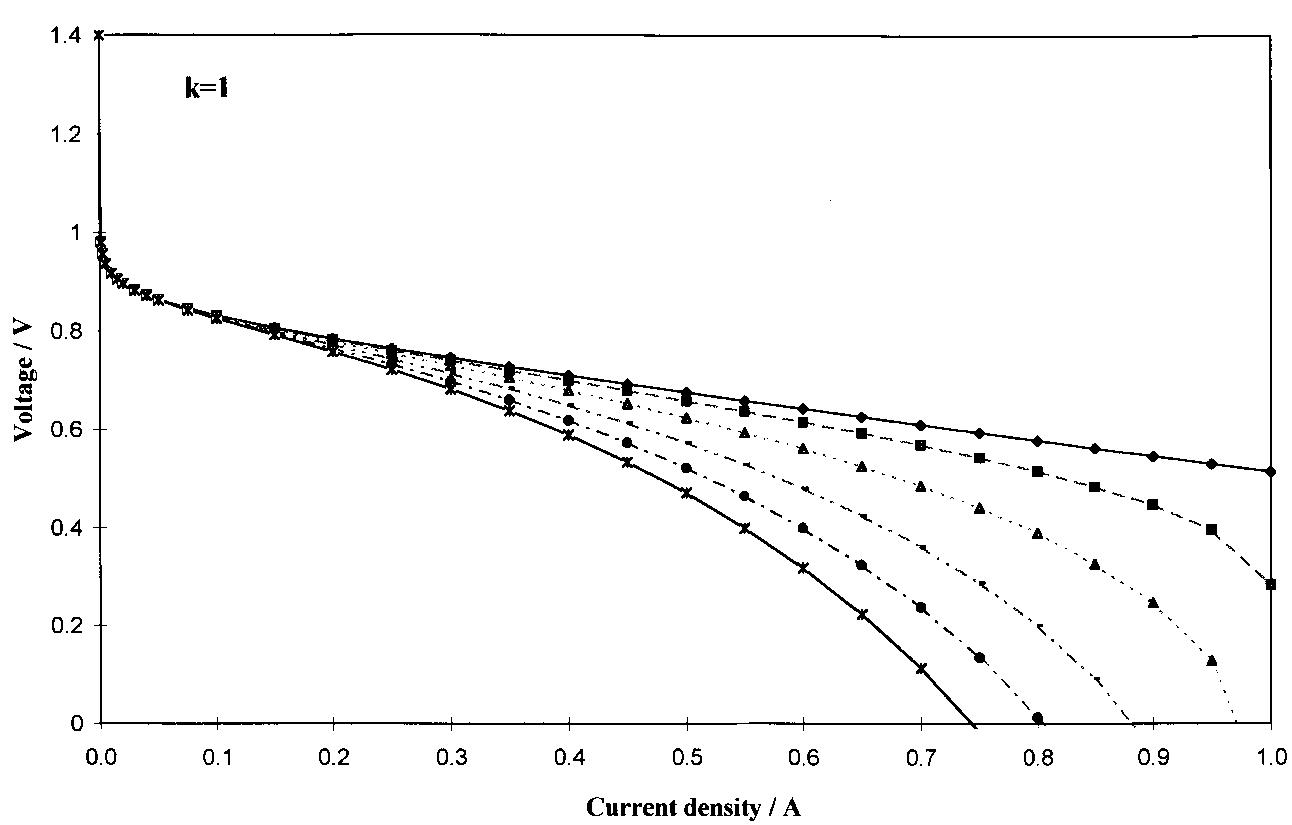
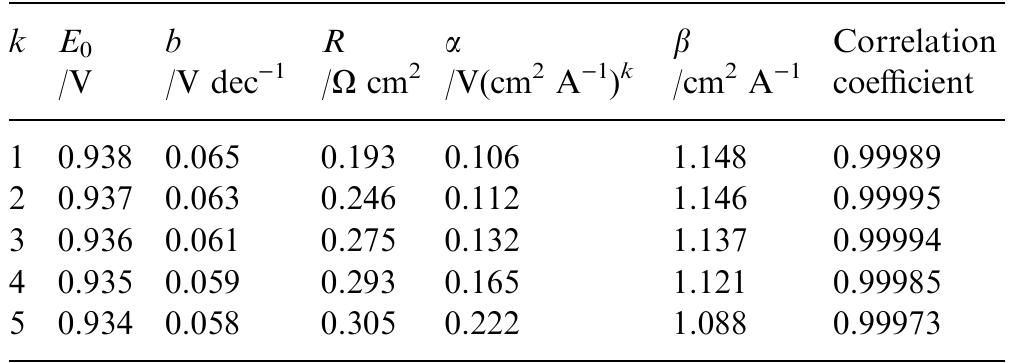
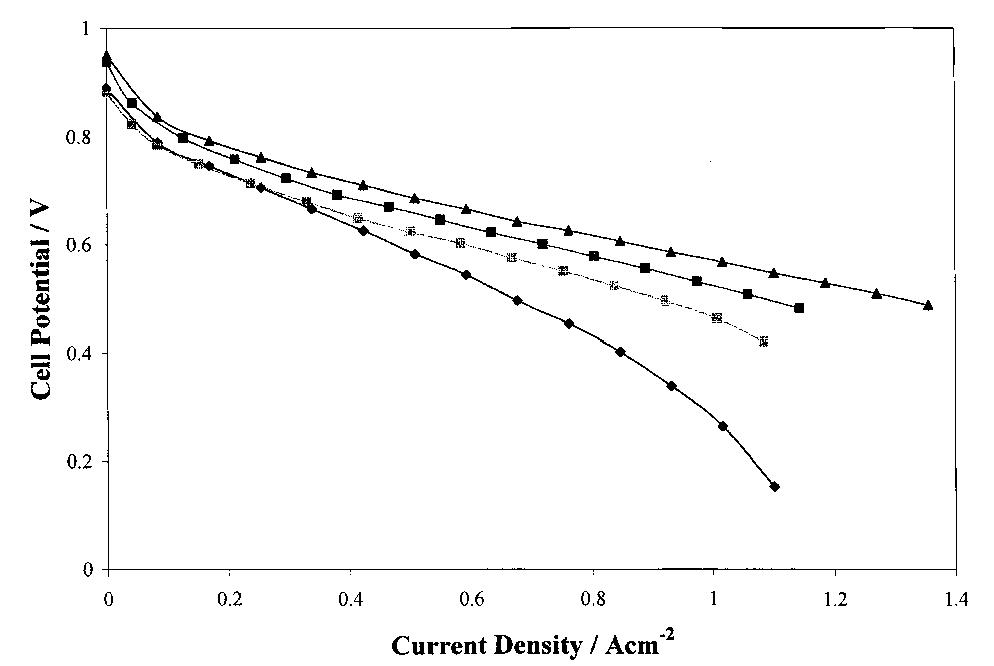
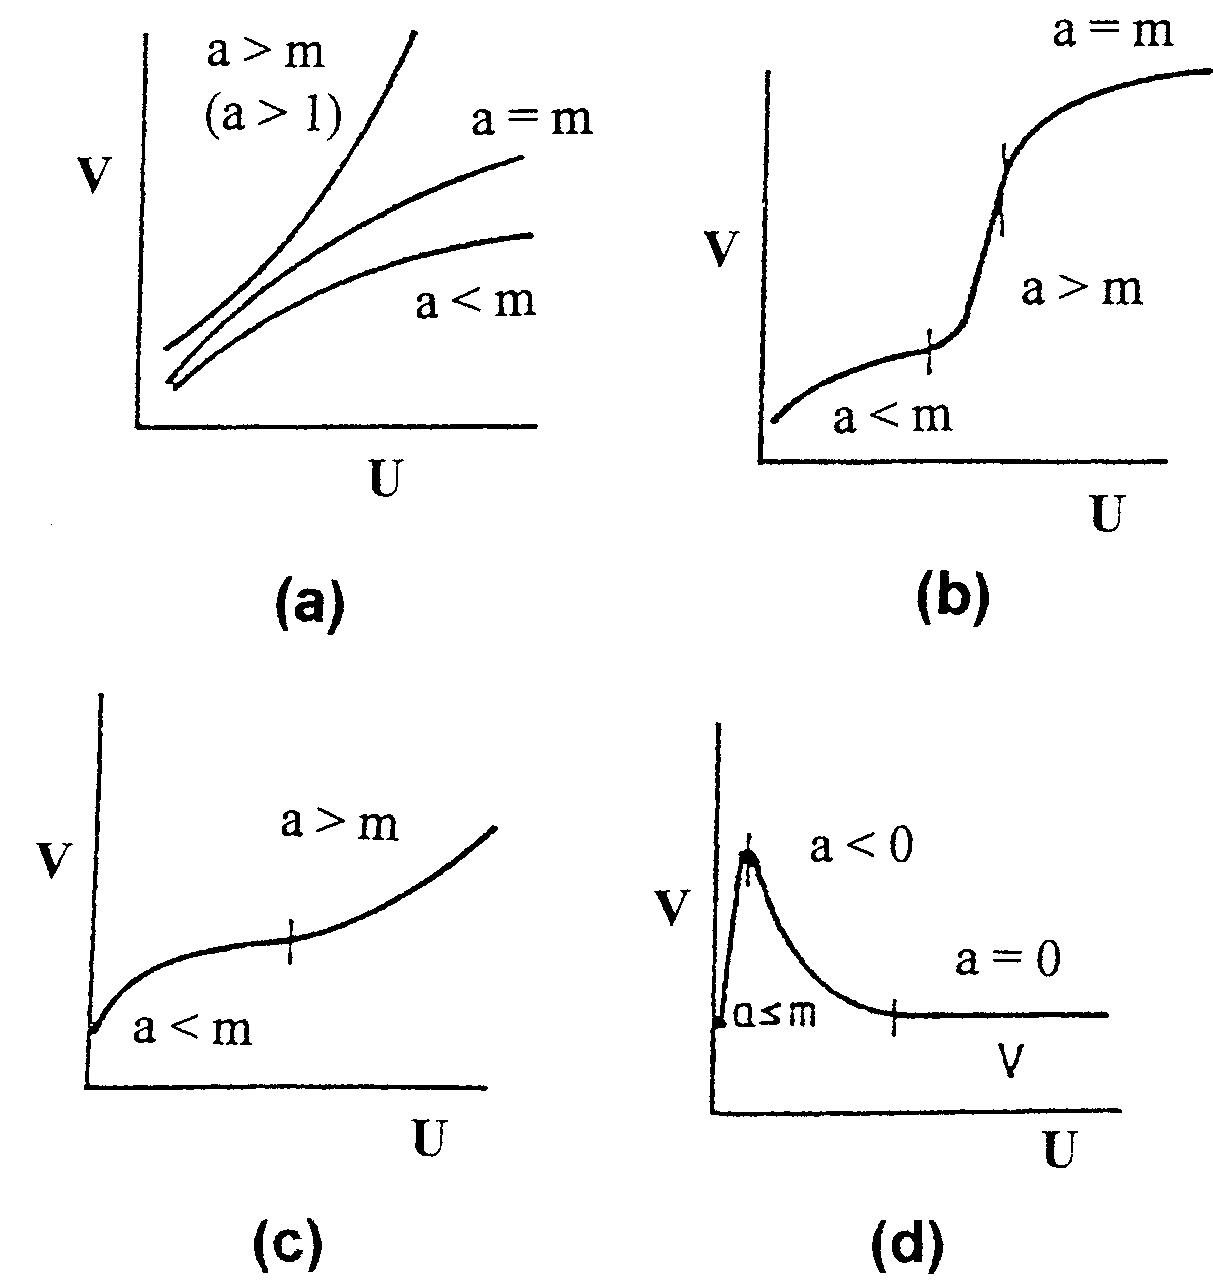
![Fig. 1. Dimensionless plot of the analytical behaviour of Equation 4. Key: (—-—) «= 0.5, k E against i when k = 1| and k = 3, respectively, « ranging from 0 to 0.6. Eo, b, R and f were fixed at values of 0.980 V, 0.060 V dec"!, 0.285Qcm?, 0.99 cm? Aq}, respectively, according to the literature and to our experimental data [4, 17-20, 23, 24]. By comparison of Figures 1 and 2, it can be seen that & and « affect the behaviour of the potential in the intermediate and high current density region; & mainly influences the point a which there is the departure from the linear behaviour o Equation 1, and « determines the shape of the curve a high current density (see above). Moreover, for each fixed k value, as « becomes smaller and smaller, the las term of Equation 5 approximates to zero and therefore Equation 5 changes to Equation 1. reduces the slope and significantly extends the pseudo linear region (semidotted line). The addition of this term to Equation 1| gives the following equation, very similar to that reported by Kim et al. [17]:](https://figures.academia-assets.com/47552160/figure_001.jpg)
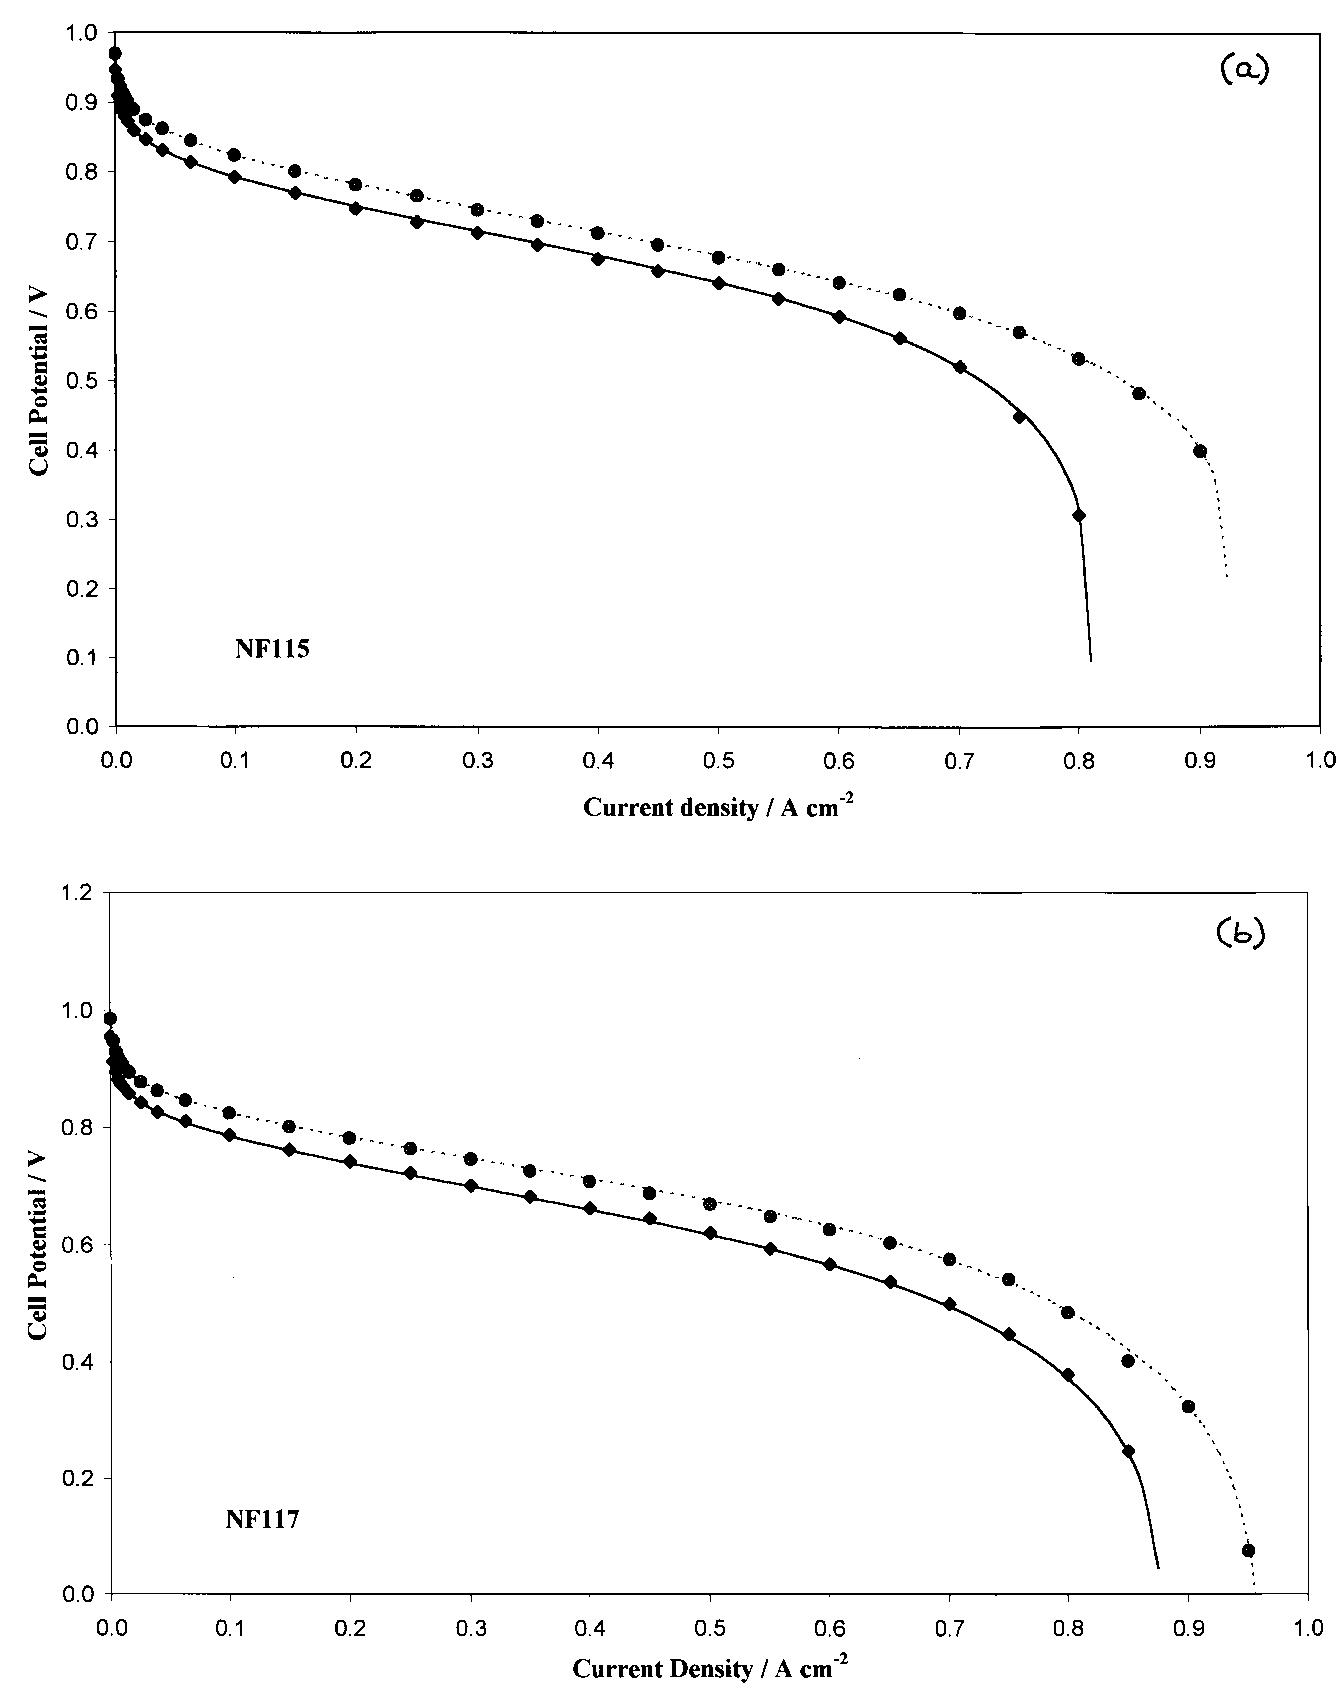
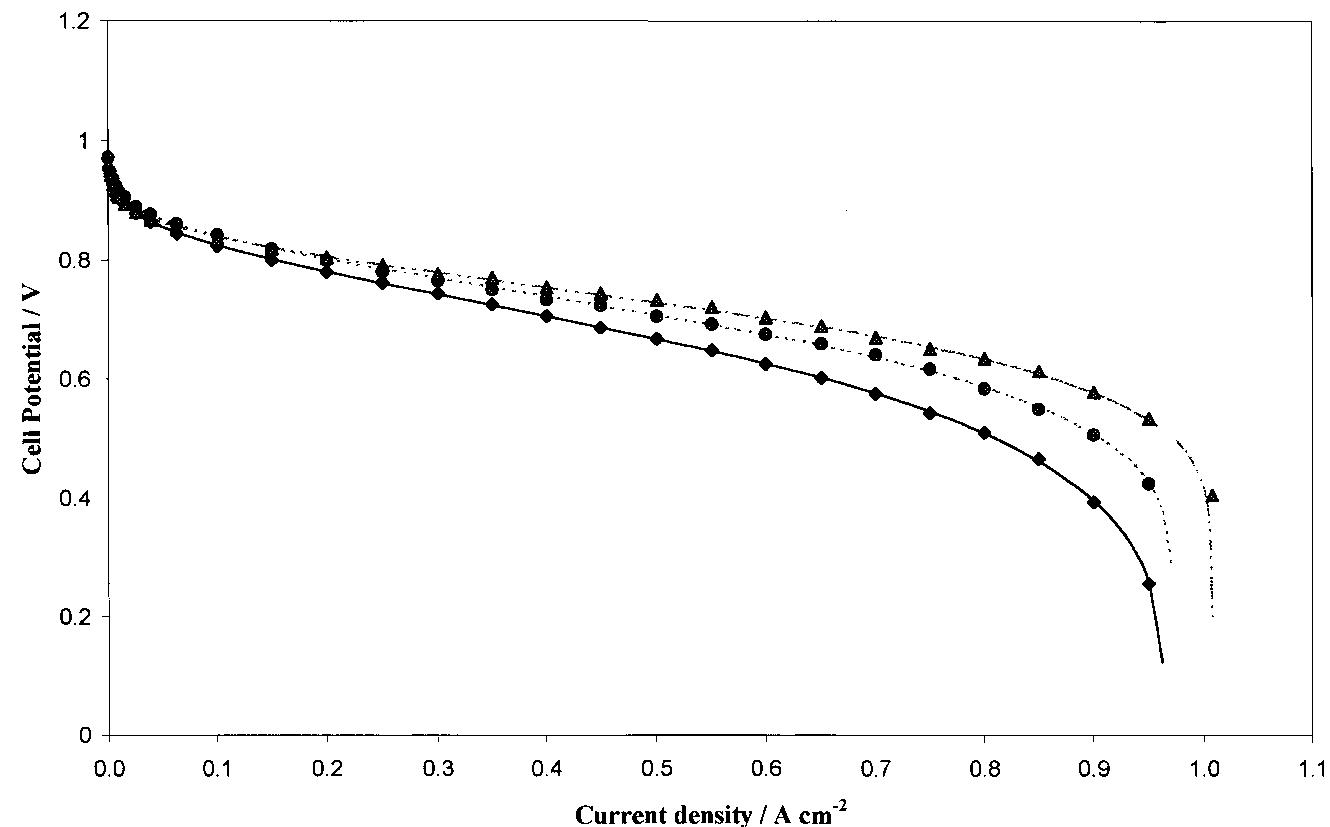
![Table 3. Calculated values of electrode kinetic parameters at 70 and 80 °C as function of hydrogen/air pressures and membrane thickness Reported errors are the maximum statistical errors coming from the performed fits The cell resistance (R) is clearly influenced by the membrane thickness; a decrease in R is observed passing from NF117 to NF115 and NF112, under the same cell conditions (70°C, 2.5/3.0 bar; 80°C, 3/5 bar). However, the expected resistance values, calculated for Nafion® conductivities of 0.17 and 0.12Q7'cm7! at 80 and 70°C, respectively [1], and thickness of 210, 160 and 60 um for NF117, NF115, NF112, respectively, are about 0.12 to 0.14Qcm? lower than the values calcu- lated using Equation 5. This difference may be attrib- uted to the resistance of other cell components such as backings, flow plates and current collectors.](https://figures.academia-assets.com/47552160/table_003.jpg)
![Fig. 4 Graphical representation of the two-step mechanism of urea decomposition in alkaline medium over Ni electro-catalyst surface (Adapted with permission from [65]. Copyright (2014) American Chemical Society)](https://figures.academia-assets.com/97517689/figure_005.jpg)
![Fig. 2 Reaction pathways of urea degradation by electrochemically generated reactive chlorine species (RCS) proposed Cho et al. (Adapted with permission from [58]. Copyright (2014) American Chemical Society) the optimum conditions for treating urea in a chloride- containing medium; meanwhile, Carlesi Jara et al. [60] studied the effect of a combined direct and indirect electro- oxidation of urea and determined the optimum chloride concentrations to minimize nitrate generation at different current densities.](https://figures.academia-assets.com/97517689/figure_003.jpg)
![Fig. 5 Scheme of direct urine fuel cell (DUFC) proposed by Botte in 2008 (Reproduced from Ref. [45] with permission from the Royal Society of Chemistry) The combination of urease and electrochemical oxidation can be termed bio-electro-oxidation. Watanabe et al. [113] investigated the mechanism of the electrochemical oxida- tion of urea with urease on a glassy carbon electrode. The slectrode surface was aminated during cyclic voltammetry runs. Urease decomposed urea to NH; and carbamic acid, which then either decomposed to ammonia and carbon dioxide or underwent further electrochemical transforma- tions to eventually form nitrogen. Laurinavicius et al.](https://figures.academia-assets.com/97517689/figure_006.jpg)
![Table 1 Comparison between different nonelectrochemical methods of urea removal from aqueous solutions At present, hydrolysis of urea is a well-known and successful method for urea removal. Nevertheless, this process proceeds at high temperatures and under high pressure, which limits its application to the industrial scale. Although, attempts of reducing the cost of the process, mainly by decreasing both the temperature and pressure, have been undertaken, the problems associated with this issue are still unsolved. In turn, the enzymatic decompo- sition of urea seems to be a very effective method. In comparison to the uncatalyzed urea hydrolysis, the rate of the process can be even 1014 times faster [22]. However, a major problem concerning this approach is the stability of the enzyme. This issue is attempted to be solved by immobilization of the urease onto suitable carriers. Removal of urea by biological methods is often compli- cated due to the use of different strains of bacteria able to decompose urea in a series of biofilters. Moreover, the biological treatment of urea-containing wastes is not a selective method, since the strains of microbes are usually capable of metabolizing more than one substance at the time (not necessarily a drawback). Therefore, it is usually applied in the wastewater treatment. The use of strong The most straight-forward method of electrochemical waste removal is to subject the waste to anodic treatment, whereby the molecule to be decomposed is destroyed during the oxidation reaction due to the subtraction of one or more electrons from its structure, followed by reactions](https://figures.academia-assets.com/97517689/table_001.jpg)
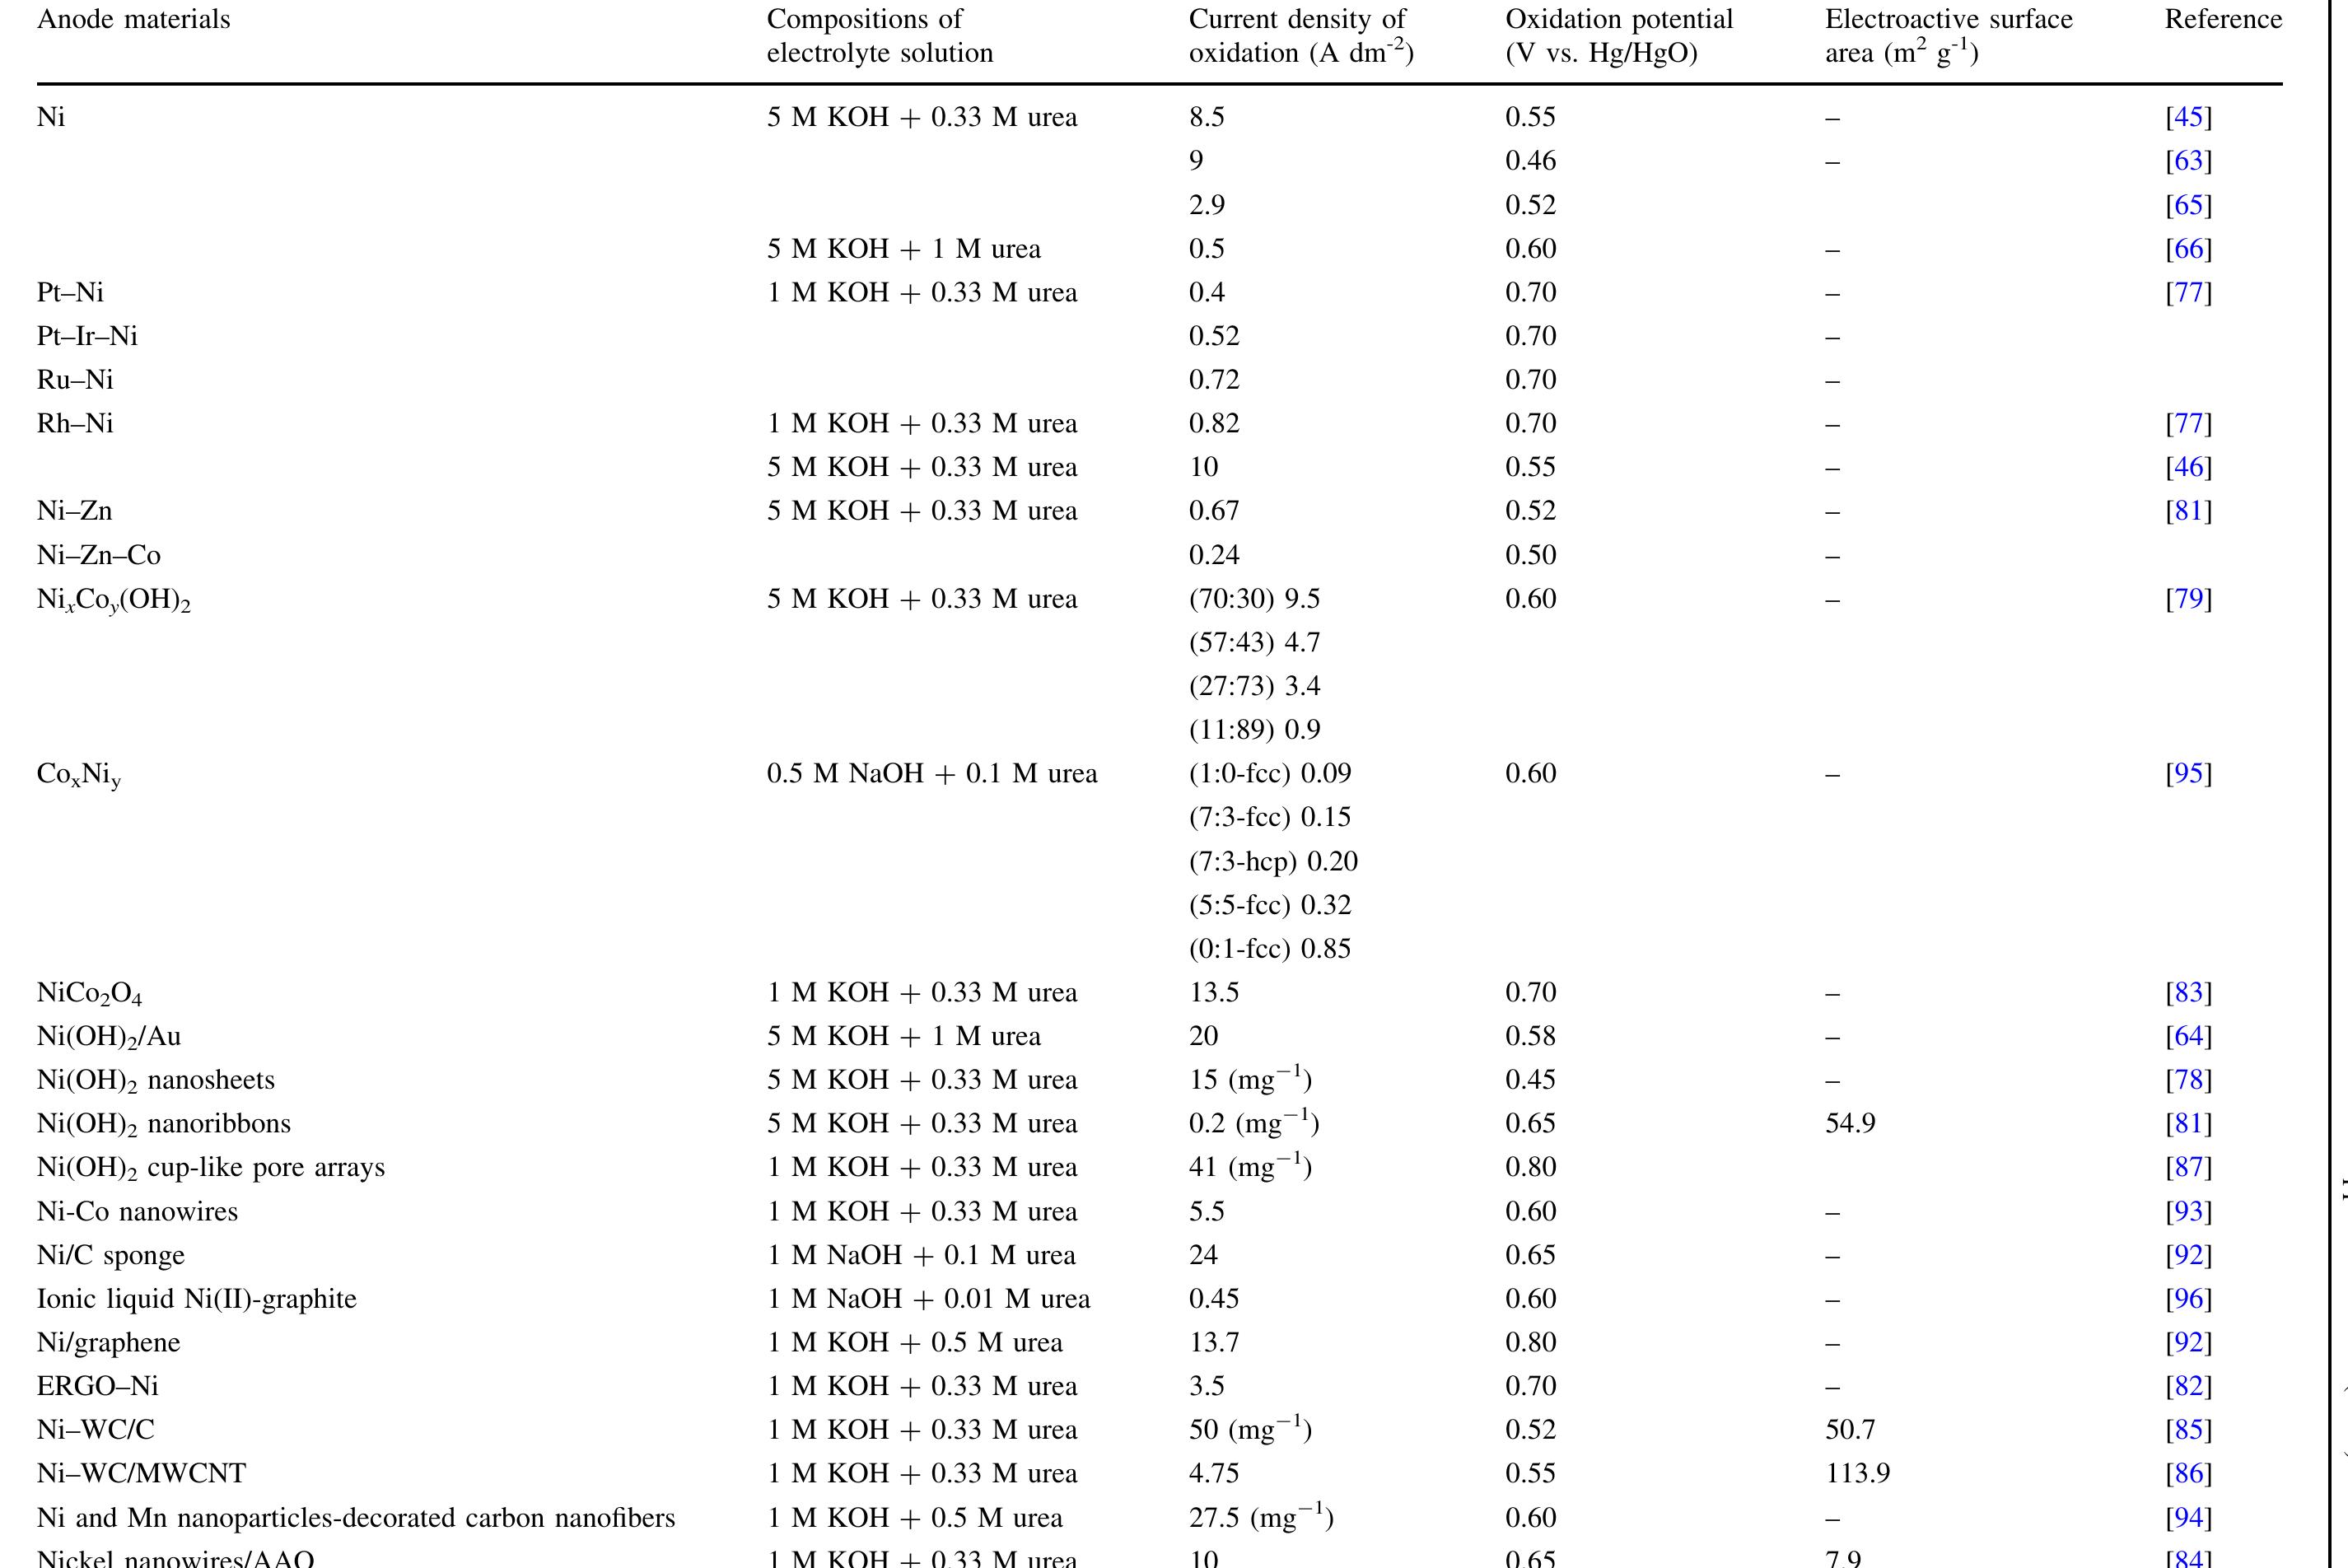
![Fig. 3 Cyclic voltammogram (CV) of Ni electrode in 5 M solution with and without the addition of 0.33 M urea (scan rate 10 mV s~'). Ni?*/Ni** redox pair is visible in the CV in the absence of urea. The addition of urea results in the increase of current density with the onset at 0.35 V versus Hg/HgO, which is associated with the electro- oxidation of urea (Adapted with permission from [63]. Copyright (2012) Elsevier) The mechanism for the electro-oxidation of urea on nickel catalysts in an alkaline environment was investi- gated by Vedharathinam et al. [63-66]. The oxidation process is usually studied with the use of cyclic voltam- mograms (CV), such as the one shown in Fig. 3. It can be seen that during a forward scan in a urea-free alkaline solution, nickel surface undergoes anodic reaction, at the onset potential of ca. 0.35 V versus Hg/HgO, which is ascribed to Ni?*/Ni** redox couple. Then, after reaching an oxidation peak at 0.39 V versus Hg/HgO, the oxygen evolution commences with the sharp increase in current density up to 0.65 V versus Hg/HgO. During the reverse scan, a reduction peak can be observed at 0.26 V versus Hg/HgO, corresponding to the reduction of Ni**. When 0.33 M of urea is added to the solution, the voltammogram exhibits additional features. The onset potential of oxida- tion is shifted to ca. 0.3 V versus Hg/HgO and the oxida- tion peak is both slightly shifted in terms of potential (0.46 V vs. Hg/HgO) and in current density (3.6 times higher than in a urea-free solution). The onset potential for oxygen evolution is also shifted to more positive potential due electrode surface blockage by the adsorbed urea. The anodic peak is also visible during reverse scan, which is explained by the regeneration of the Ni** active sites. I](https://figures.academia-assets.com/97517689/figure_004.jpg)
![Keywords Urea - Urine - Electro-catalytic oxidation of urea - Electrochemical methods - Waste treatment Vue to the extensive use of urea, 1f 1s produced in large quantities. Industrial synthesis of urea involves ammonia reacting with carbon dioxide at high pressure. The modern urea production technologies are the Stamicarbon process (involves CO, stripping), the Snamprogetti process (in- volves NHsz stripping), the ACES process, and the IDR process [4, 5]. However, the waste generated during urea production is problematic. The largest quantities of waste are produced in the concentration process in the evapora- tors. During this process, the vaporization of water entrains droplets of urea solution, which can then pass into the condensate [6]. Additionally, the amount of wastewater increases during auxiliary operations such as the washing of the prilling towers and pumps transporting the solution along with a urea crystal suspension. Some wastewater can also be generated during the centrifugation process of the urea crystals [6]. Urea enters into the environment not only with wastewater from production plants but also by leaching from fields and agro-breeding farms, in effluents from plants using it as a raw material, and as a final product of mammalian protein metabolism.](https://figures.academia-assets.com/97517689/figure_001.jpg)
![Fig. 1 Schematic structure of the active center of native urease (Adapted with permission from [12]. Copyright (2009) Elsevier)](https://figures.academia-assets.com/97517689/figure_002.jpg)
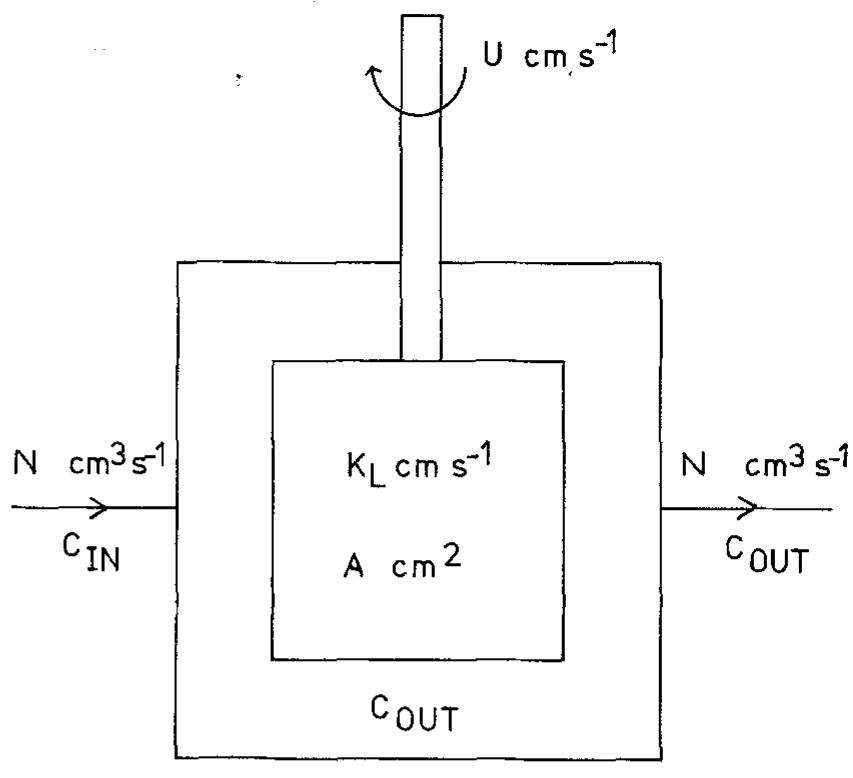
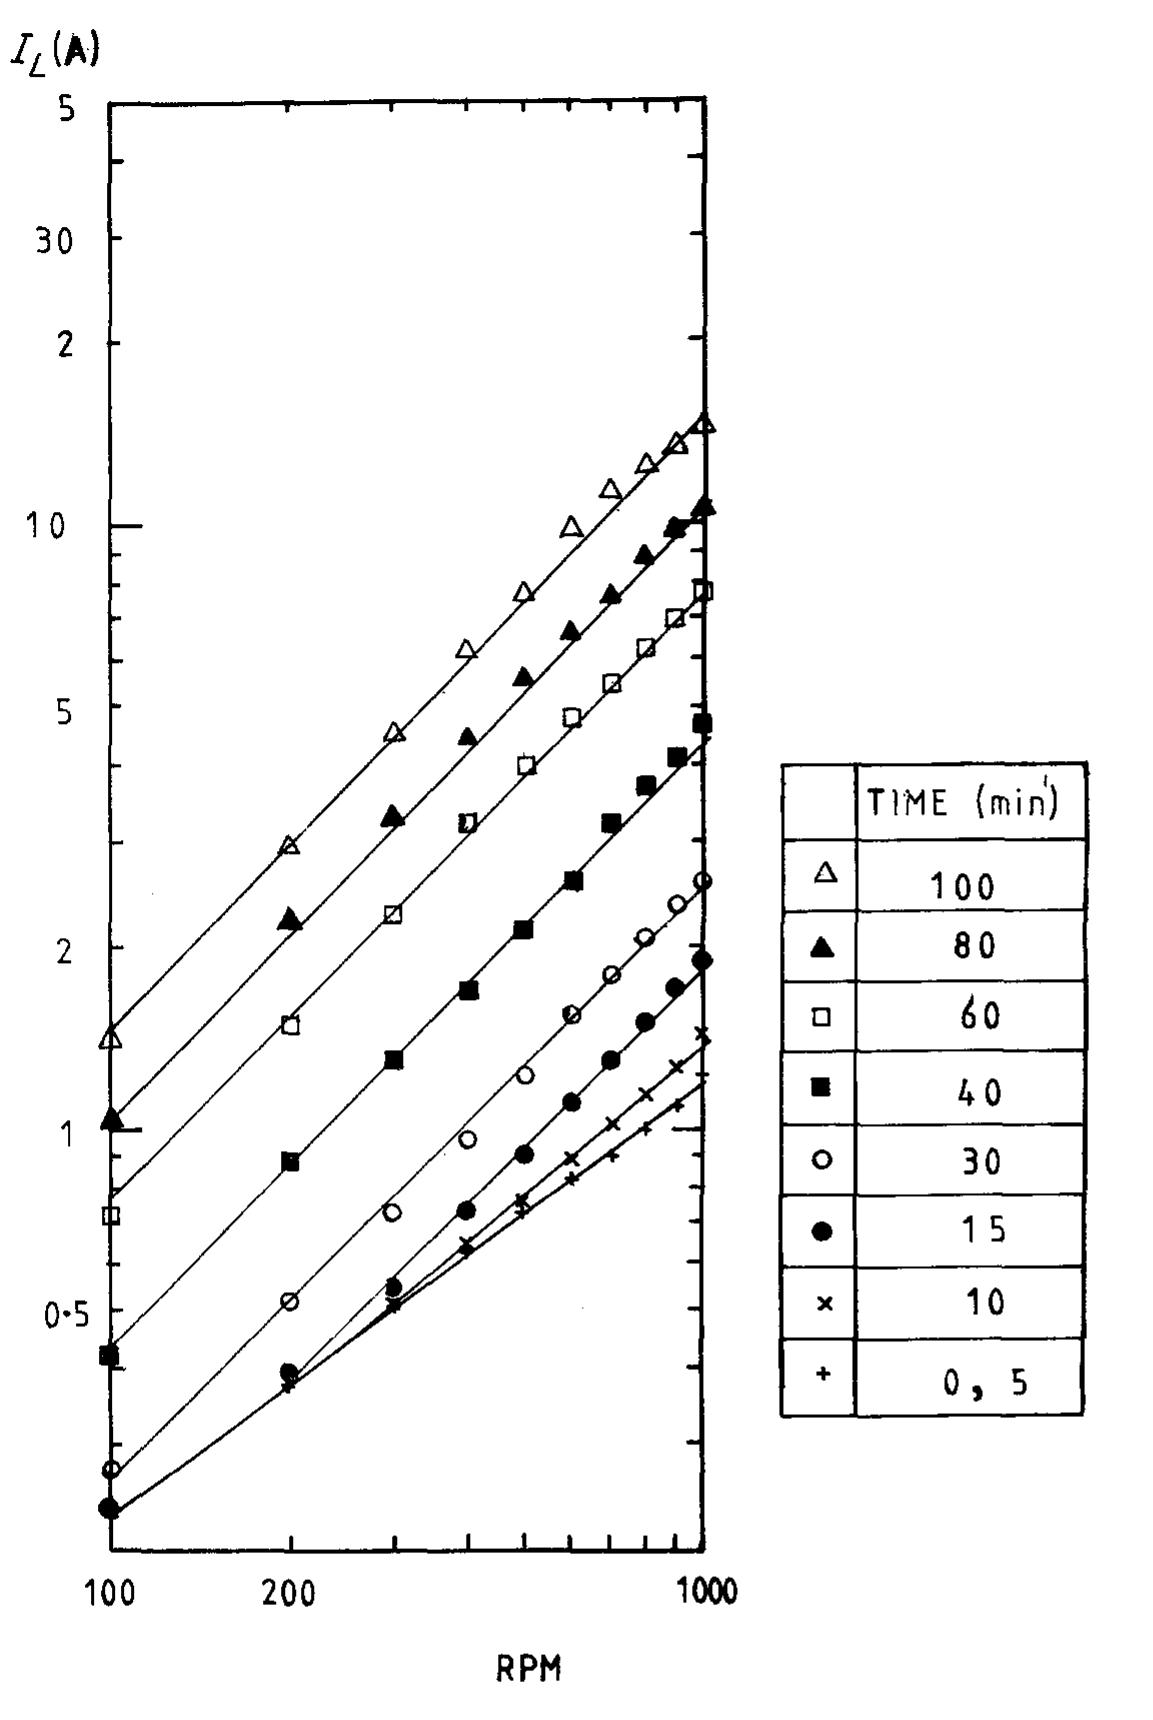
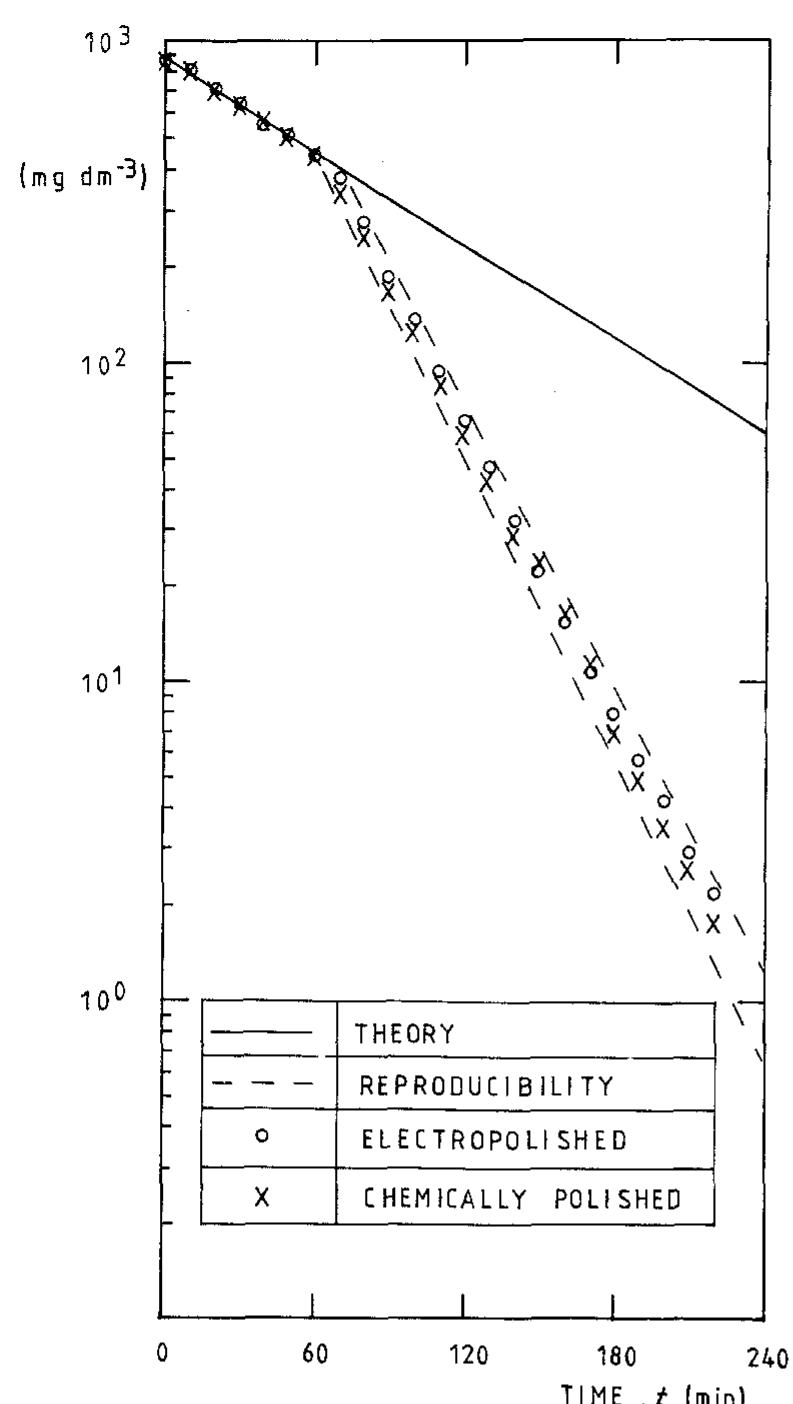
![Fig. 10. Six element Cascade Eco-Cell shown without dividing membrane and with external resistive distribution of current. many commercial reactors available on the marke for metal recovery, and several approaches have been employed. Kuhn and Houghton [107] have used the limiting current density in 0.1 mol dm~? solutions for a two-electron reaction to make a simple scientific comparison. The mass transfer coefficient Ky, = iz,/zFC is a more universal concept.](https://figures.academia-assets.com/40365761/figure_010.jpg)
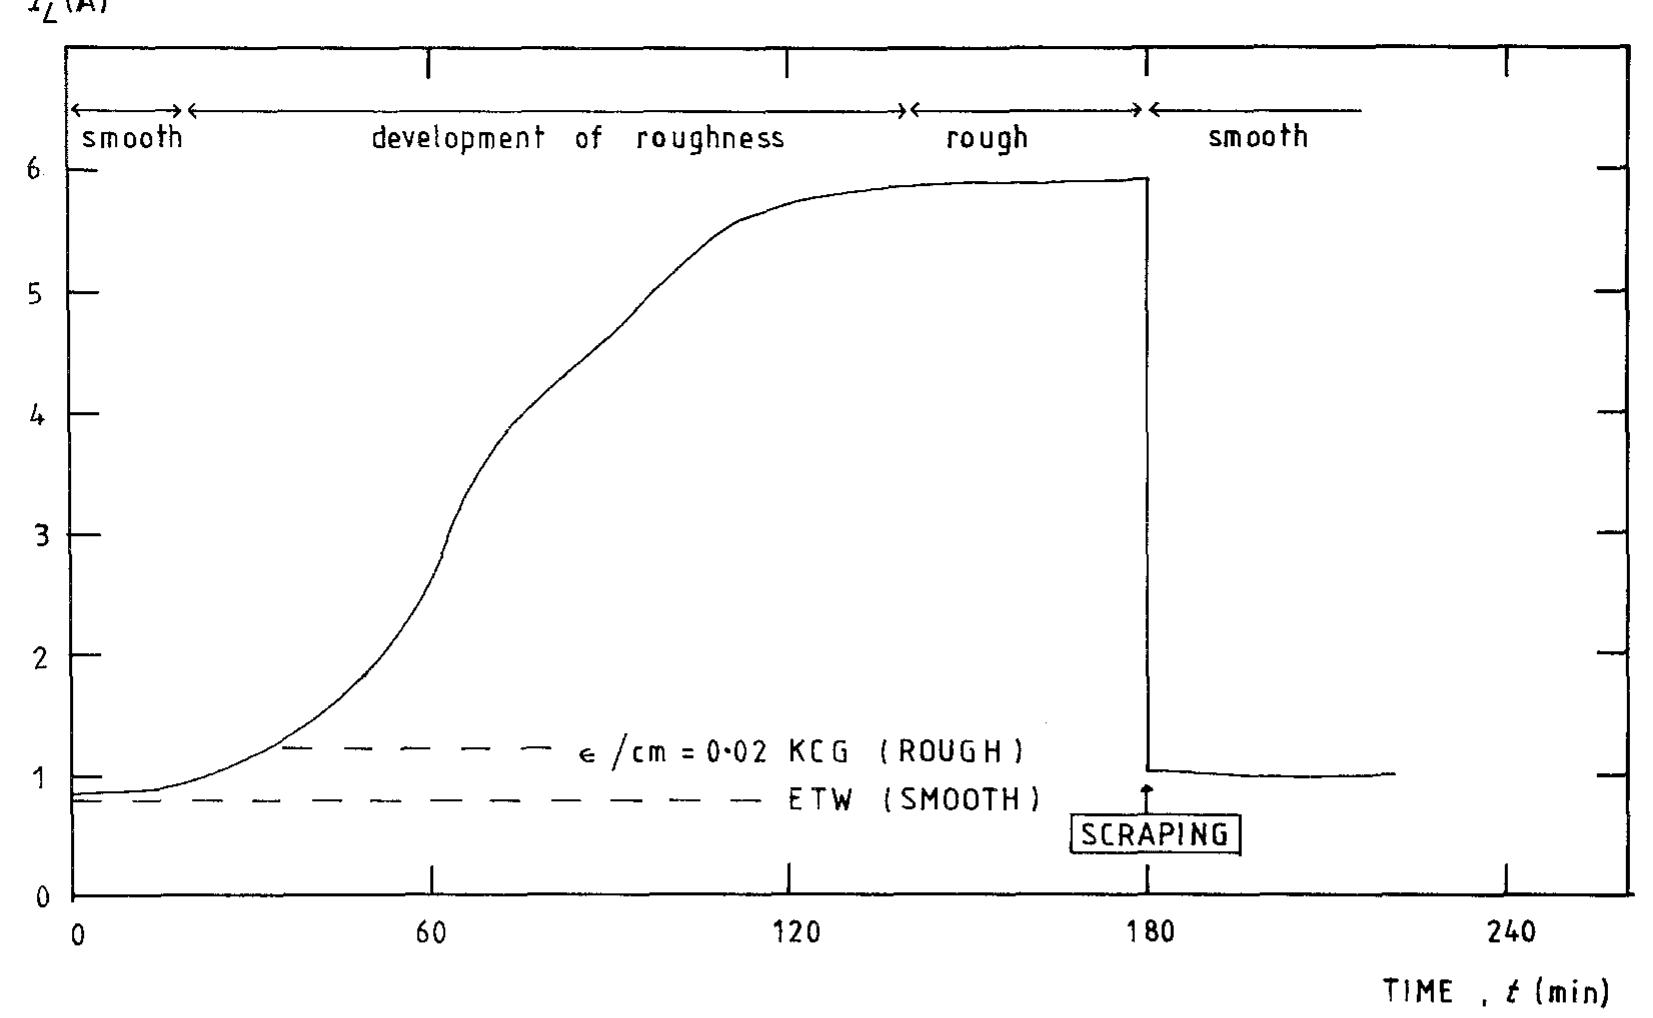
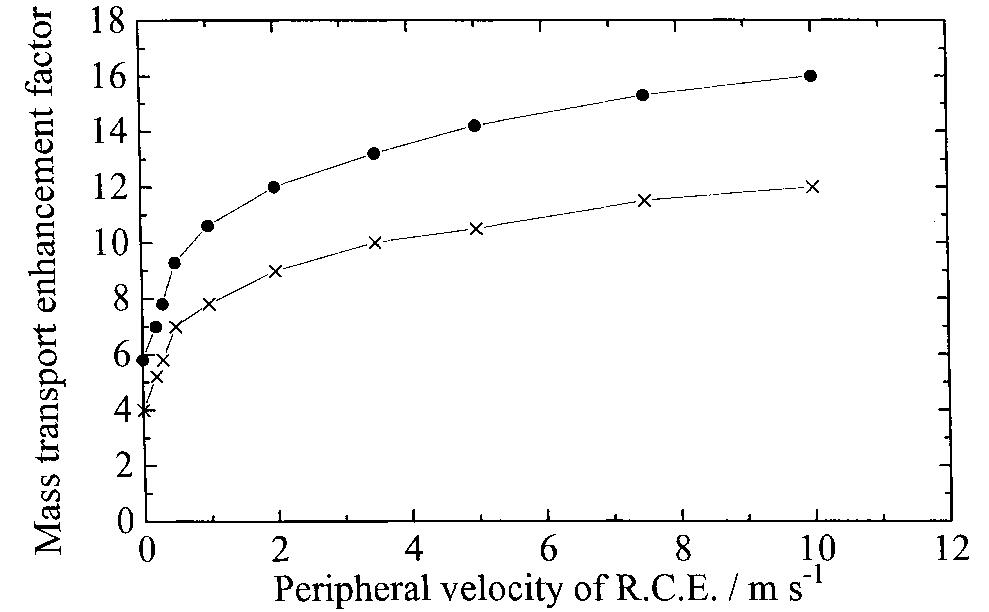
![creased mass transfer achieved. Using potentiostatic control, a cathodic metal deposition reaction having a clear limiting current density plateau, gives an increasing current as the metal powder grows, roughens and eventually reaches a saturated roughness” (Fig. 3). Without knowing the true active surface area it is difficult to calculate reliably a true mass transfer coefficient although it may be reasonable to assume that the active area increase is propor ional to current increase. An apparent mass transfer coefficient may of course be calculated (based on nominal electrode area) and indicates mar ked enhancement (Fig. 4). Using such data the enhanced mass transport leads to the power law proposed by Holland [60-62] for powder growth w hose onset may be illustrated by](https://figures.academia-assets.com/40365761/figure_003.jpg)
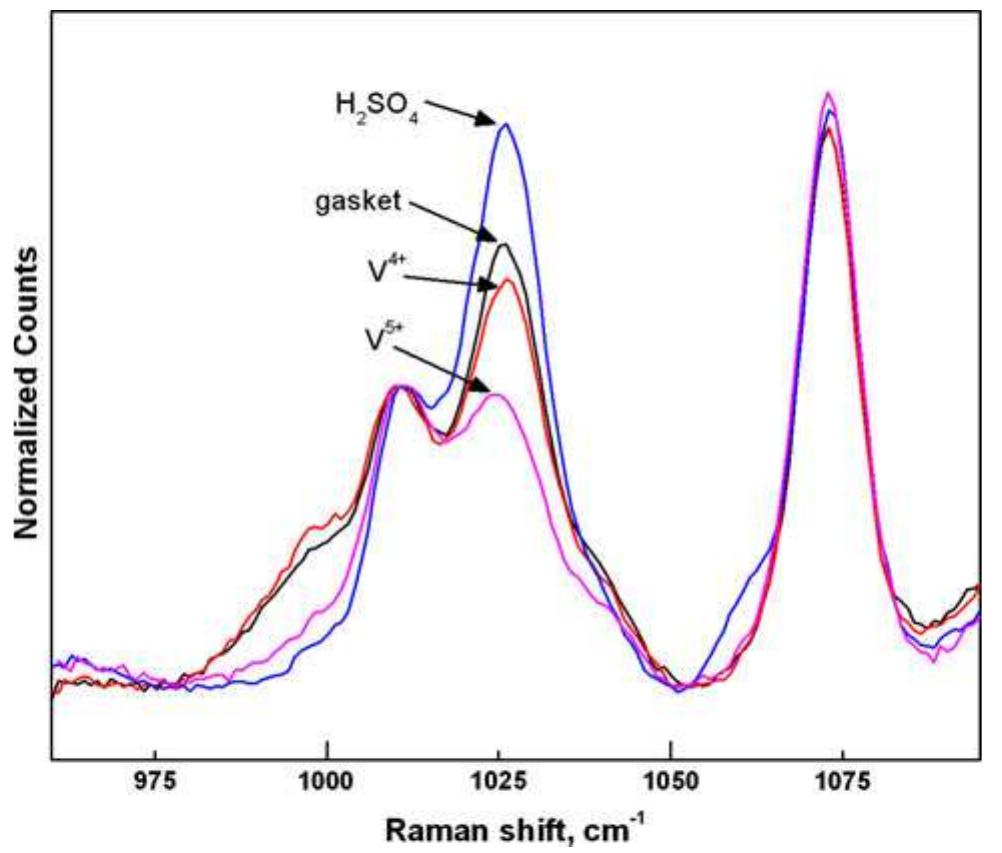
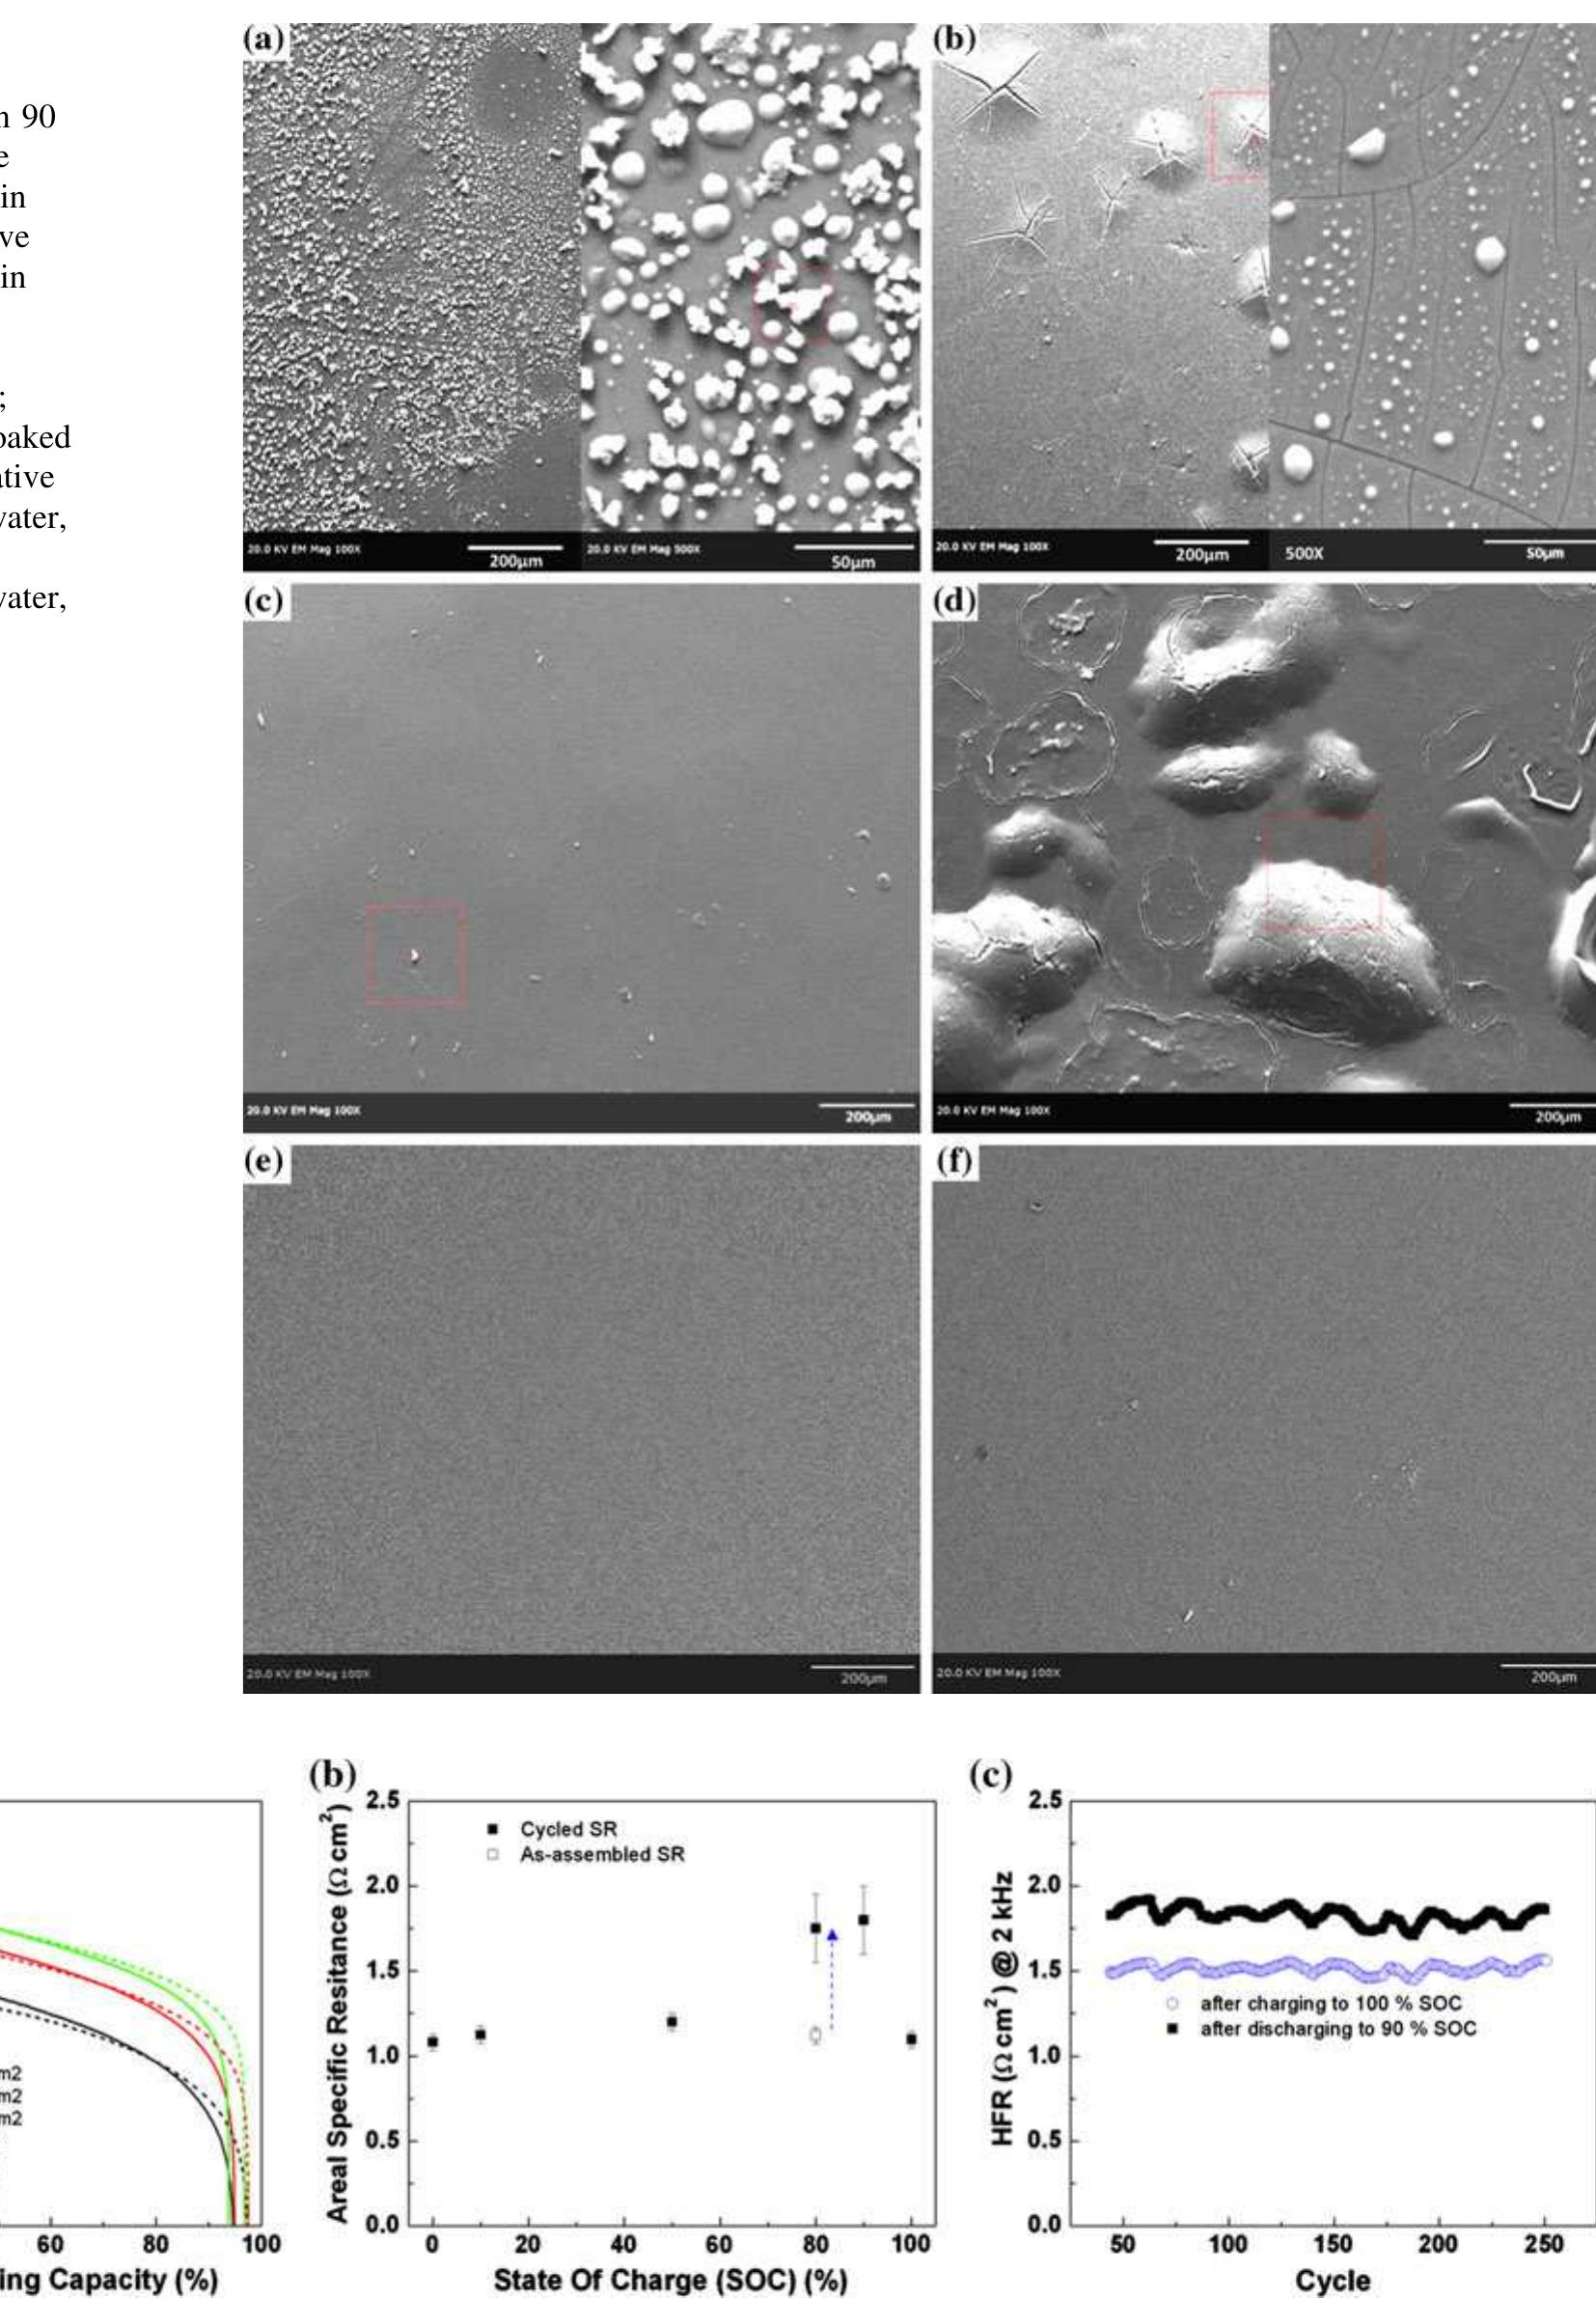
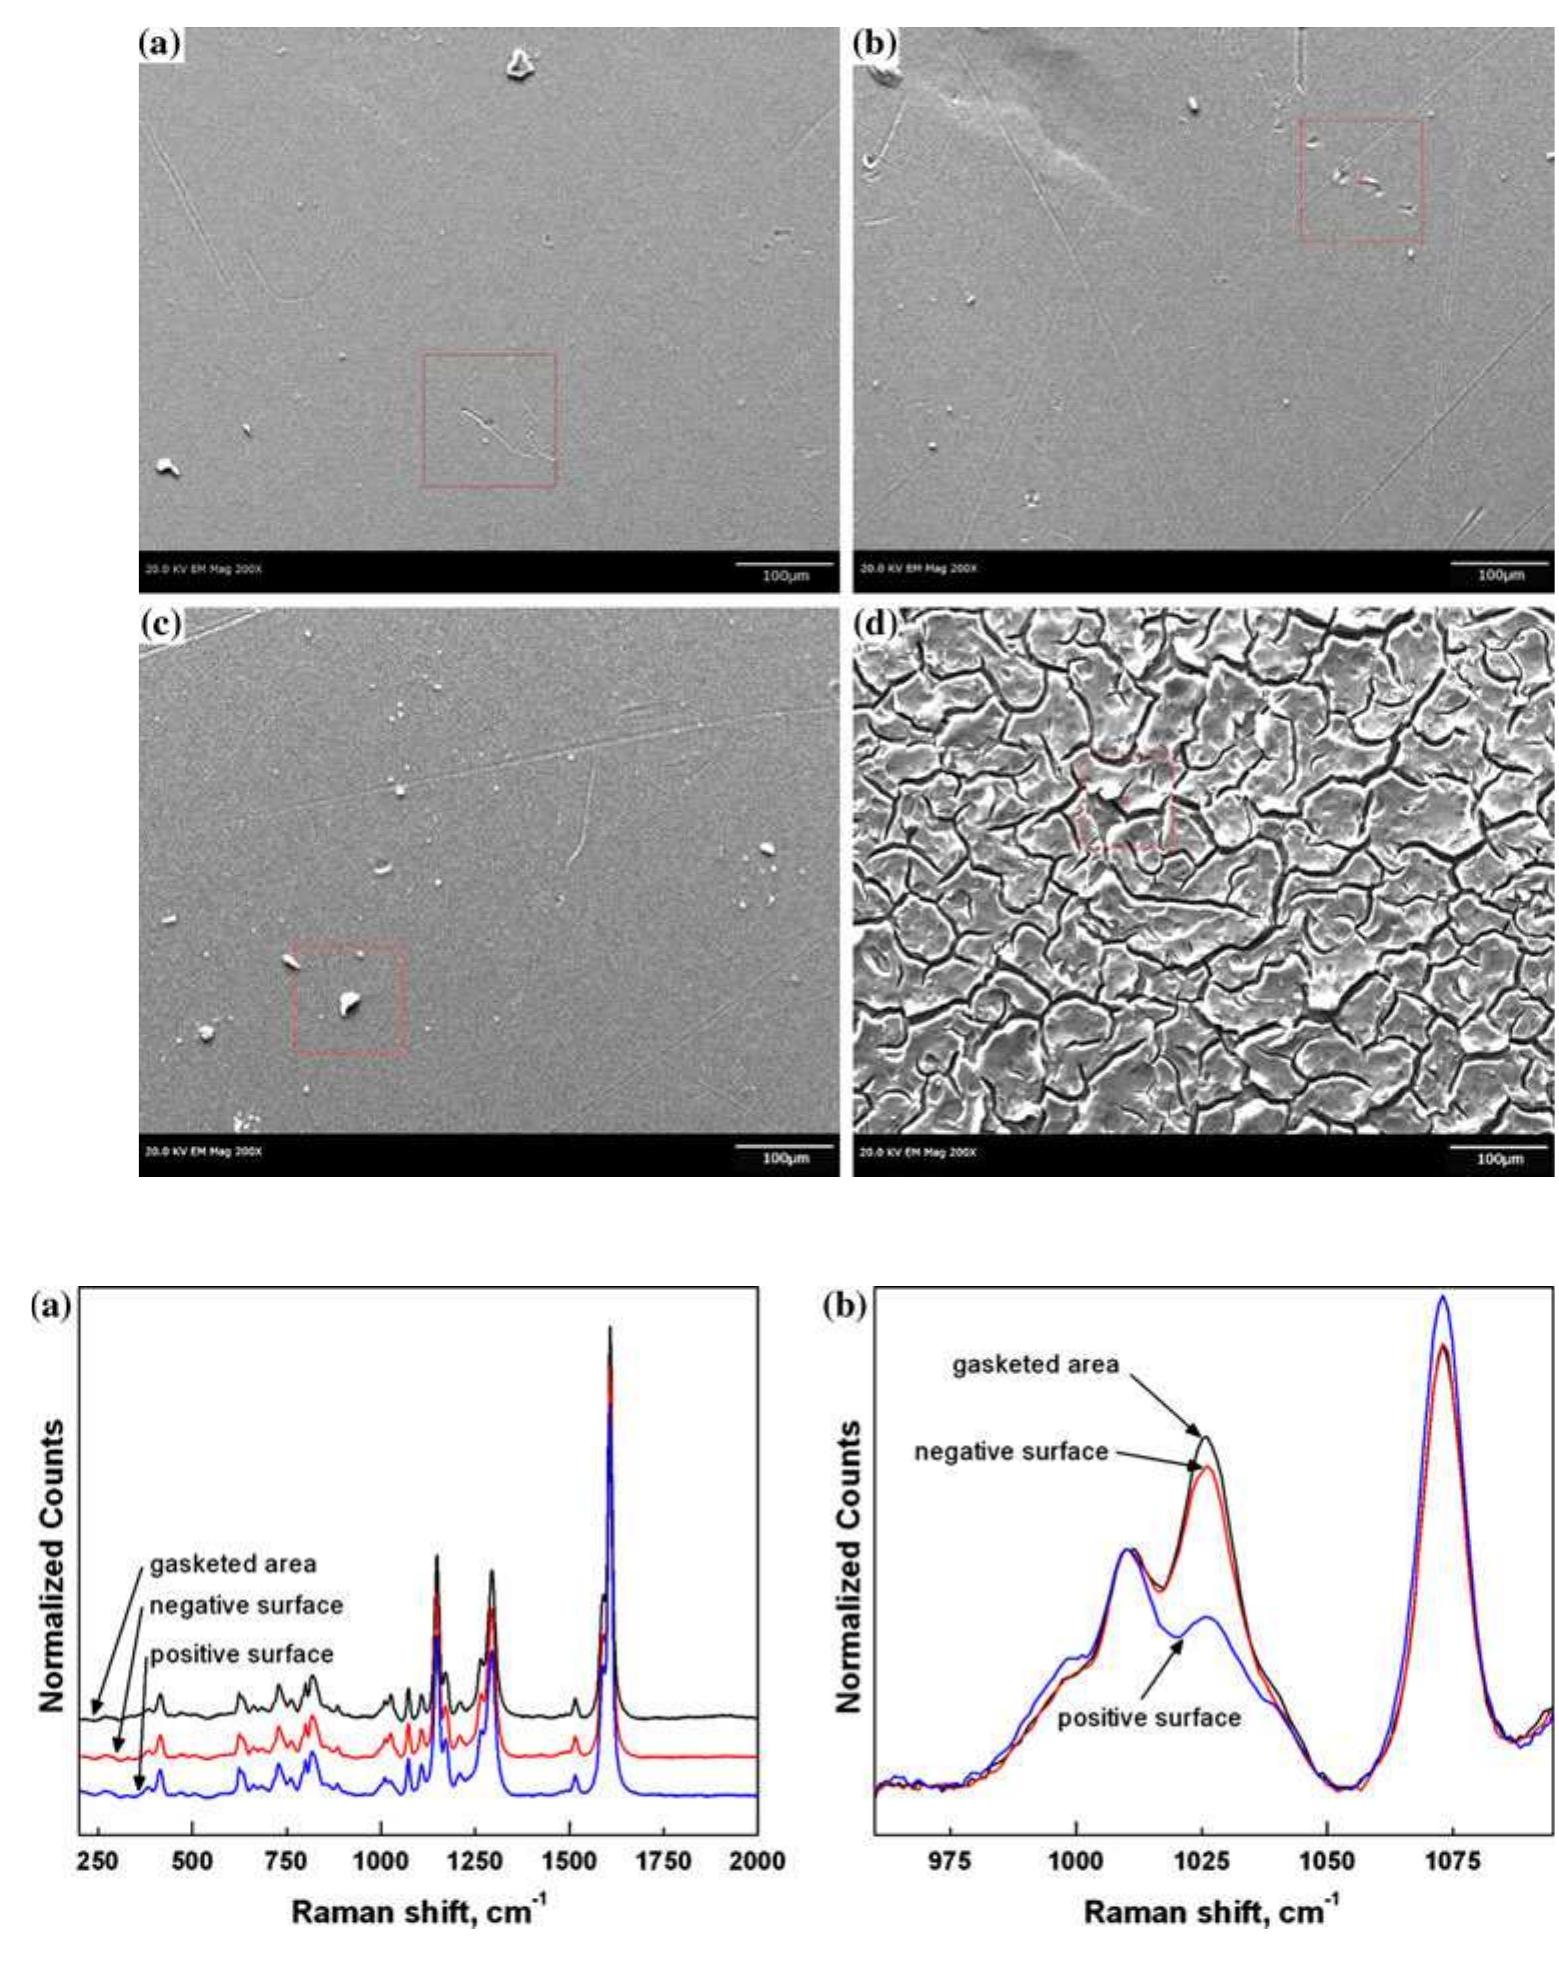
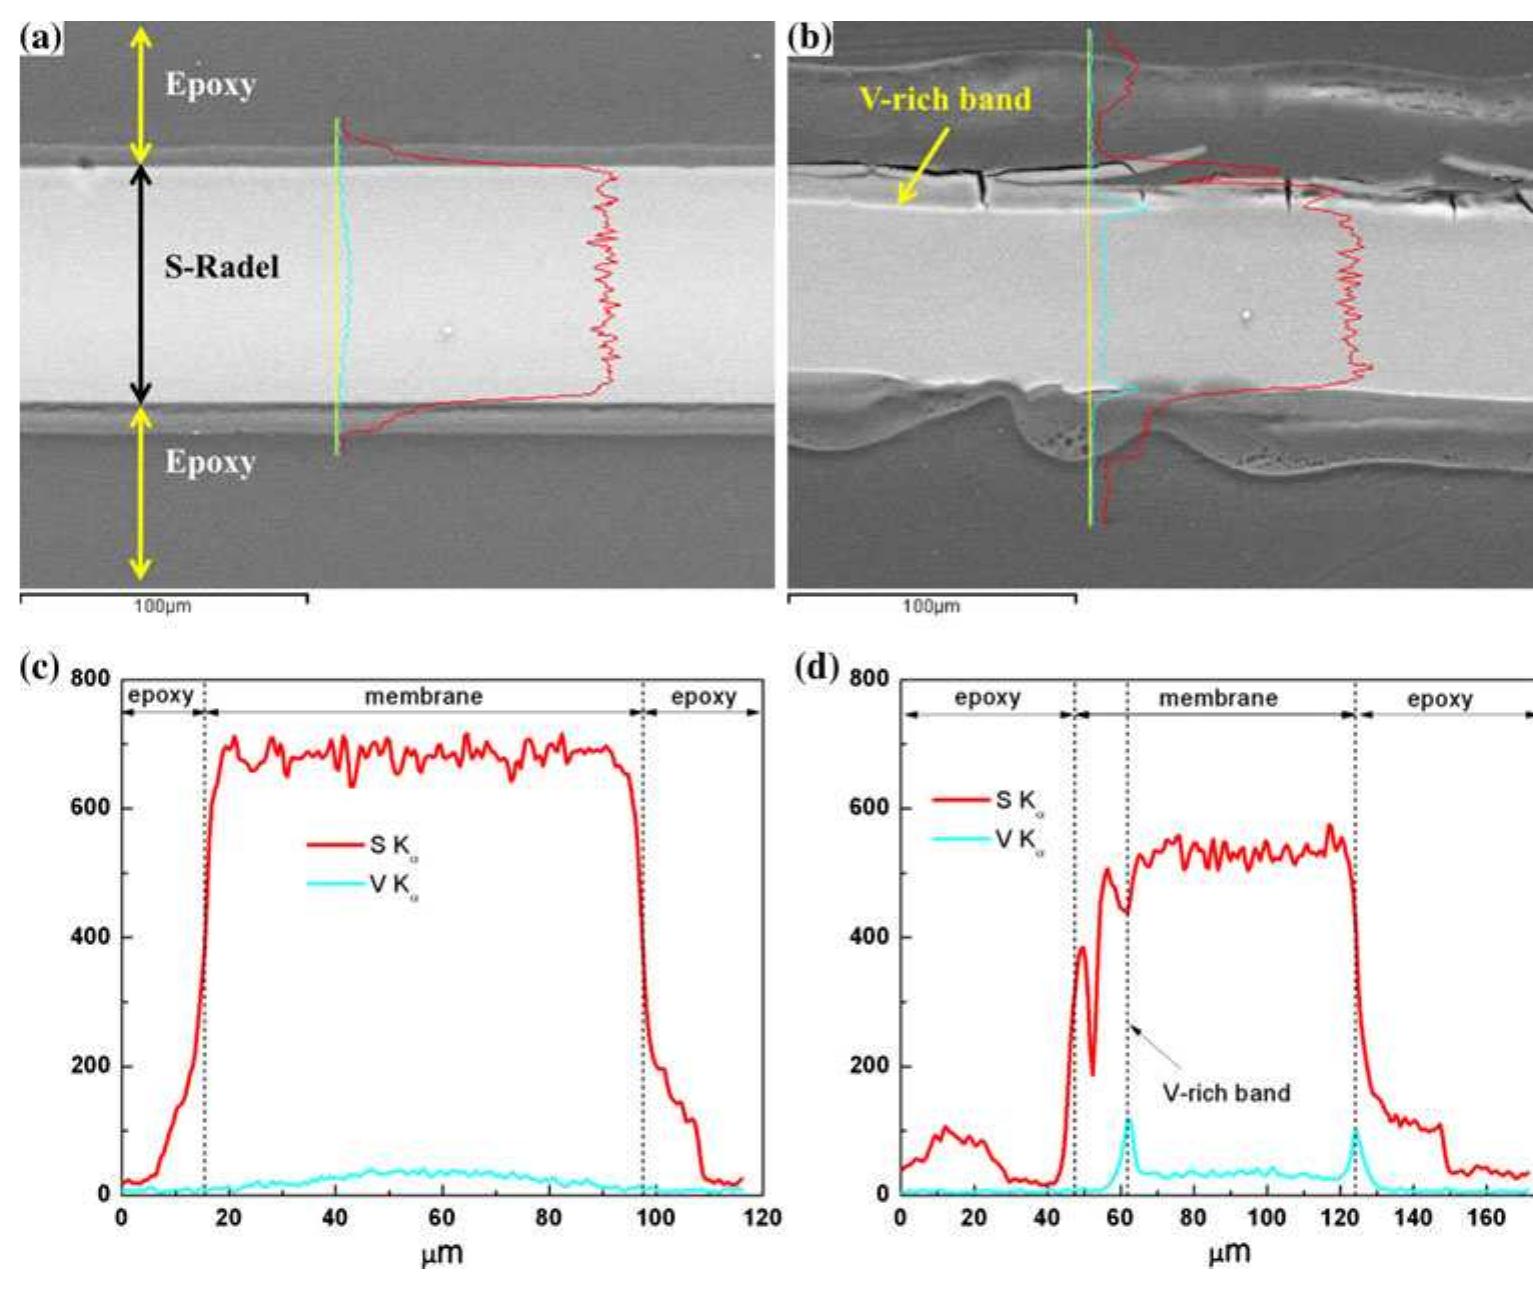
![Fig. 1 Cyclic performance of S-Radel membranes with different V concentration (2.0 vs. 1.7 M) in 5.0M total sulfate solution and current densities (50 mA cm~” for 2.0 M V ion and 75 mA cm~ for 1.7 M V): a Coulombic efficiency (CE), voltage efficiency (VE) and energy efficiency (EE) of S-Radel membranes and b-—d charging and discharging curves with different cycles (i.e. 4, 20, 40, 41, and 45 cycle) Figure la shows that the VRFB with the S-Radel mem- brane employing 2.0 M V in 5.0 M total sulfate electrolyte had good initial performance, but experienced an abrupt loss in coulombic and energy efficiency after the 41st cycle (460 h total run time) [7]. There was a slight voltage effi- ciency loss with cycling, but a dramatic decrease in voltage efficiency was not observed even after the 41st cycle when there was a drastic decrease in coulombic and energy efficiencies. The relatively robust voltage efficiency rep- resents little change of average charge and discharge sample was mounted in epoxy and then polished using Raman analysis was performed using a confocal Raman microscope (Renishaw inVia, UK) with a 50x/0.75 NA objective, 1200 or 2400 lines mm! diffraction gratings, 785 nm diode laser, and Peltier-cooled charge-coupled device (CCD). The diode laser (~30 mW at 100% power) was operated at 10% power with a laser defocus of 50% to avoid signal saturation and sample damage. Co-additions of five scans (200-2000 cm7') and 10 scans (965-1095 cm™'), with an exposure time of 10 s, were used to increase the signal to noise ratios of the spectra. Scanning electron microscope (SEM) images were collected using a FEI Quanta 200 ESEM with an acceleration voltage of 20 kV. Energy dispersive X-ray spectroscopy (EDS) analysis was performed to deter- mine elements of the flow cell cycled and immersion-test membranes using a JEOL JSM-5900 microscope. For EDS analysis across the cross-section of the cycled membrane, the sample was mounted in epoxy and then polished using](https://figures.academia-assets.com/47338158/figure_001.jpg)
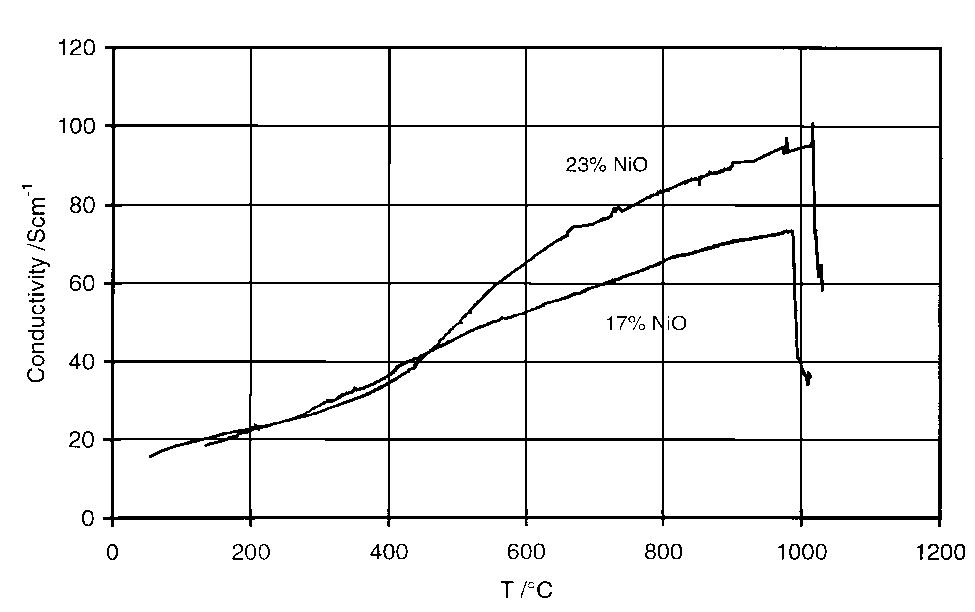
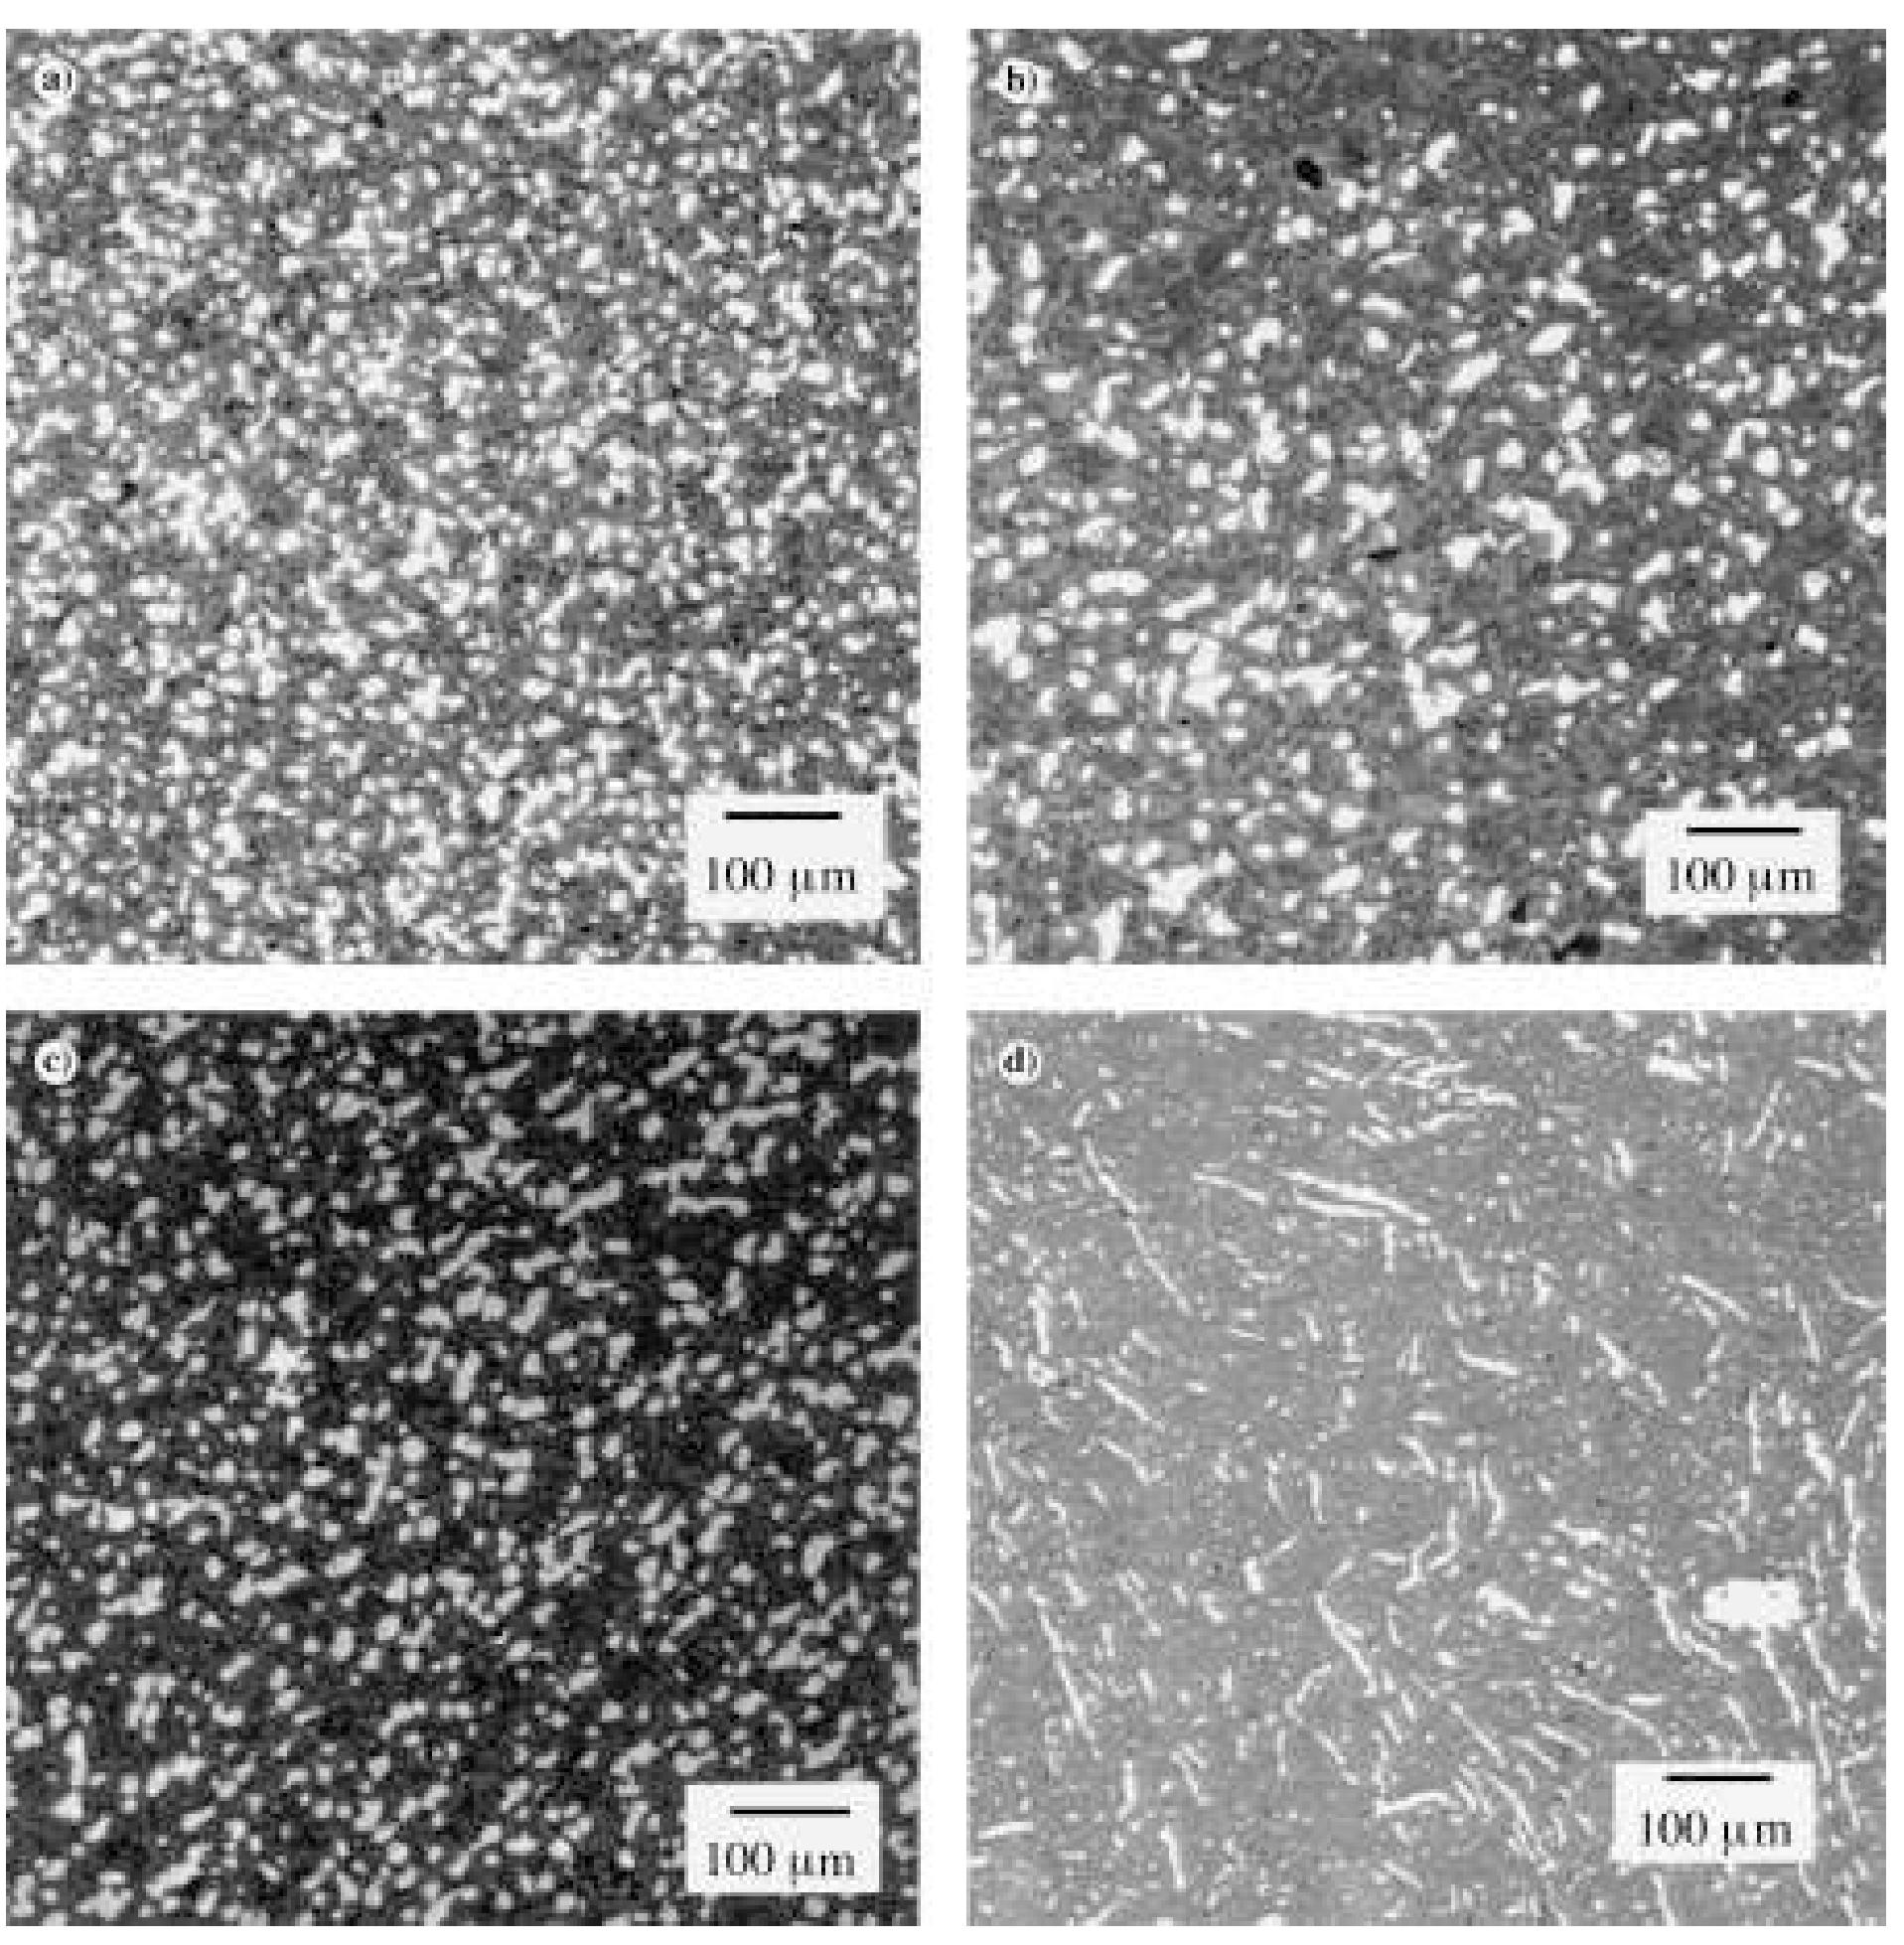
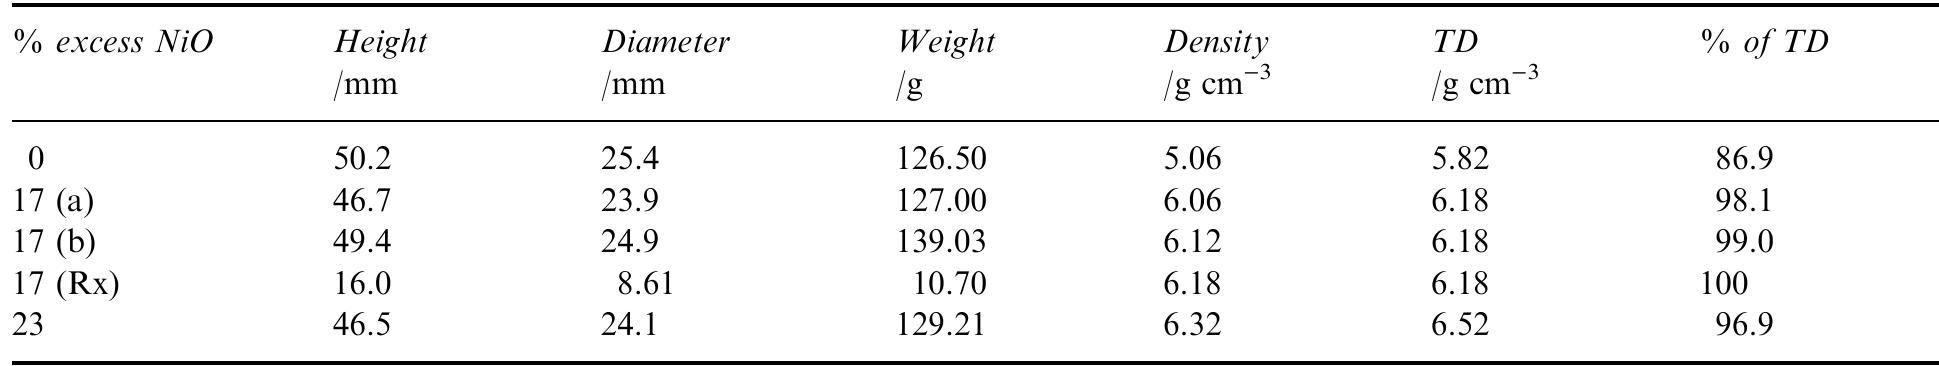
![Table 2. Composition of the individual phases in the sintered materials as determined by X-ray microanalysis (XRM A) lates to the analytical data collected from the energy spectra in the X-ray microanalyser (XRMA) of ne SEM. A Be window was used which did not allow analysis of light elements such as oxygen. Batte PNL [7] found the Fe/Ni atomic ratio to be in range 2.2—2.6 in the ferrite phase and 0.09-0.2 in NiO phase. For NiO, this is consistent with the rati found in this work, but not for the Fe/Ni ratio in ferrite, which in Table 2 ranges 2.6-3.5. This implies that the ferrite phase in this work had a higher degr ee of non-stoichiometry than the materials used by Battelle-PNL; this is most likely because Fe** cations substituted Ni** in the spinel lattice.](https://figures.academia-assets.com/41925088/table_002.jpg)
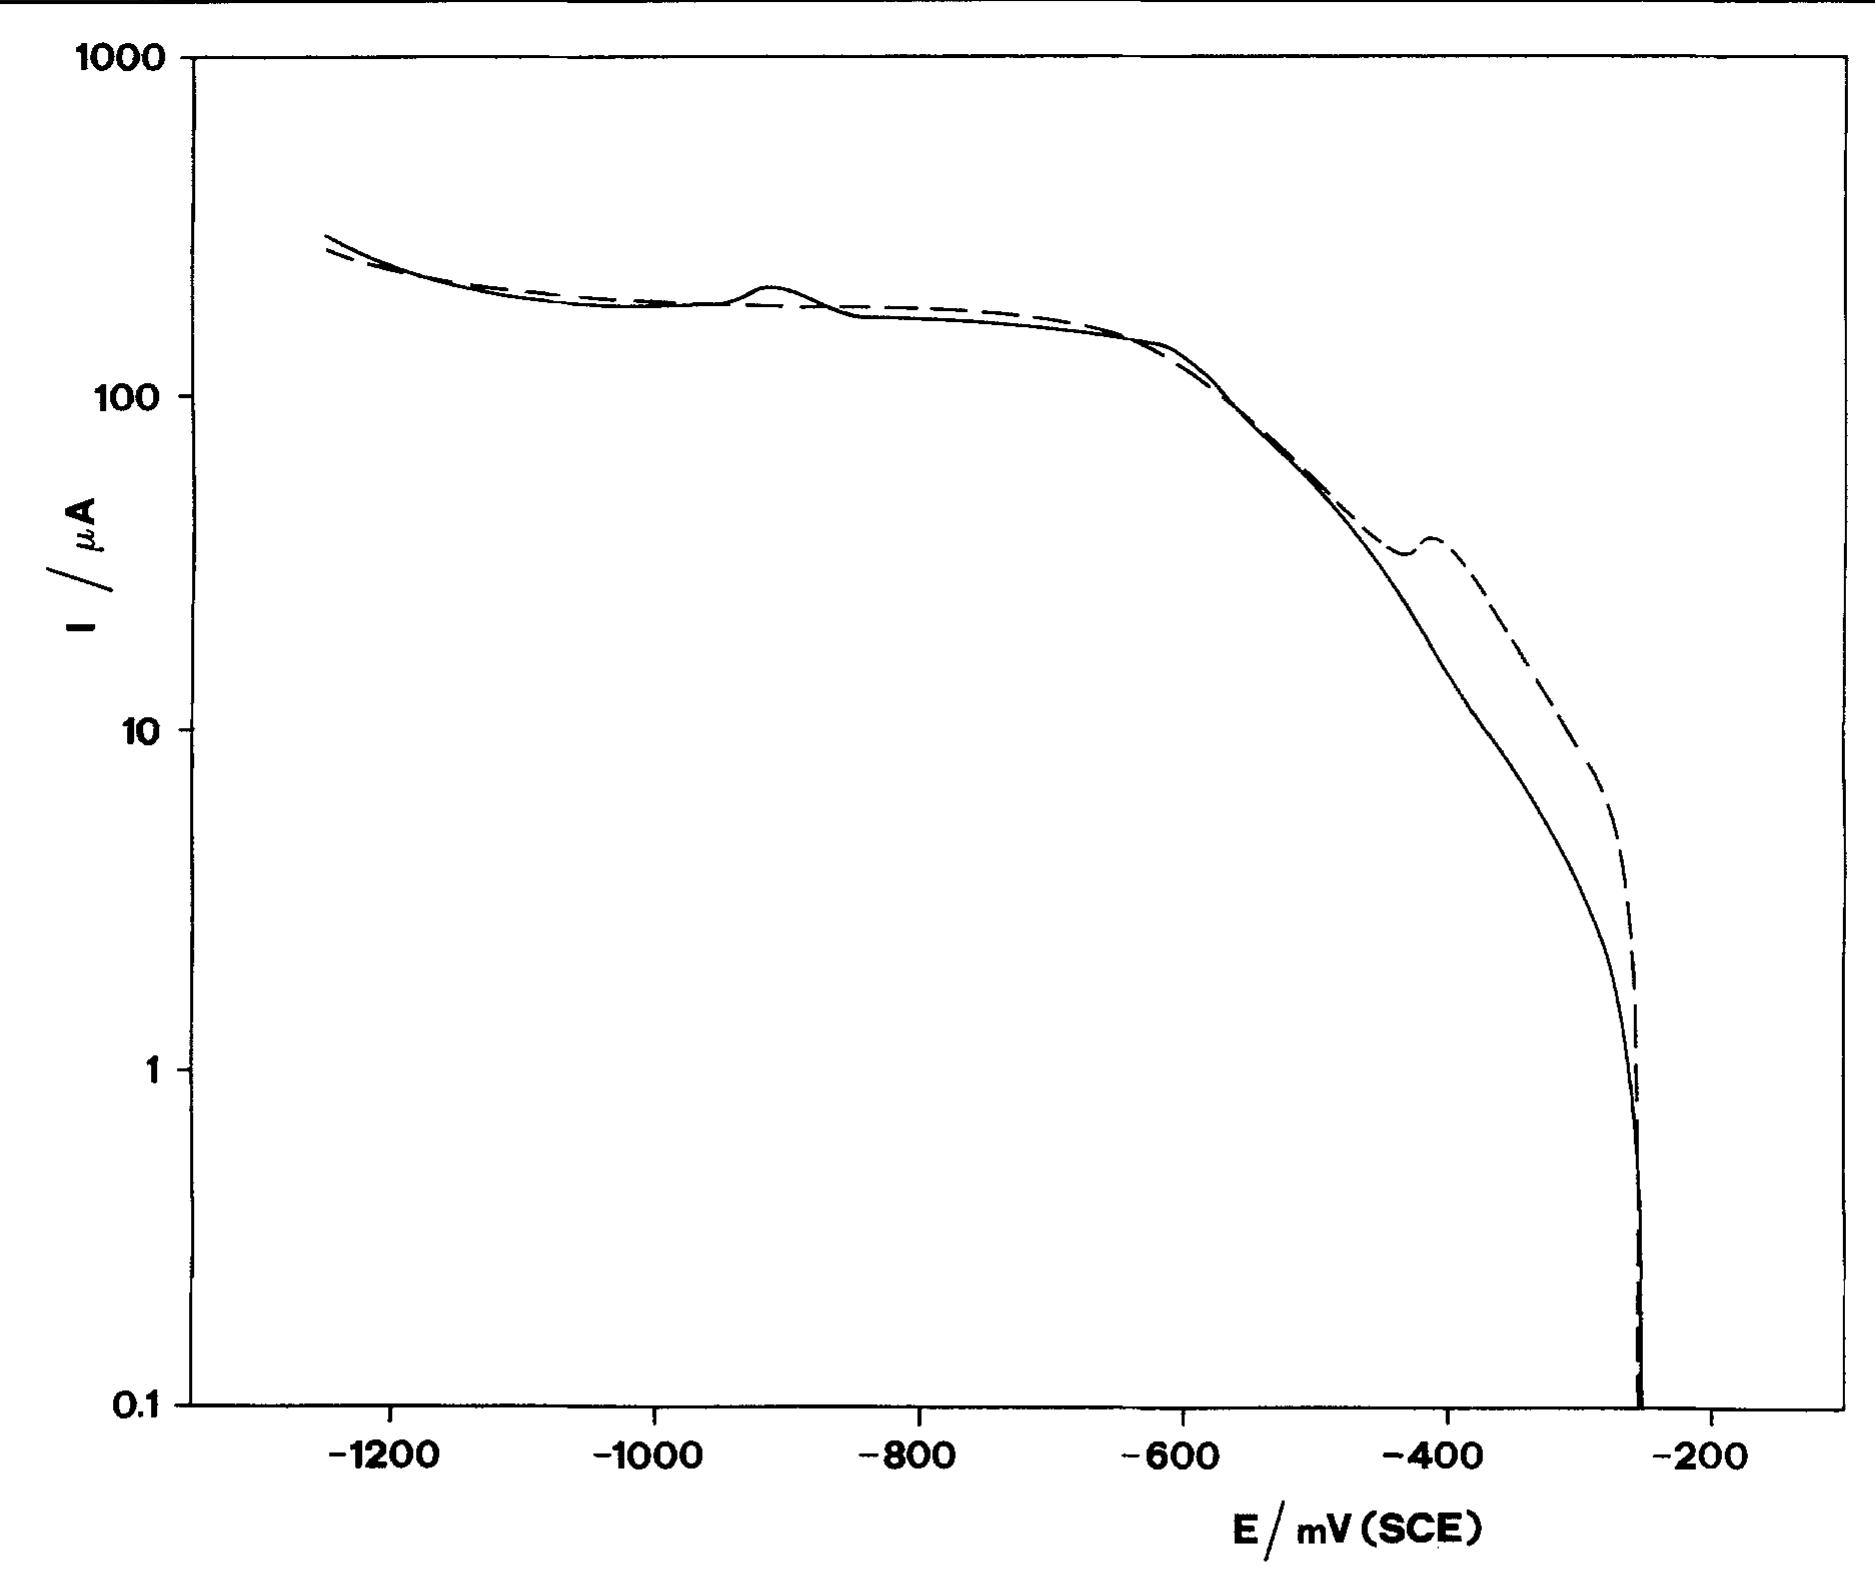
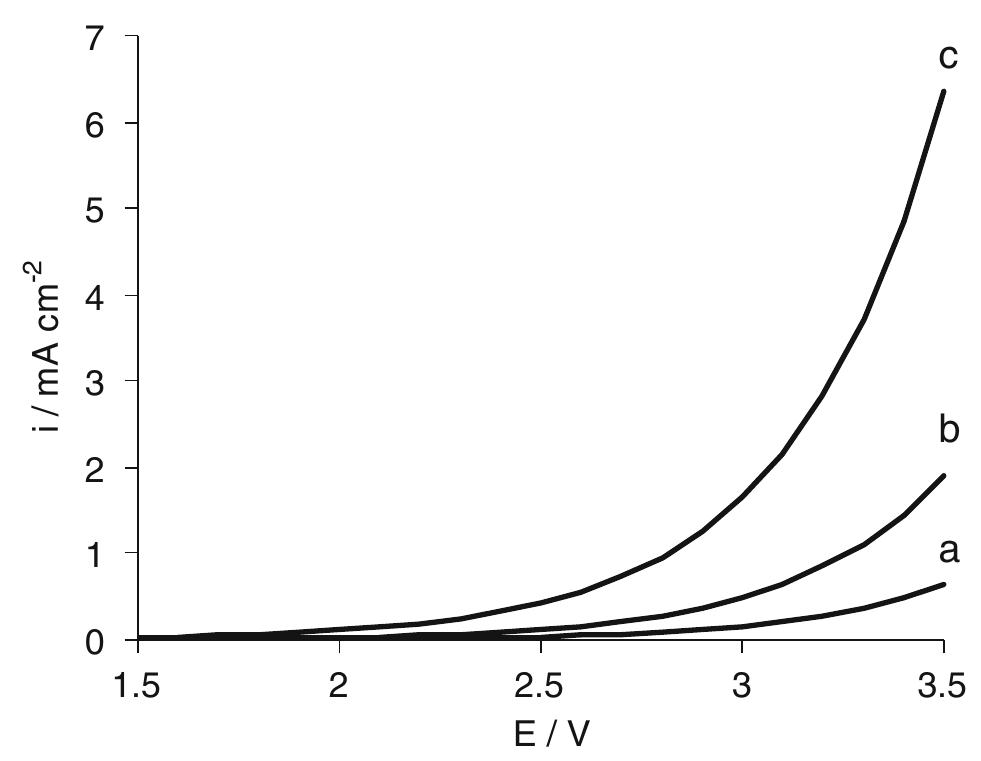
![Fig. 4 Faradic yield 7 of chloride oxidation from batch electrolysis with different initial chloride concentrations; i= 5 mA cm~°, Qe = 1.4 dm? min7! concentrations. Moreover at BDD anode the effect of the chloride concentration on the faradic yield is more evident. “ This behaviour may be interpreted considering the competition between chloride oxidation and oxygen evo- ution at the two electrodes, current density value being the same. Since at DSA anode the oxygen evolution takes place at low overpotential [16], this reaction is highly competitive with chlorides oxidation. On the other hand, the overpotential for the oxygen evolution is very high at BDD, so that the oxidation of chlorides is kinetically favoured [17]. This can be seen from pseudo steady state polarization curves obtained (at 0.5 mV s_1) with different chloride concentration at BDD anode (Fig. 5): with 30 mM of chlorides the onset of the chlorine evolution shifts to less positive potential than that required for oxygen evolution.](https://figures.academia-assets.com/42424536/figure_004.jpg)
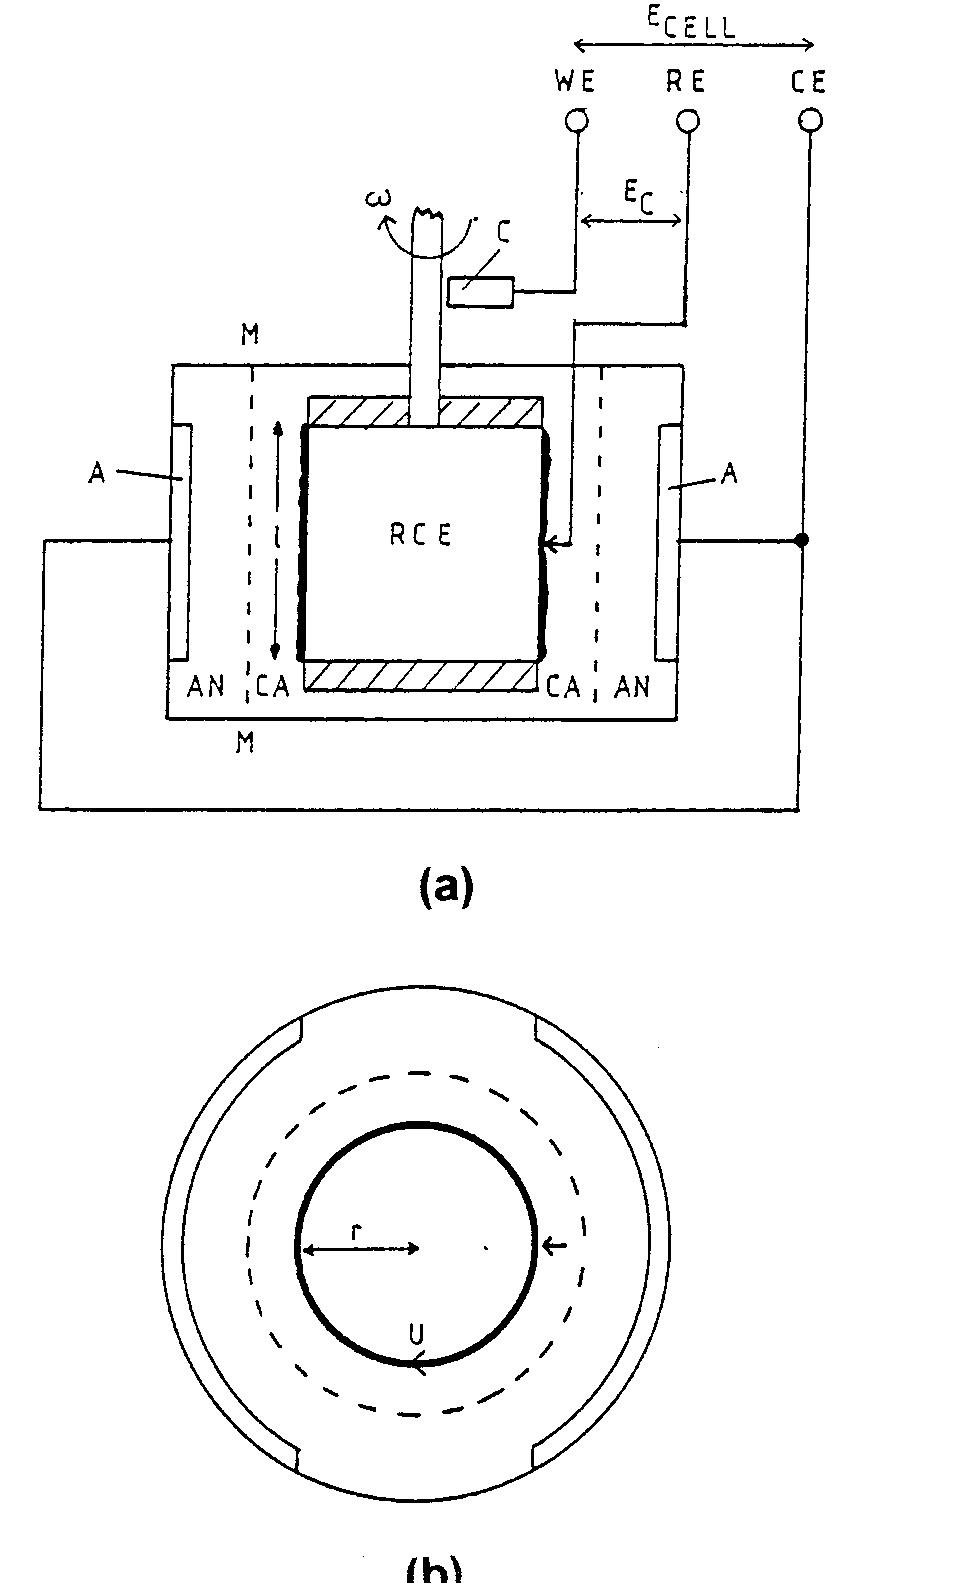
![Fig. 18. Polarization curves for E-Brite stainless steel in industrial grade 93% sulphuric acid at 333 K, showing the effect of RCE rotation rate. After Silverman [174]. Rotation rates: (- - - - - ) 0, (---- ---- ) 20.9, (-- -- --) 52.0 and (------ ) 209 rod s“!.](https://figures.academia-assets.com/40365724/figure_018.jpg)
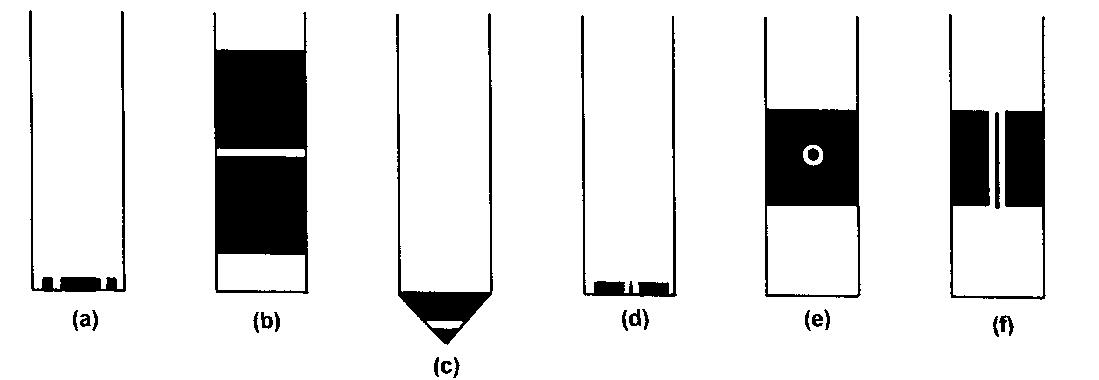
![Fig. 14. Agitated current distribution cells using conical geometry. (a), (b) Afshar er al. [141]; (c), (d), (e) Afshar et al. [141] and Lu[144].](https://figures.academia-assets.com/40365724/figure_014.jpg)
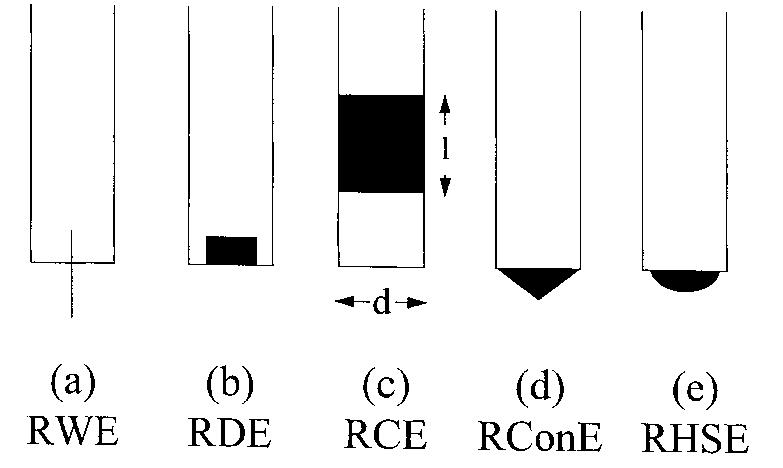
![Table 3. Details of selected single catholyte compartment RCE reactors [8] approximate range 0.1 <d/1 <2 [32,74] but the usual range is much smaller for industrial devices, that is, 0.9 < d/l < 1.6, as indicated in Table 3.](https://figures.academia-assets.com/40365724/table_003.jpg)
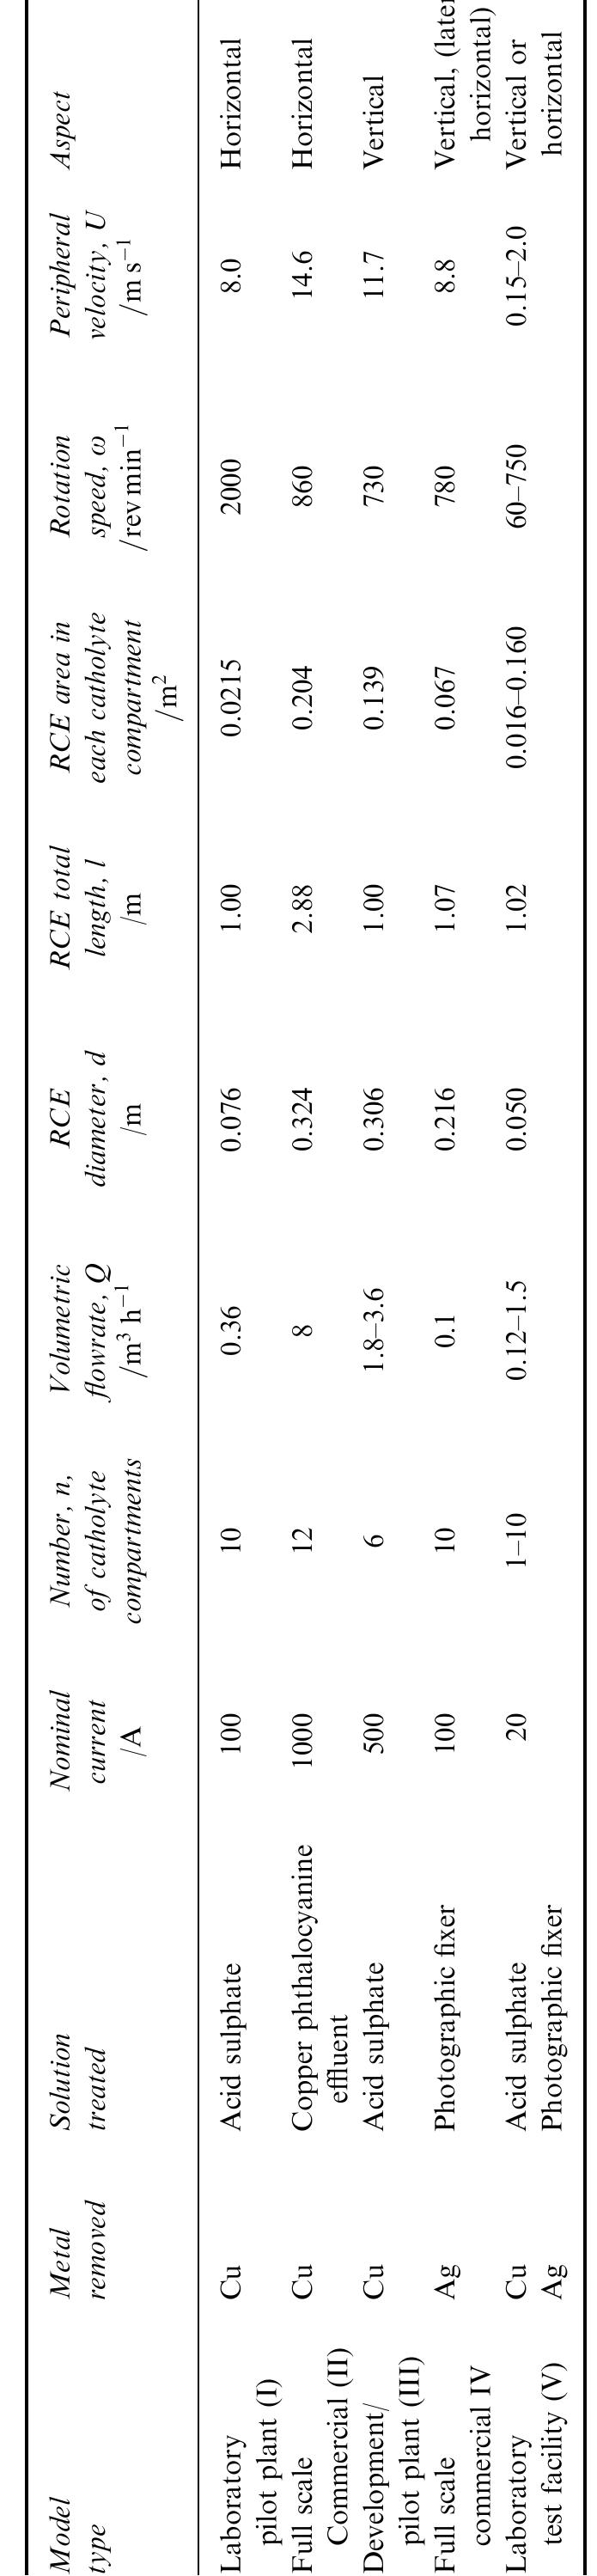
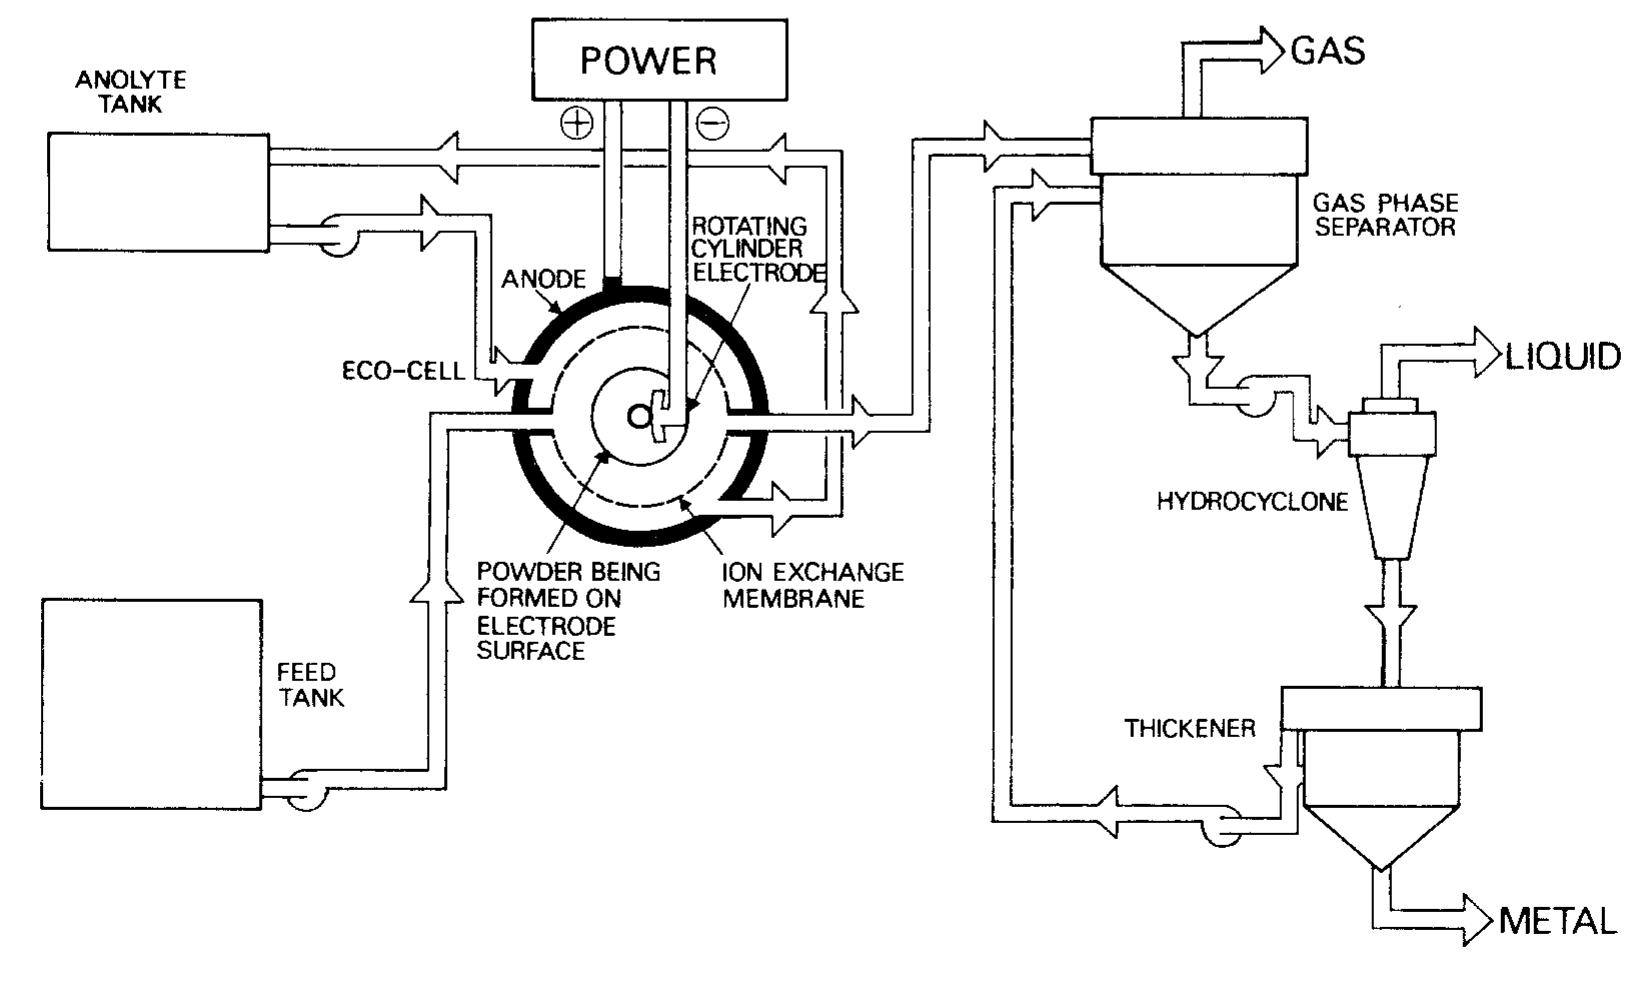
![Fig. 7. Designs for concentric RCE reactors involving metal deposition at the inner cathode. (a) Fully concentric undivided cell (idealized); (b) undivided cell using a hexagonal arrangement of anode plates (commonly used in photographic silver recovery); (c) divided cell in which a scraper is used to dislodge metal powder deposits (as in the Eco-cell). o investigate cadmium extraction from a concen- rated zinc calcine liquor. Models H and I were purpose-built to suit applications involving silver re- covery from phthalocyanine effluent, respectively. Model J has been described elsewhere [59] as a pro- otype system for silver removal from X-ray film fixer iquors. It is interesting to note that the peripheral velocity was normally in the approximate range <U/ms-! <10 while the (maximum) rotation speed is decreased for the larger rotating cylinder electrodes. The aspect ratio (d//) has varied in the The fractional conversion per pass in a single catholyte compartment reactor is usually limited to approximately 0.5 [59,74]. To obtain high overall conversions in a single pass, cascade reactors have been developed [50, 51, 65] by subdividing a long rotating cylinder electrode reactor using baffle plates in the catholyte. Current and potential distribution are critical in these devices [65, 74]. Table 4 summa-](https://figures.academia-assets.com/40365724/figure_007.jpg)
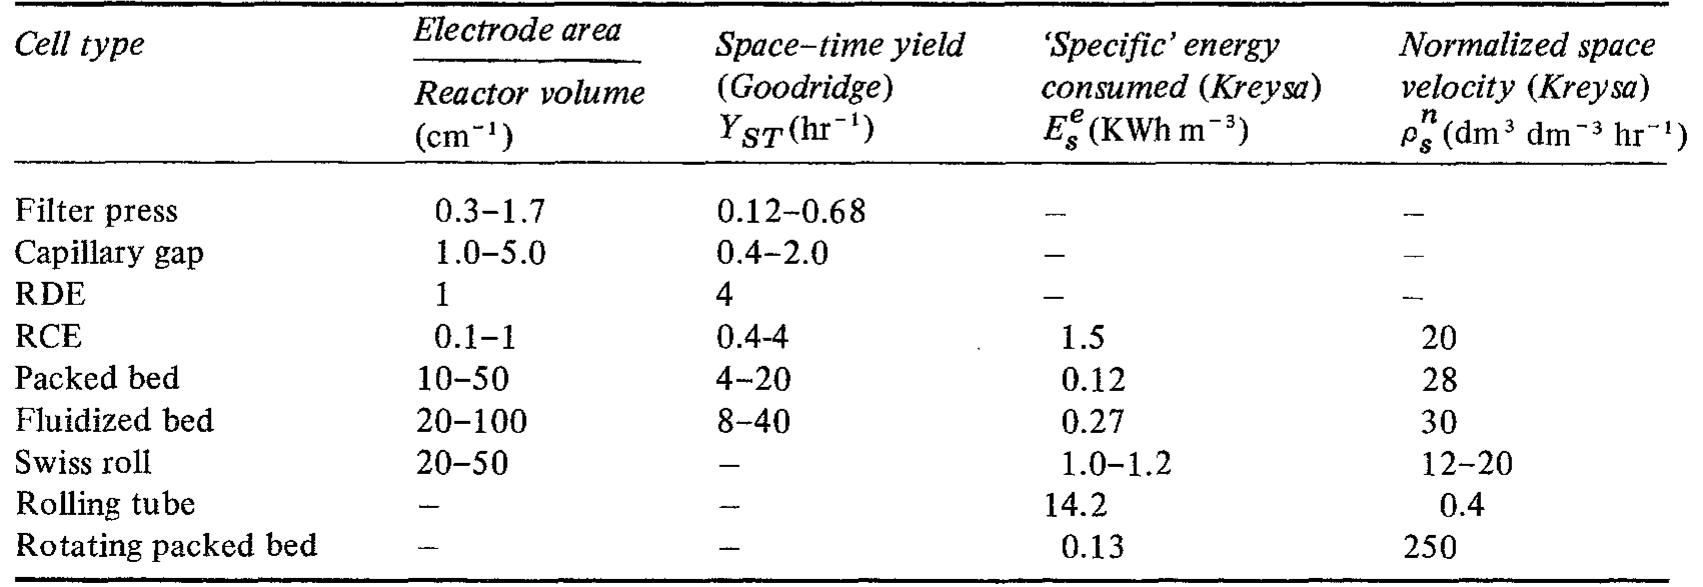
![to a number of reasons associated with resistance or overpotential and electroplating shops need to be able to control in a predictive manner the current density being employed. The effect is summarized below by referring to three types of electrode or cell: Shortcomings arise due to number of factors, e.g. temperature, agitation, volumetric errors, metal de- pletion etc., which have been discussed fully else- where [110, 143], and a substantial number of variations on these classical designs have been ex- plored [110].](https://figures.academia-assets.com/40365724/table_005.jpg)
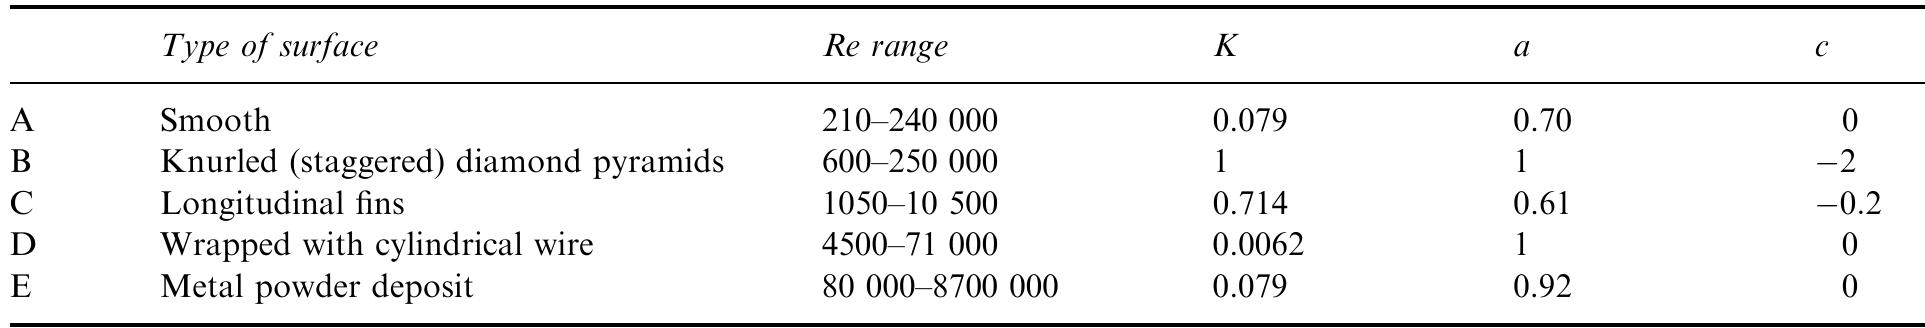
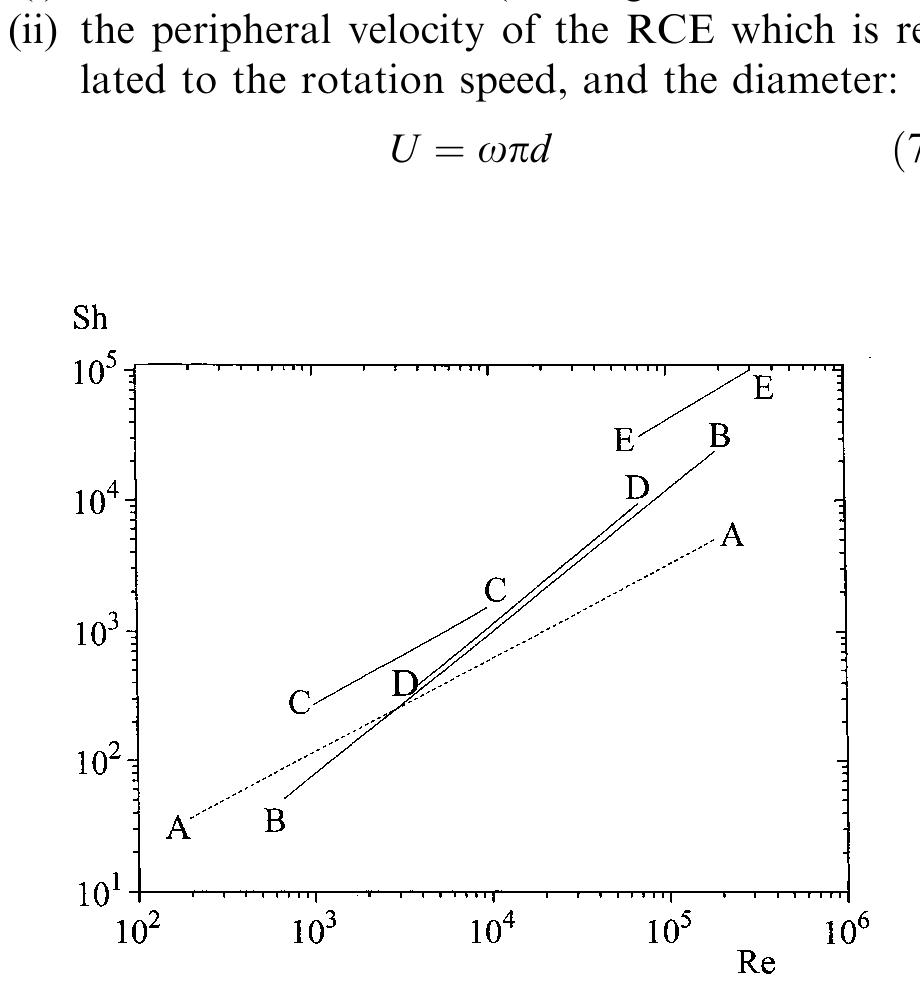
![Fig. 4. Enhancement by roughness. Mass transfer correlations (Sh/Re) for several types of roughness using acid copper deposition after Makanjuola and Gabe [10]. Legend: (1) smooth cylinder, (2) longitudinal ‘v’ groove, (3) circumferential ‘v’ grooves, (4) pyra- midal knurling, (5) wire wound cylinders, (6) weave screen (fine) and (7) weave screen (coarser).](https://figures.academia-assets.com/40365724/figure_004.jpg)
![design options, or more particularly those employed to date, are illustrated in summary form in Figs 14 and 15 in which several ingenious formats may be noted. The efficacy of any specific design may be defined in terms of (a) a good correlation of current Both RCE and RConE. based designs have a vir- tue of retaining the Hull cell geometry concept while introducing well-controlled electrode movement, the alternative of solution agitation or pumping being much less satisfactory for quantitative analysis. The Fig. 15. Agitated current distribution cells using cylindrical geometry. (a) Afshar et al. [141]; (b) Lu [144]; (c), (d) Kadija et al. [145]; (e), (f) Madore et al. [137,138].](https://figures.academia-assets.com/40365724/figure_015.jpg)
![Fig. 13. Electrodeposit morphology diagram for Zn—Ni alloy deposits from an acid solution after Wilcox and Gabe [106].](https://figures.academia-assets.com/40365724/figure_012.jpg)
![Fig. 16. Dynamic Hull cell correlations. (a), (b) Kadija et al. [145]; (c), (d) Afshar et al. [141]; with rotation rates: (®) 0, (1) 30,(@)50, (C) 100, (A) 200 and (x) 300rpm; (e) Madore et al. [137, 138]; with b/c (------ ) 0.3, (— — —) 0.5 and (——) 0.9; (f) Madore et al. [137, 138]; with copper thickness (@), secondary distribution (------ ) and Equation (——). Some relevant correlations are summarized graphically in Fig. 16; the practical utilization for these designs has not yet been established but at the time of writing Landolt et al. [109, 111, 137-9] have demonstrated satisfaction most effectively. In the earlier reviews it was pointed out that nu- merous corrosion or anodic dissolution investigations had made use of the RCE but that they were essen- tially empirical studies without fundamental design and control of rotation for mass transfer analysis.](https://figures.academia-assets.com/40365724/figure_016.jpg)
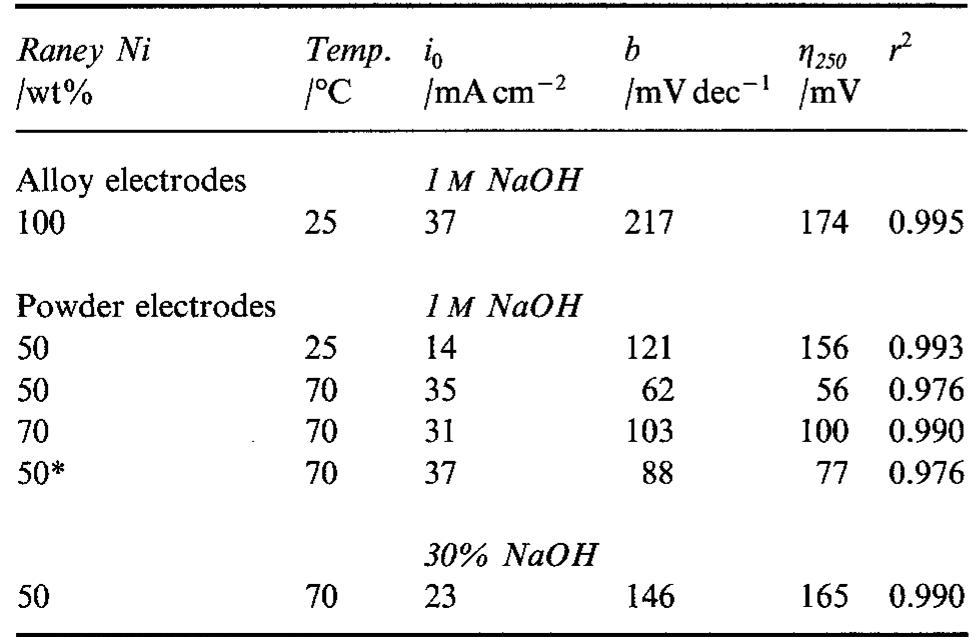
![and heated to 1600°C. The electrode obtained from 80% of Raney nickel and 20% of nickel powder (60% Ni in the alloy) showed 4,5) = 182 mV at 25°C (after leaching) but it was much less stable mechanically than the former one. Finally, the electrode made of 60% of Raney nickel and 40% of nickel powder (70% Ni in the alloy, atomic ratio ~ 1 : 1) showed a very low activity towards h.e.r with yy) = 507mV. It showed resistance to the leaching procedure, probably because of the formation of the NiAl phase [1].](https://figures.academia-assets.com/43990576/figure_004.jpg)
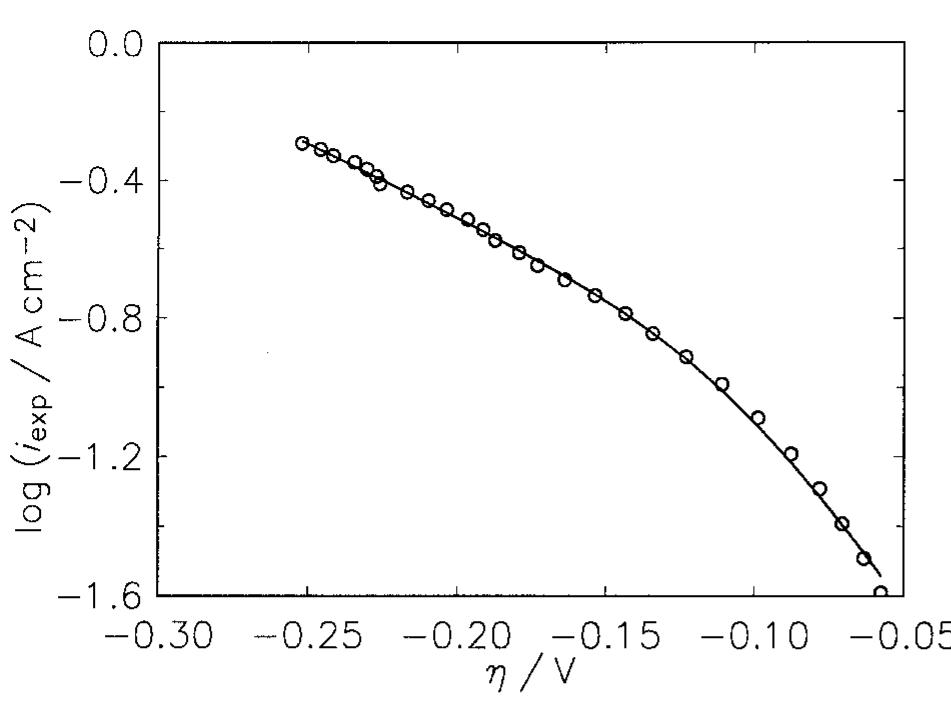
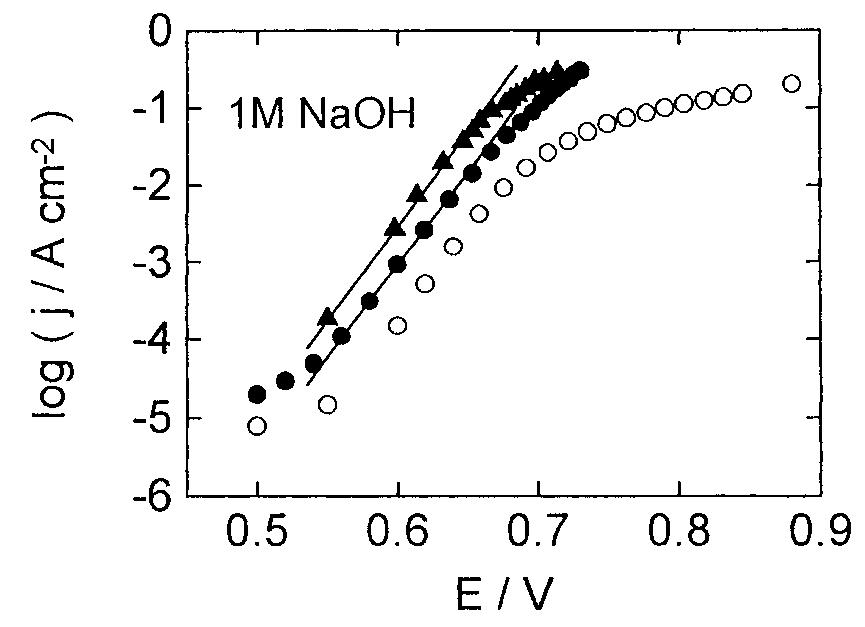
![where T is connected with the average double layer capacity, C, [11,15,16,22] and ® is a constant between 0 and 1 corresponding to the rotation angle of Fig. 5. Tafel curves obtained on Raney nickel—nickel (50%) powder electrode in 1M NaOH at 25°C. (0) Experimental; ( ) cal- culated using data from Table 2.](https://figures.academia-assets.com/43990576/figure_005.jpg)
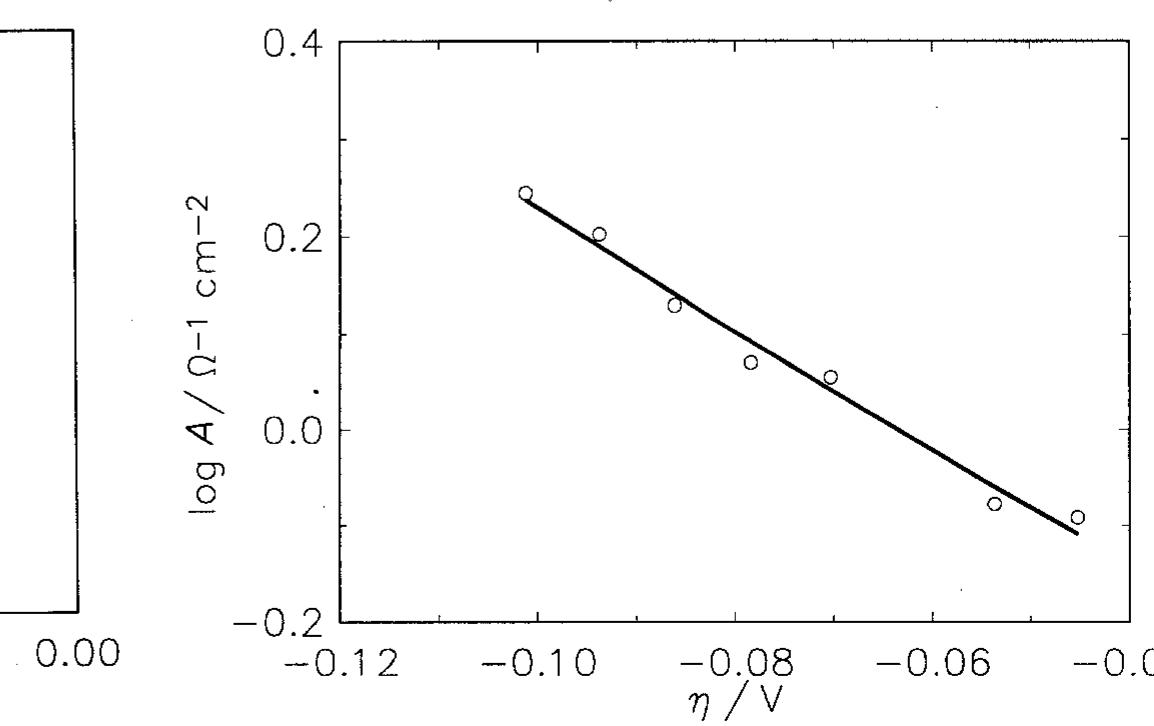
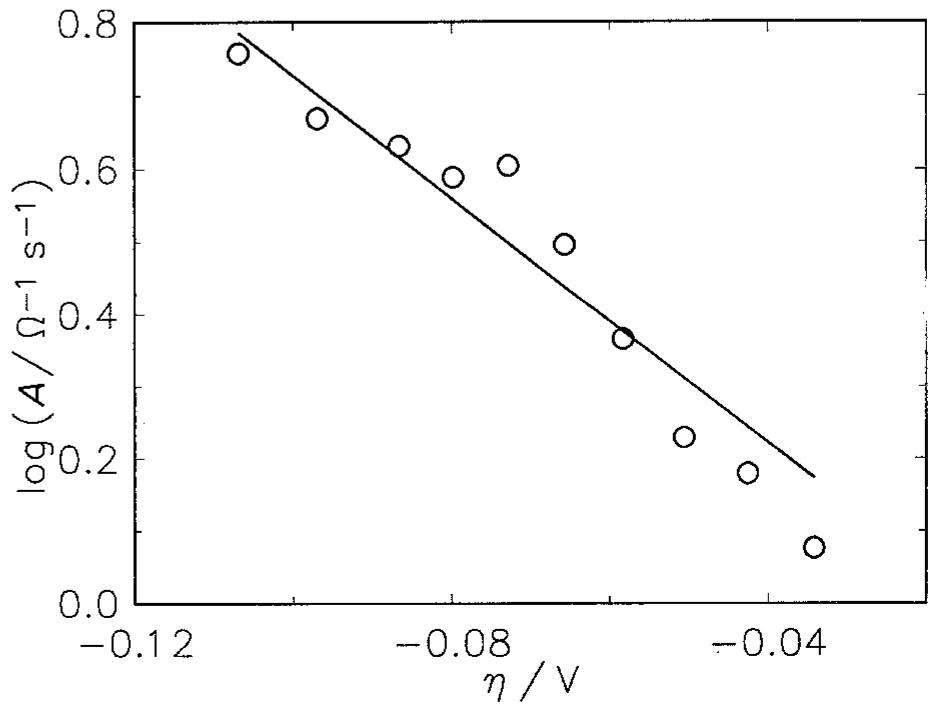
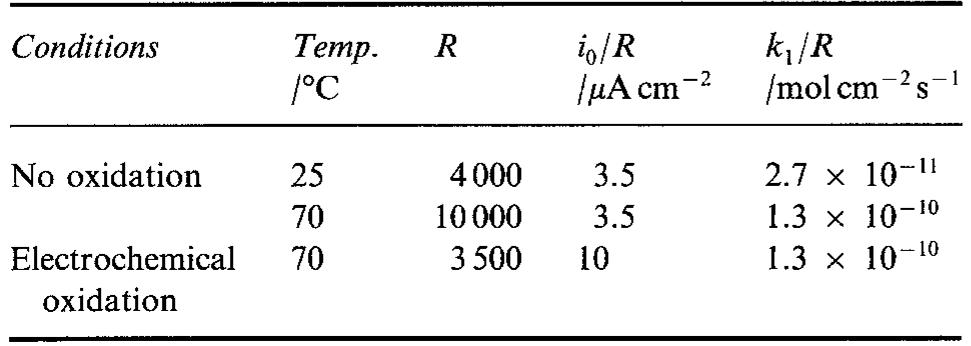
![Fig. 9. Dependence of the parameter A on overpotential for the Raney nickel-nickel (50%) powder electrode at 25°C. (©) Exper- imental; ( ) calculated using data from Table 2. Fig. 7. Constant phase angle as a function of the overpotential for Raney nickel-nickel (50%) powder electrode in 1 M NaOH at 25°C (M) and 70°C (0). The Tafel currents and A values were approximated assuming the Volmer-Heyrovsky reaction mechanism, similarly to our earlier studies [11,13,15-17,20,21]. It was also assumed that the transfer coefficients of these two reactions are equal to 0.5 [16,17,20,21]. Only at 25 °C it was necessary to use the transfer coefficients as adjustable parameters. In this case the transfer coeffi- cient found for the Volmer step was 0.5, however that for the Heyrovsky step was much lower and equal to Table 3 includes values of the exchange current density and the smallest rate constant (k,), recal- culated on the real electrode surface area. These values are higher than those found for a polycrystalline nickel, iy = 18pAcm-* and k, = 4 x 107’molcm~’s7!](https://figures.academia-assets.com/43990576/figure_007.jpg)
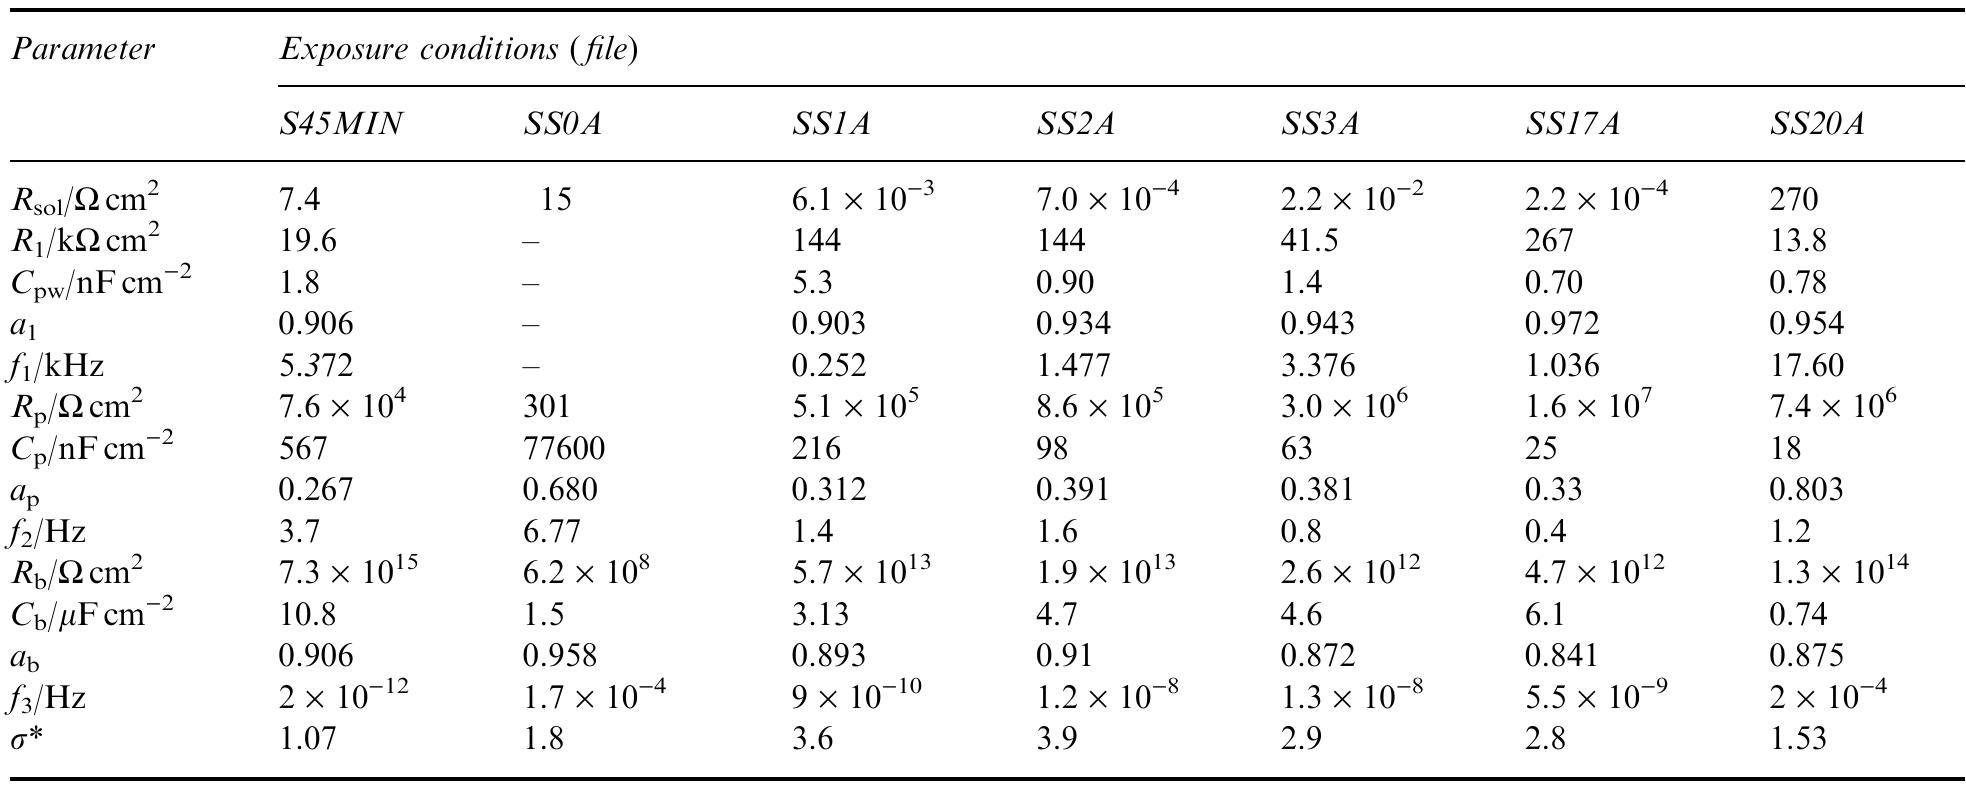
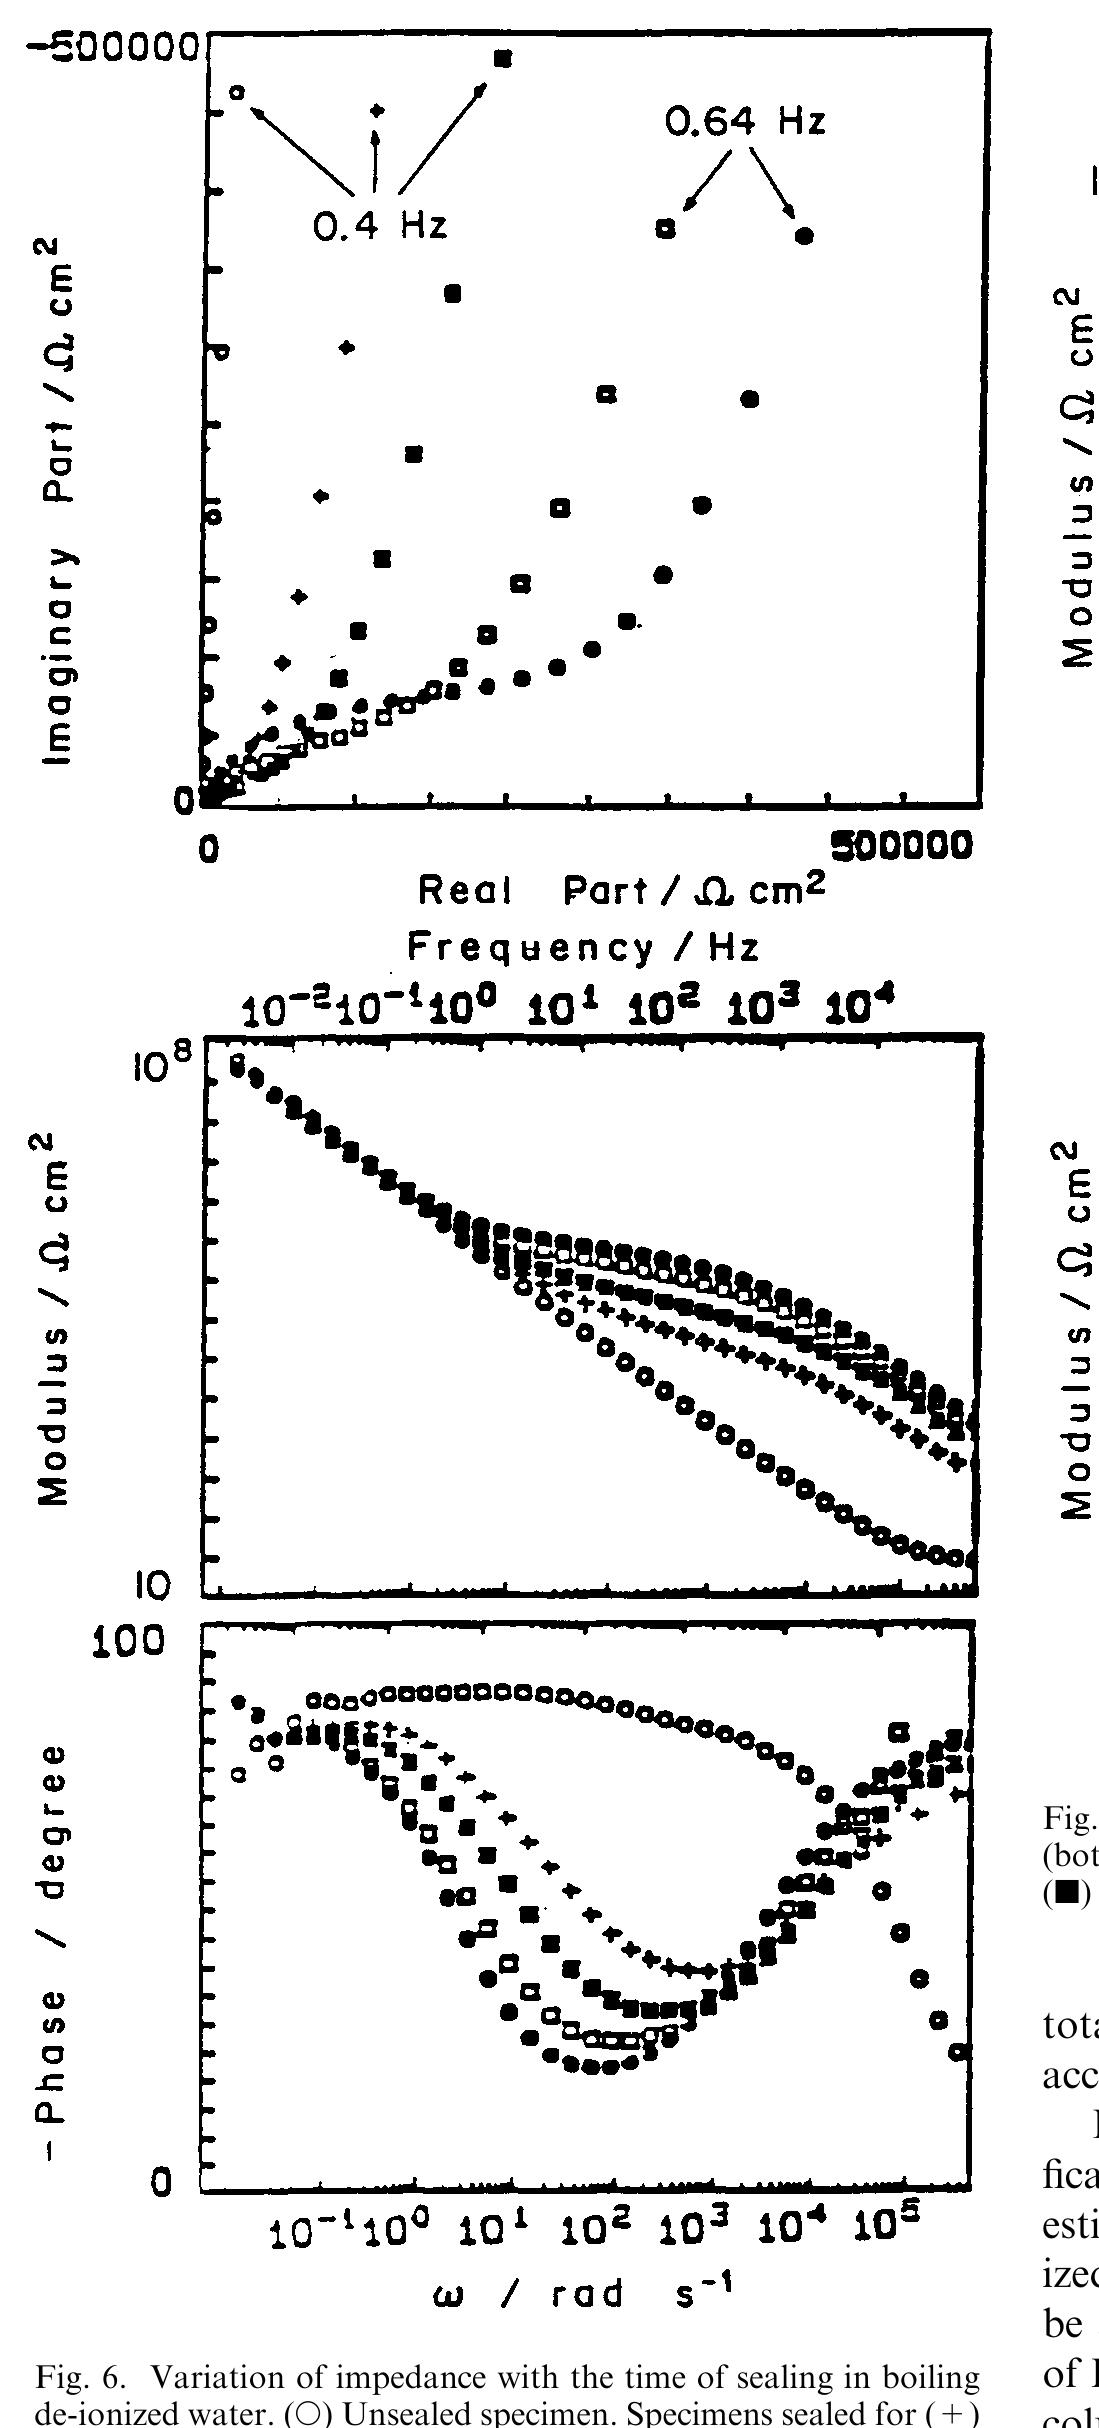
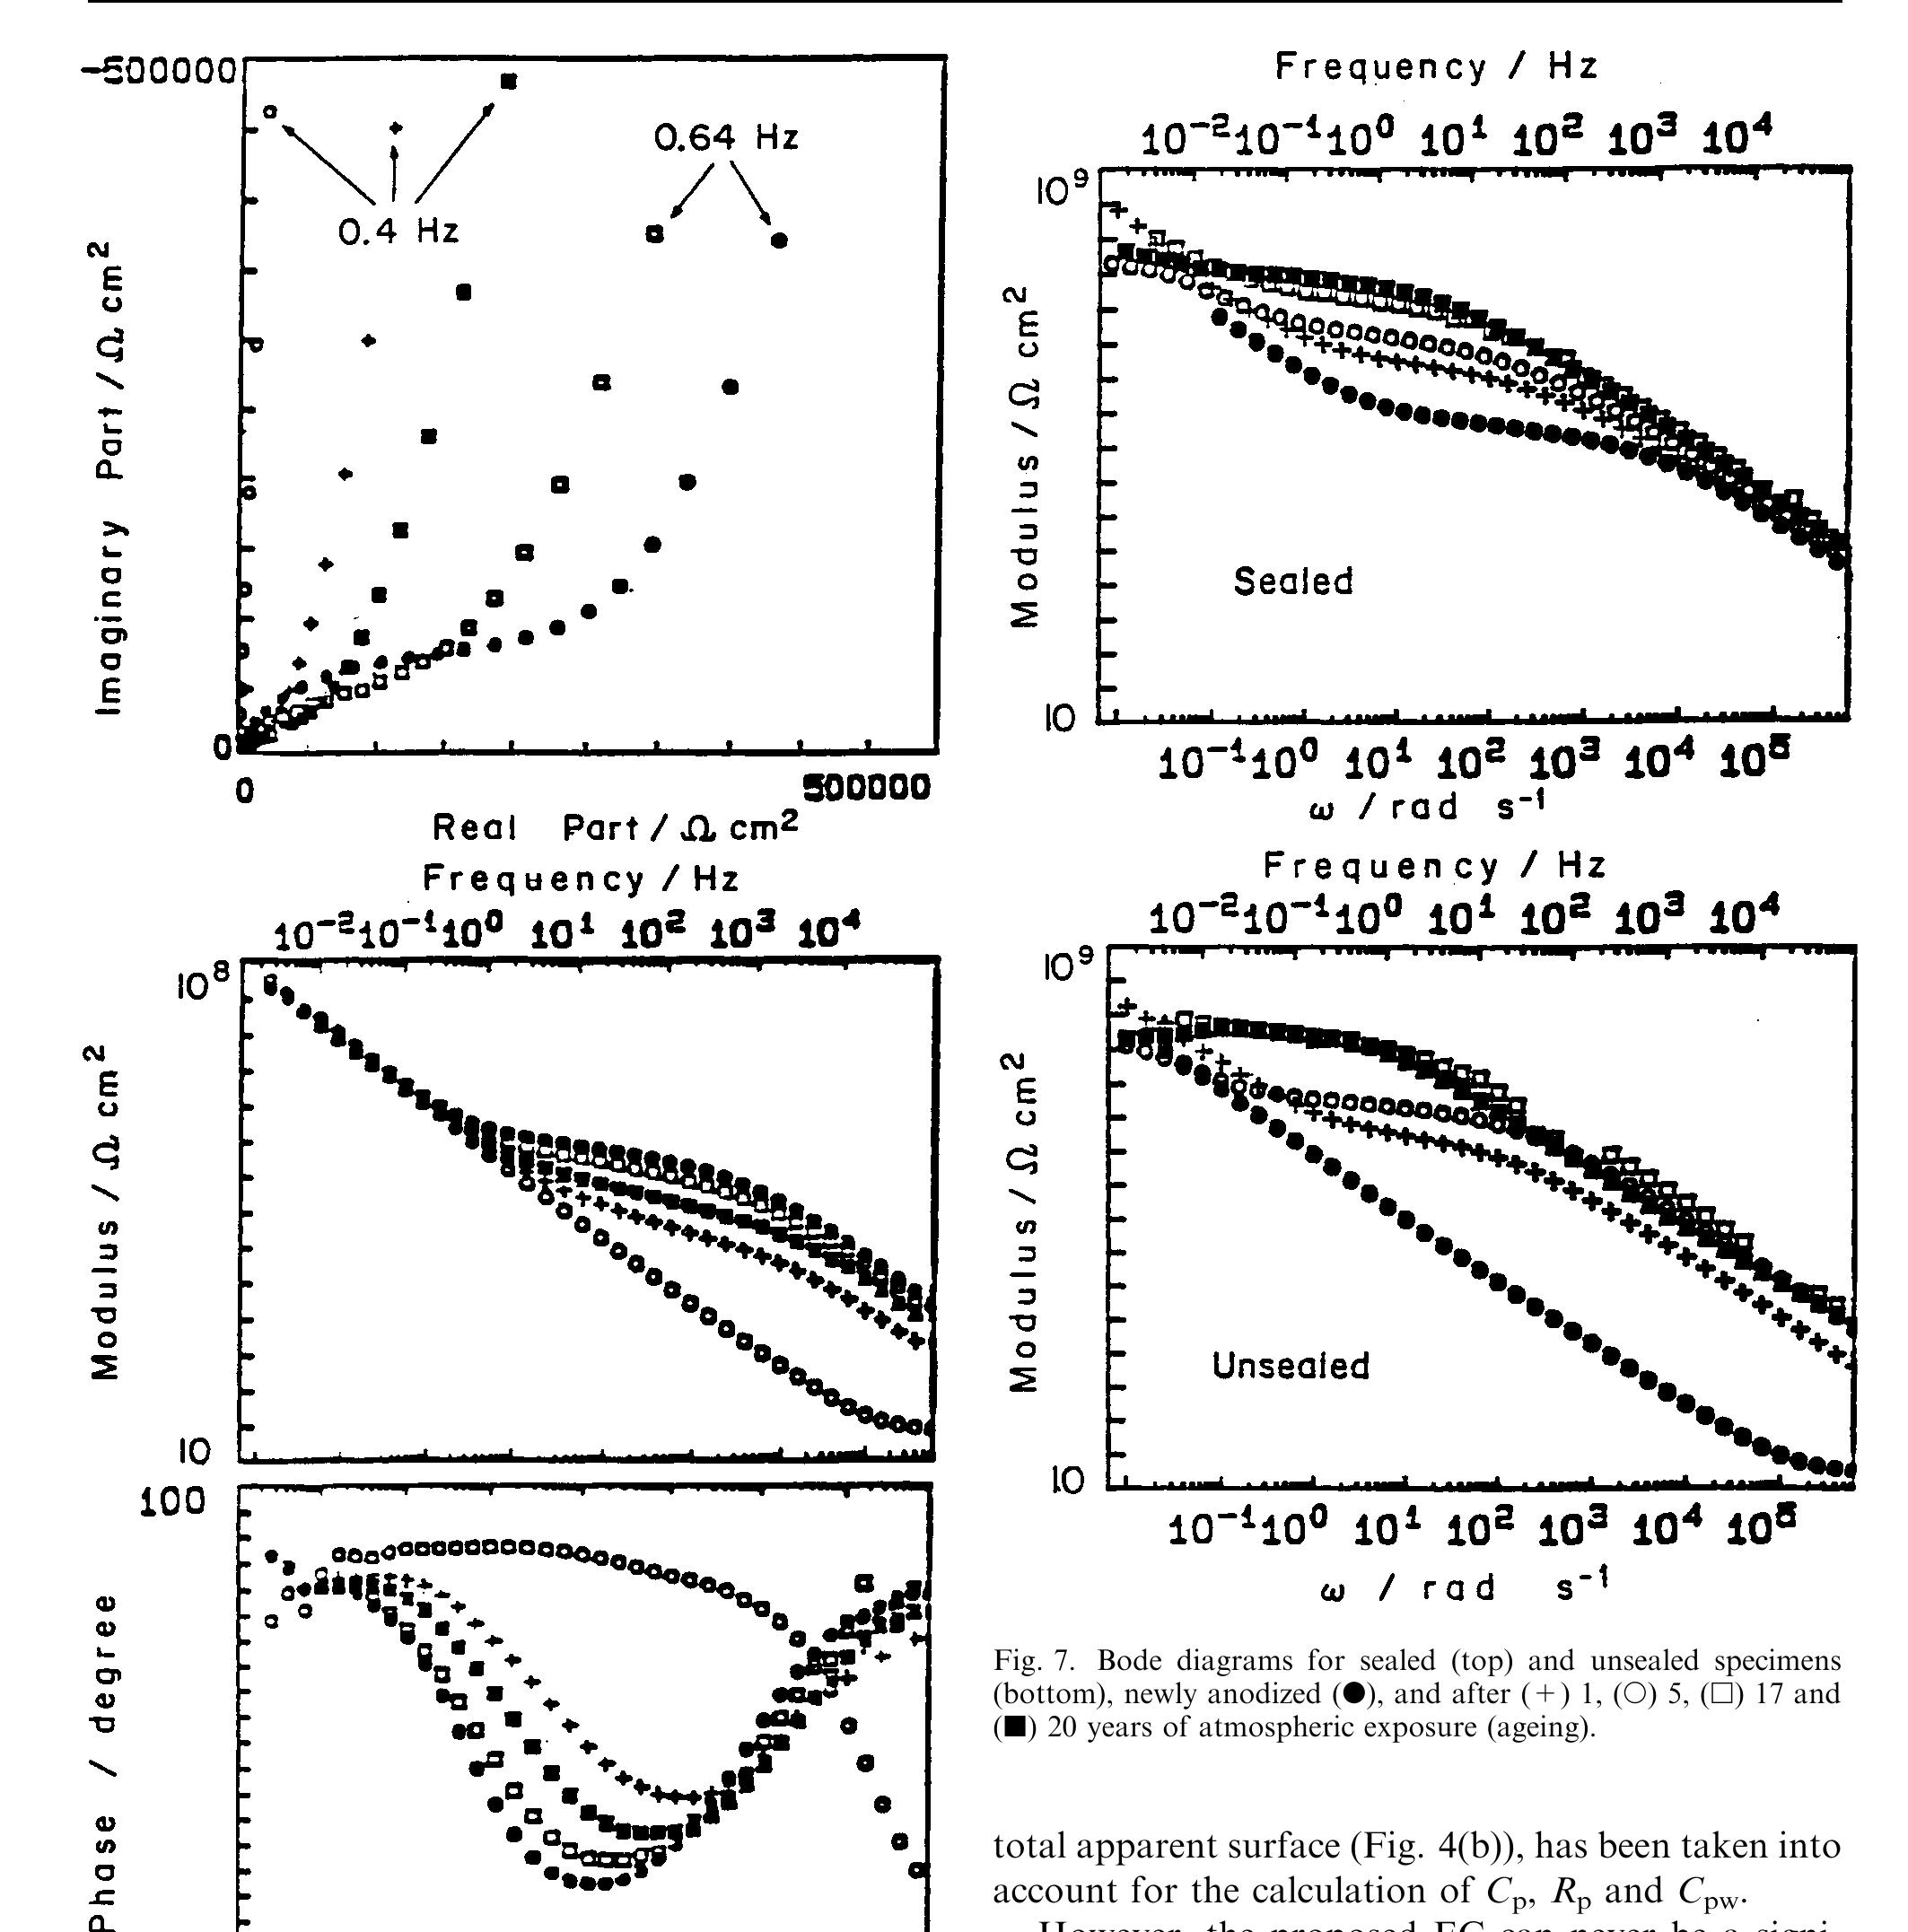
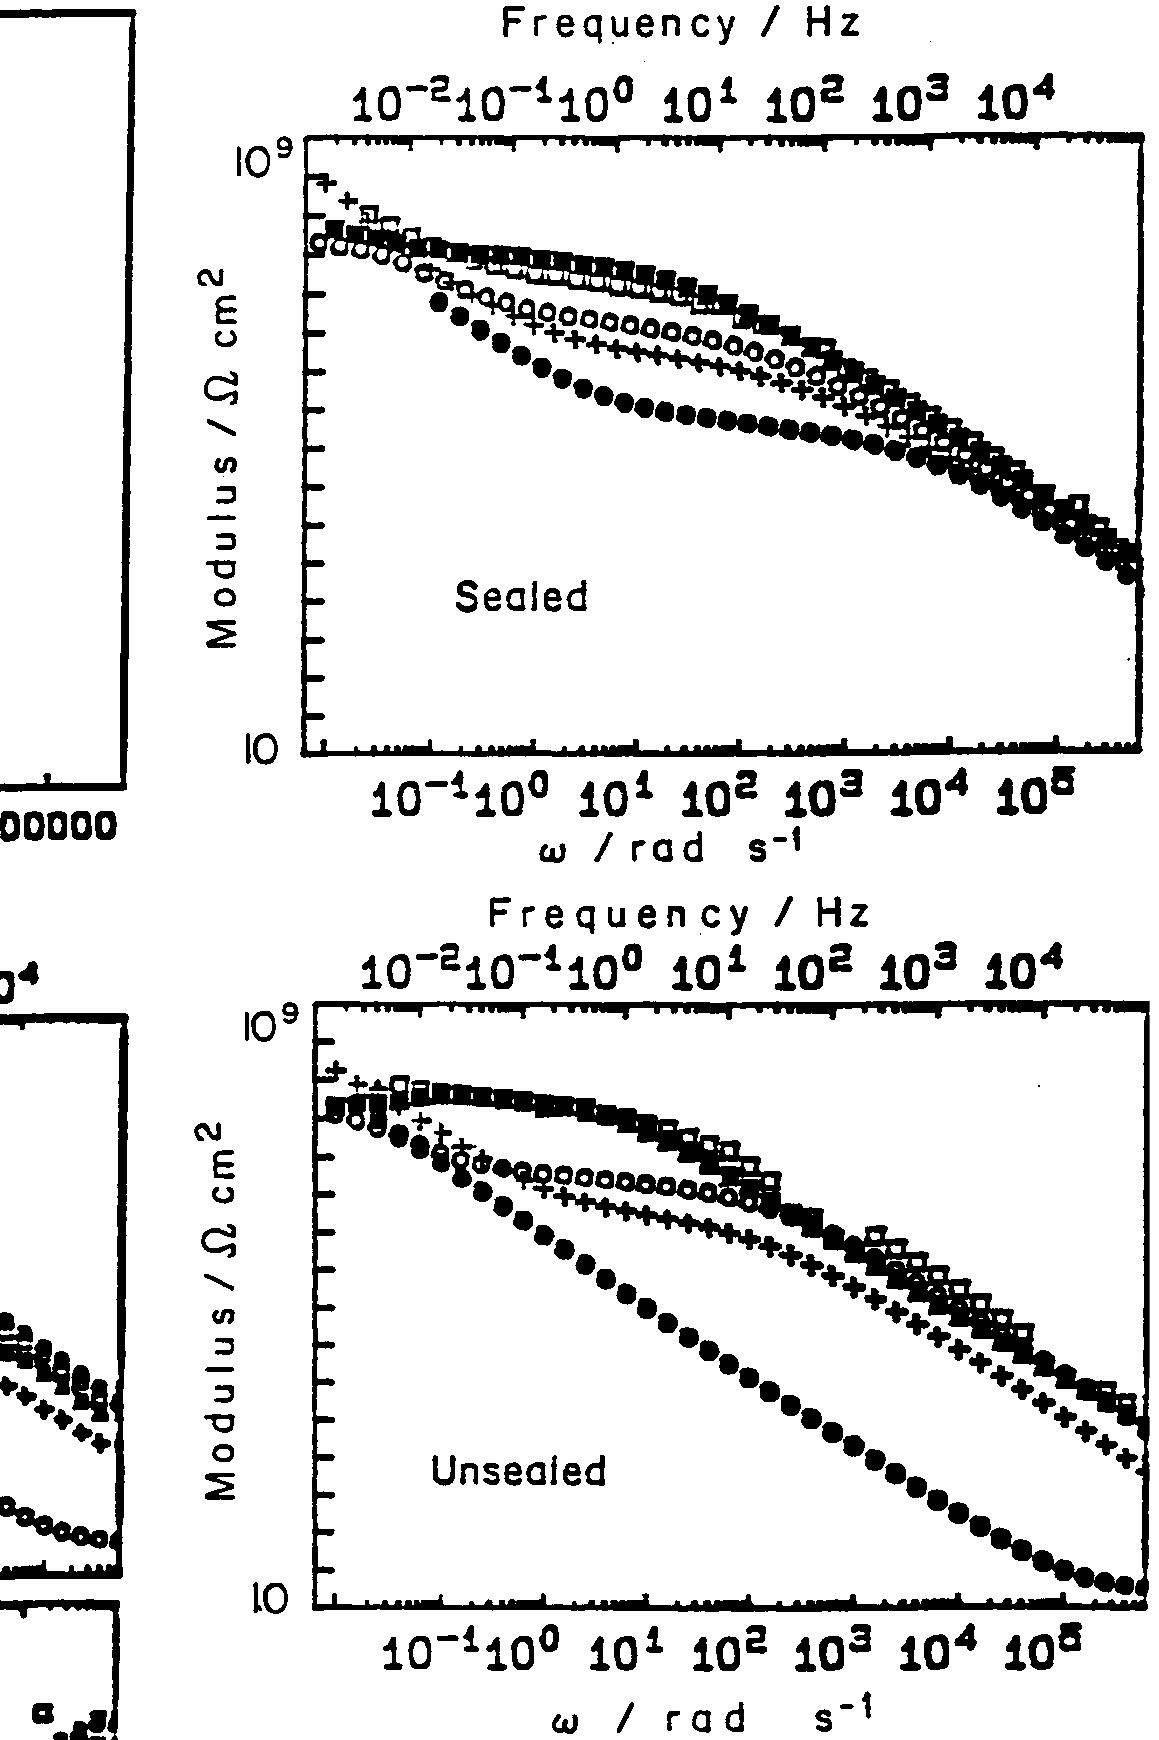
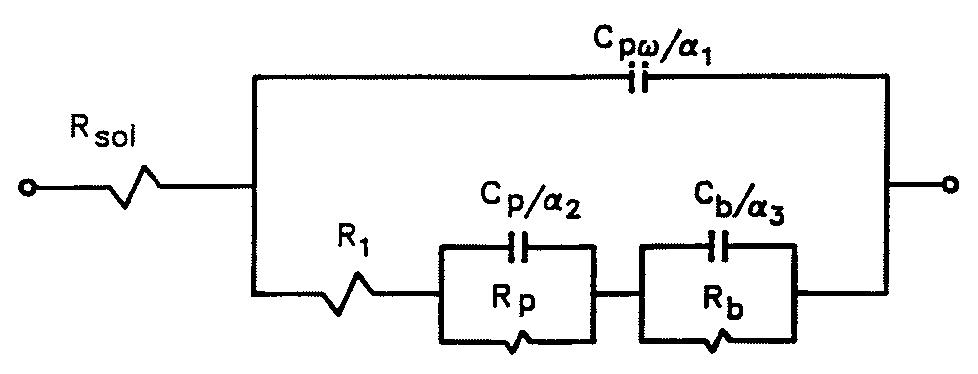
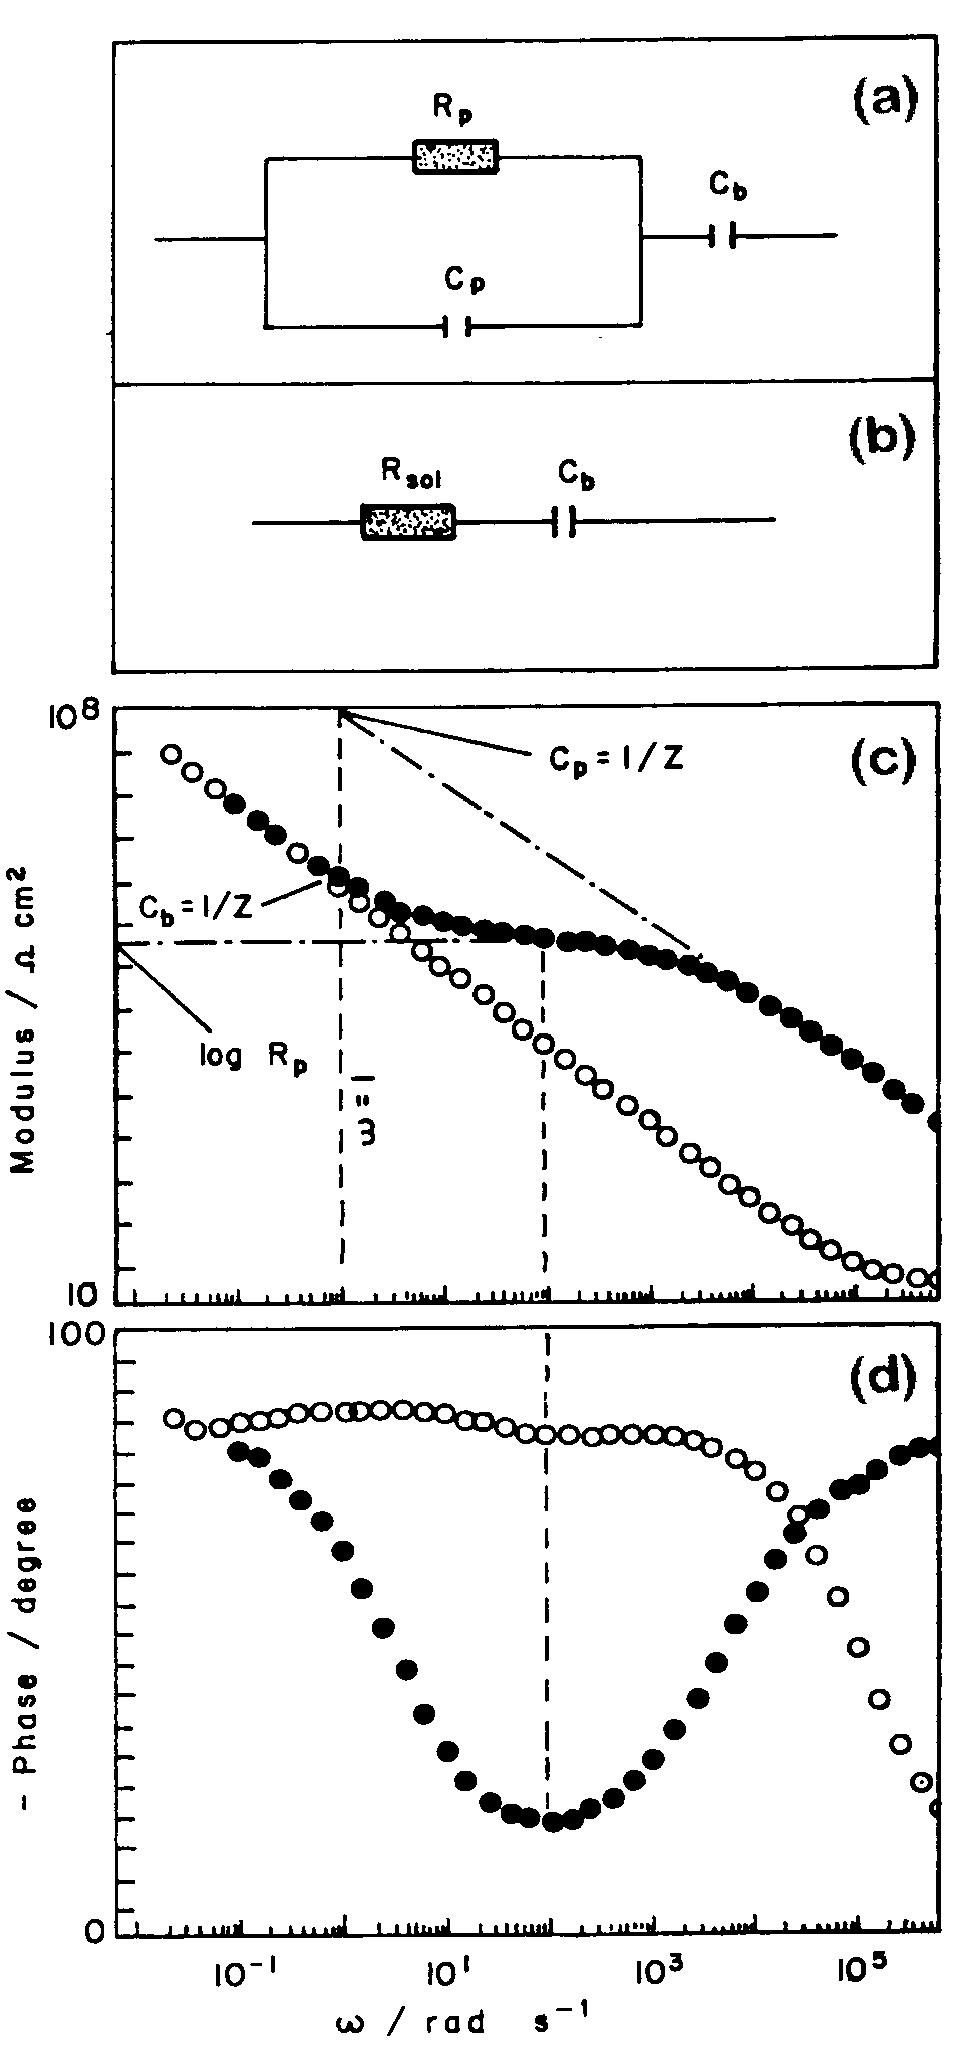
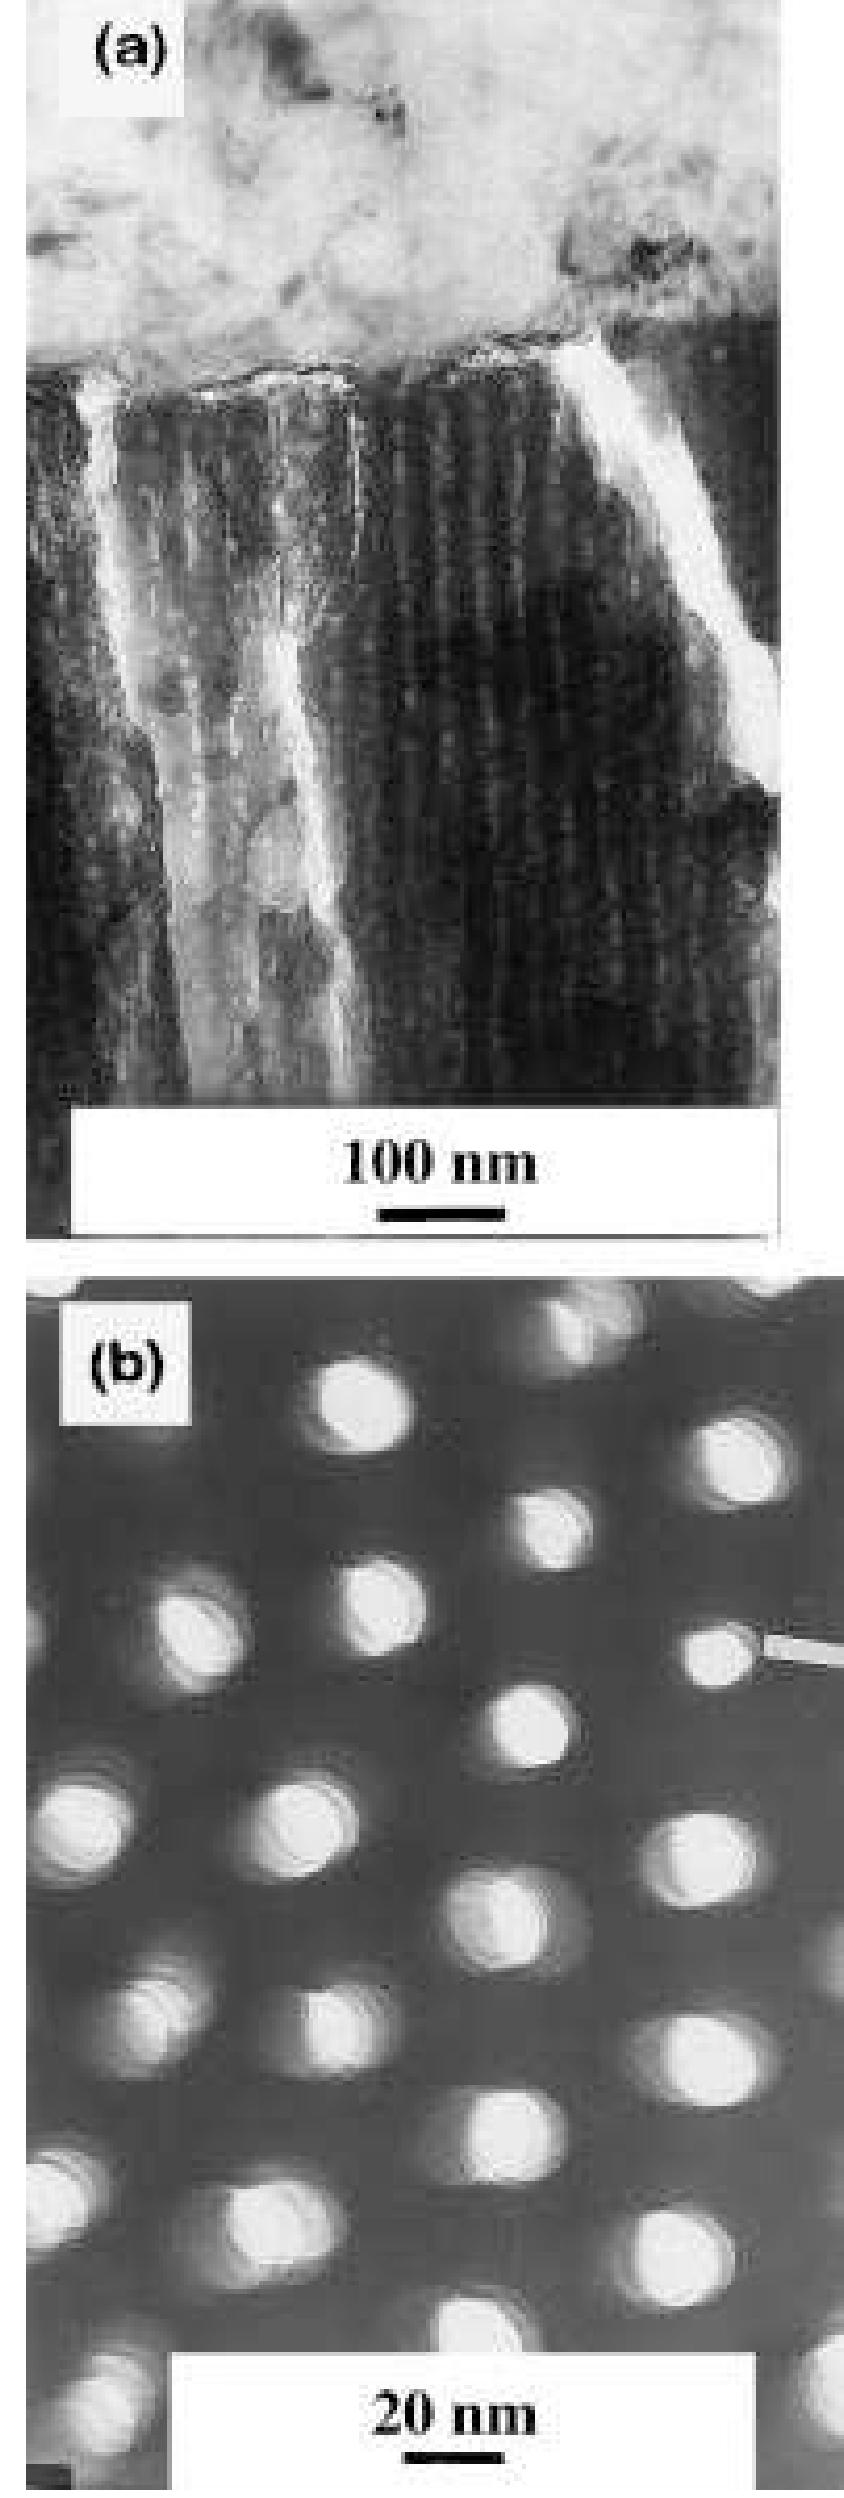
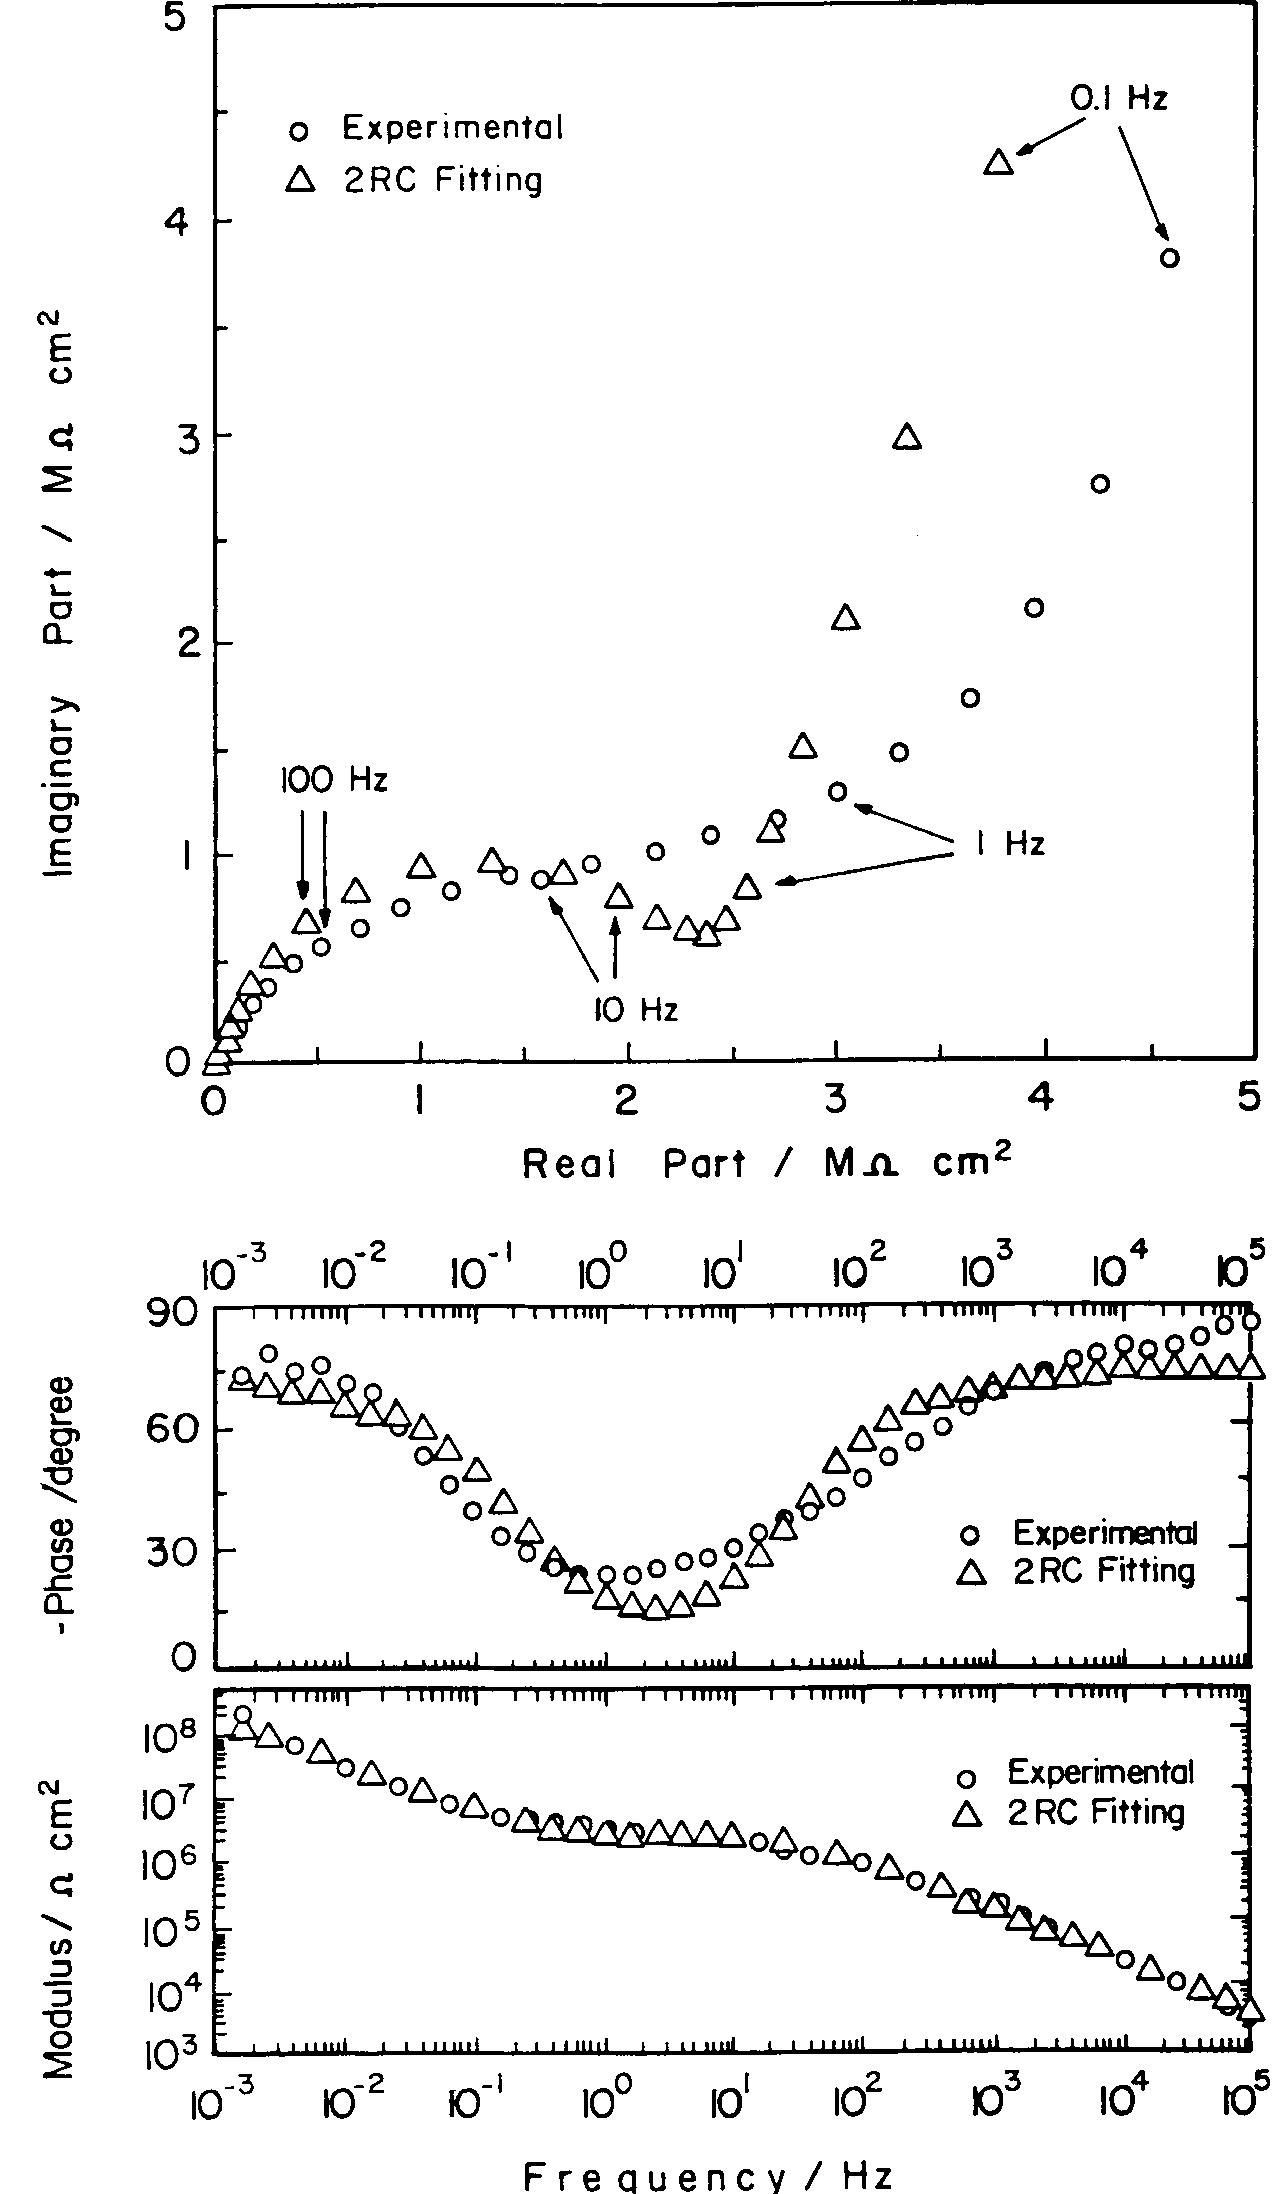
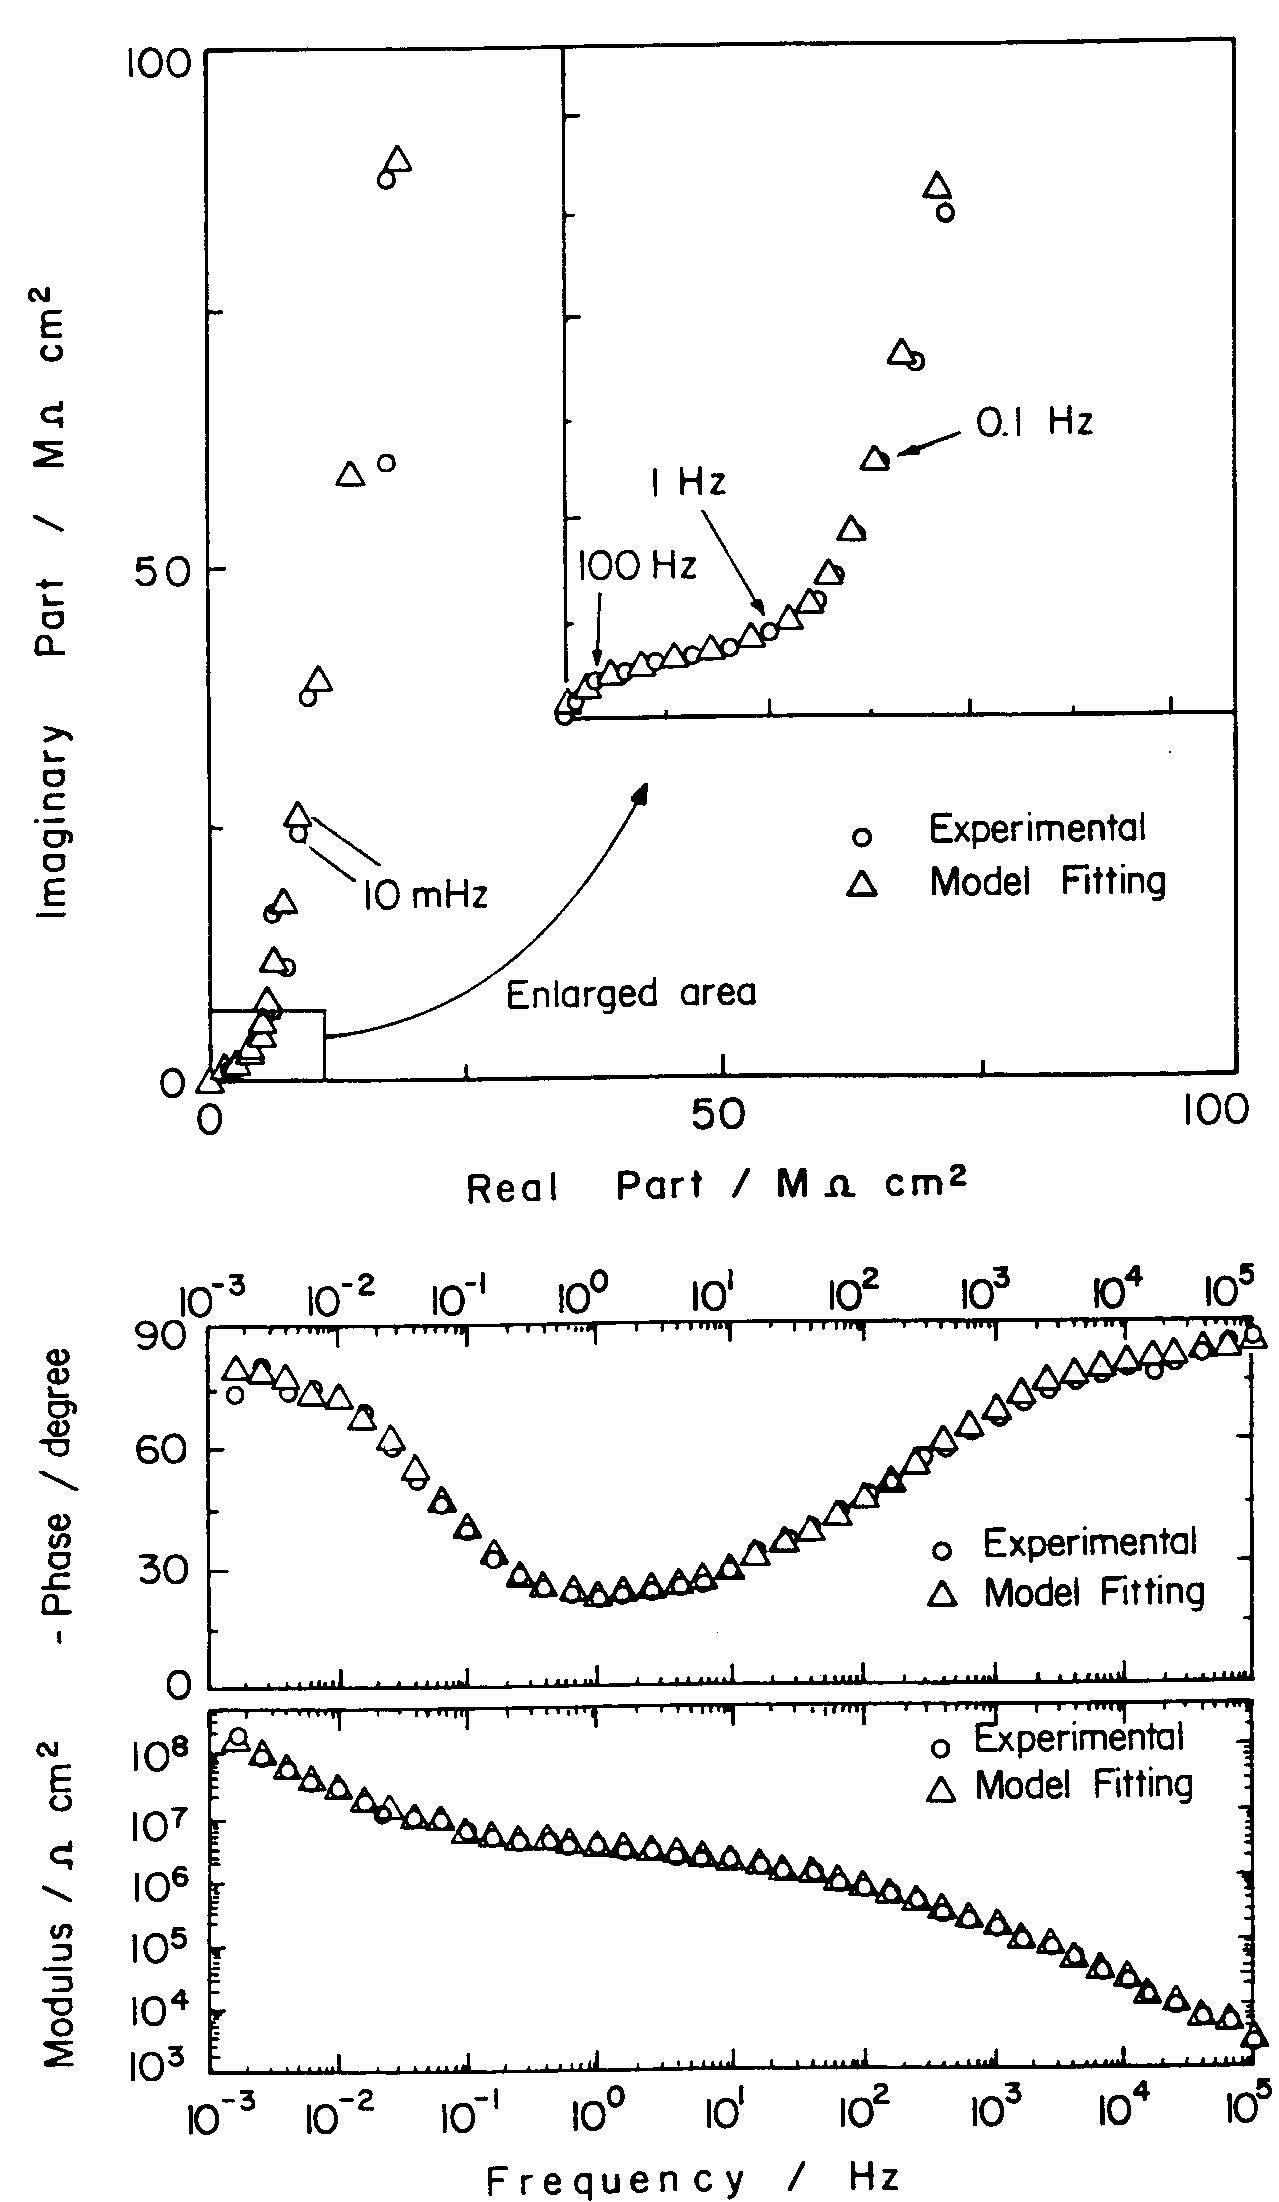
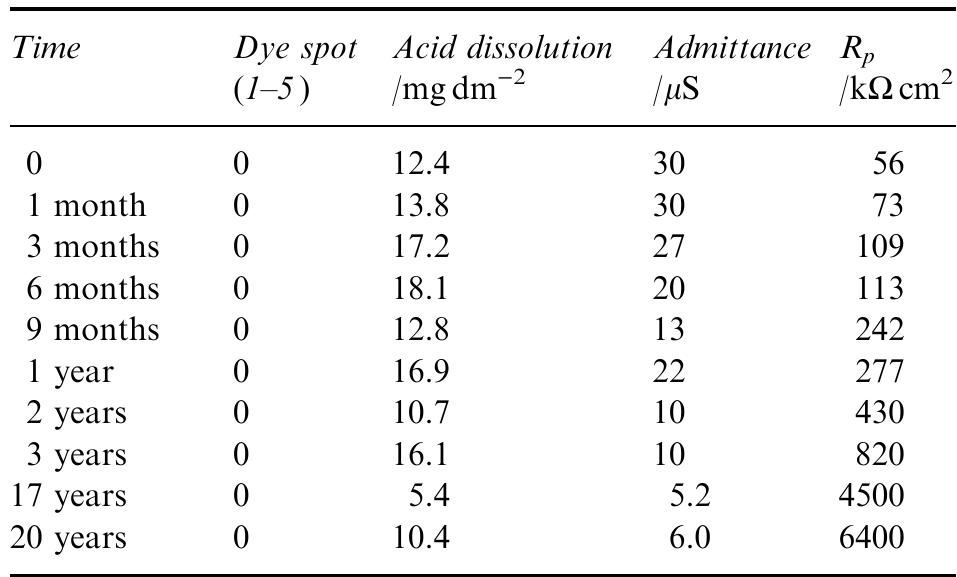
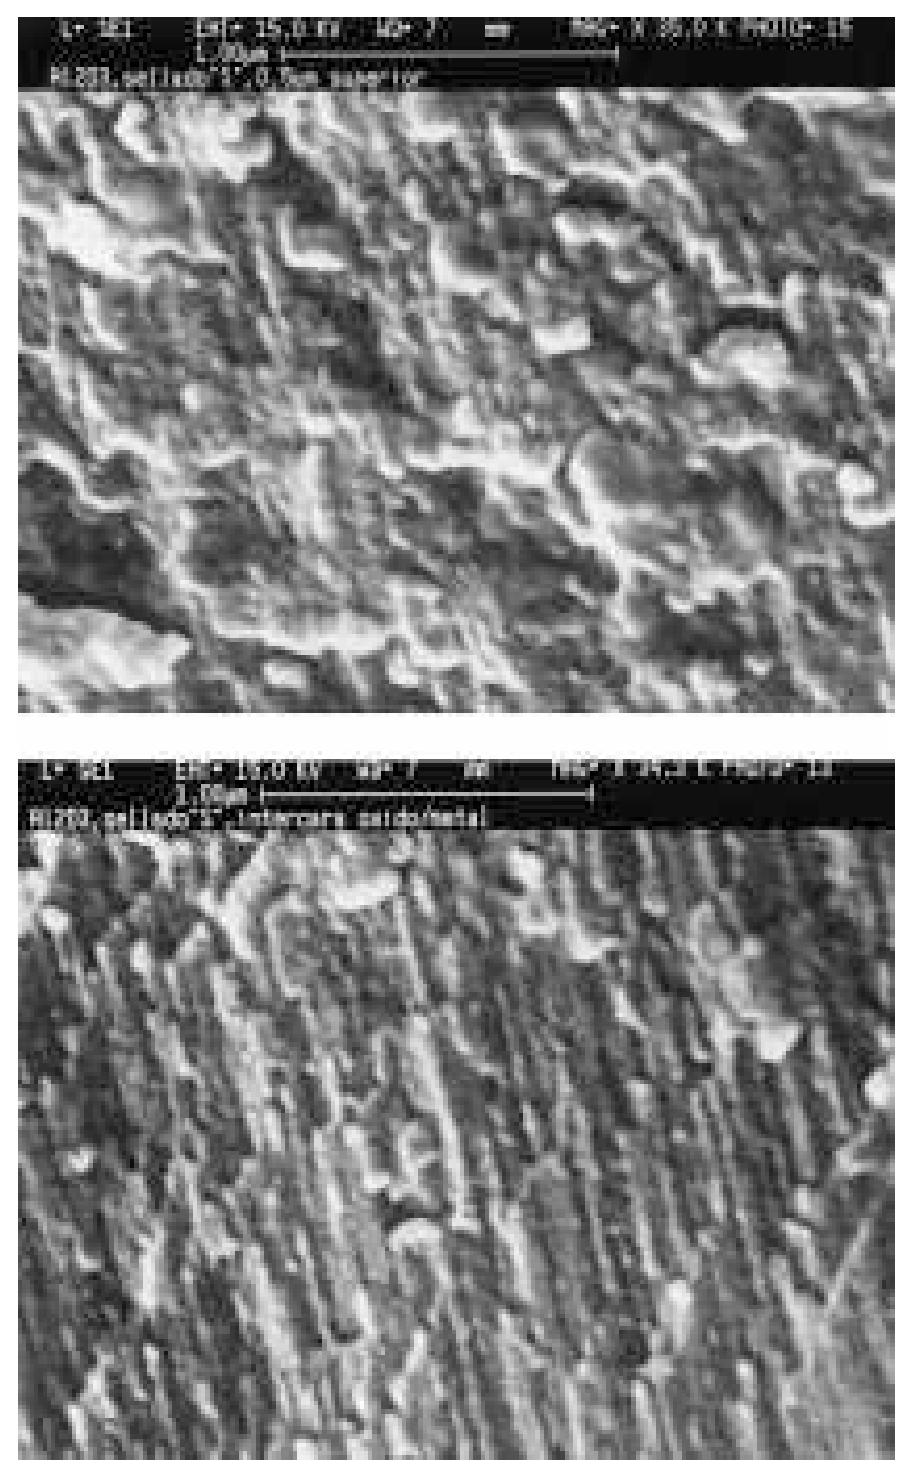
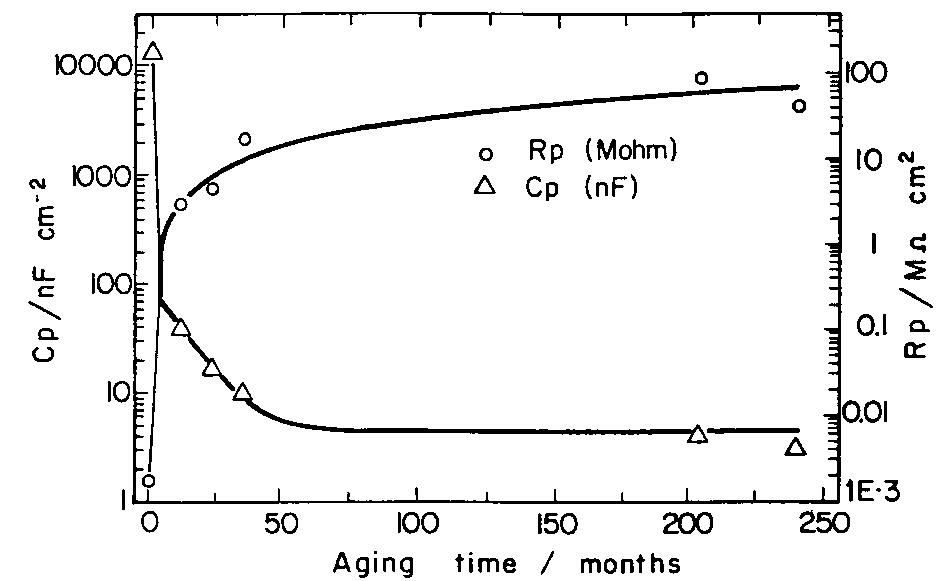
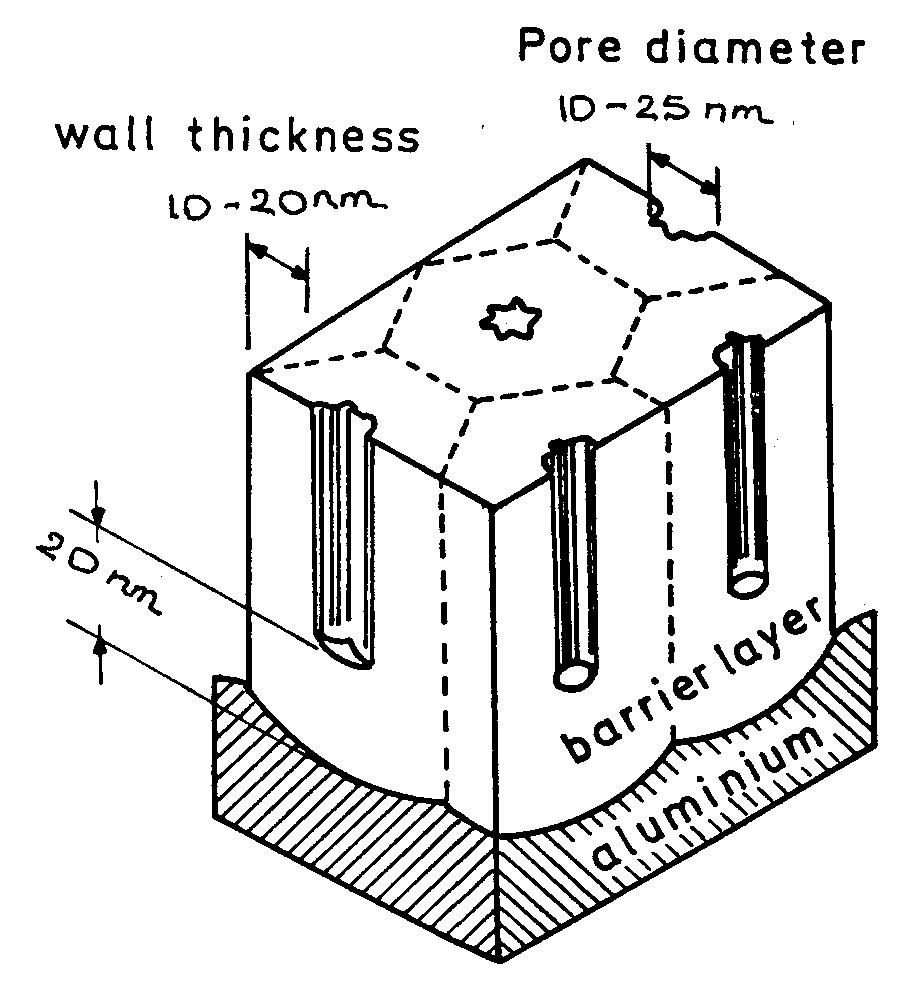
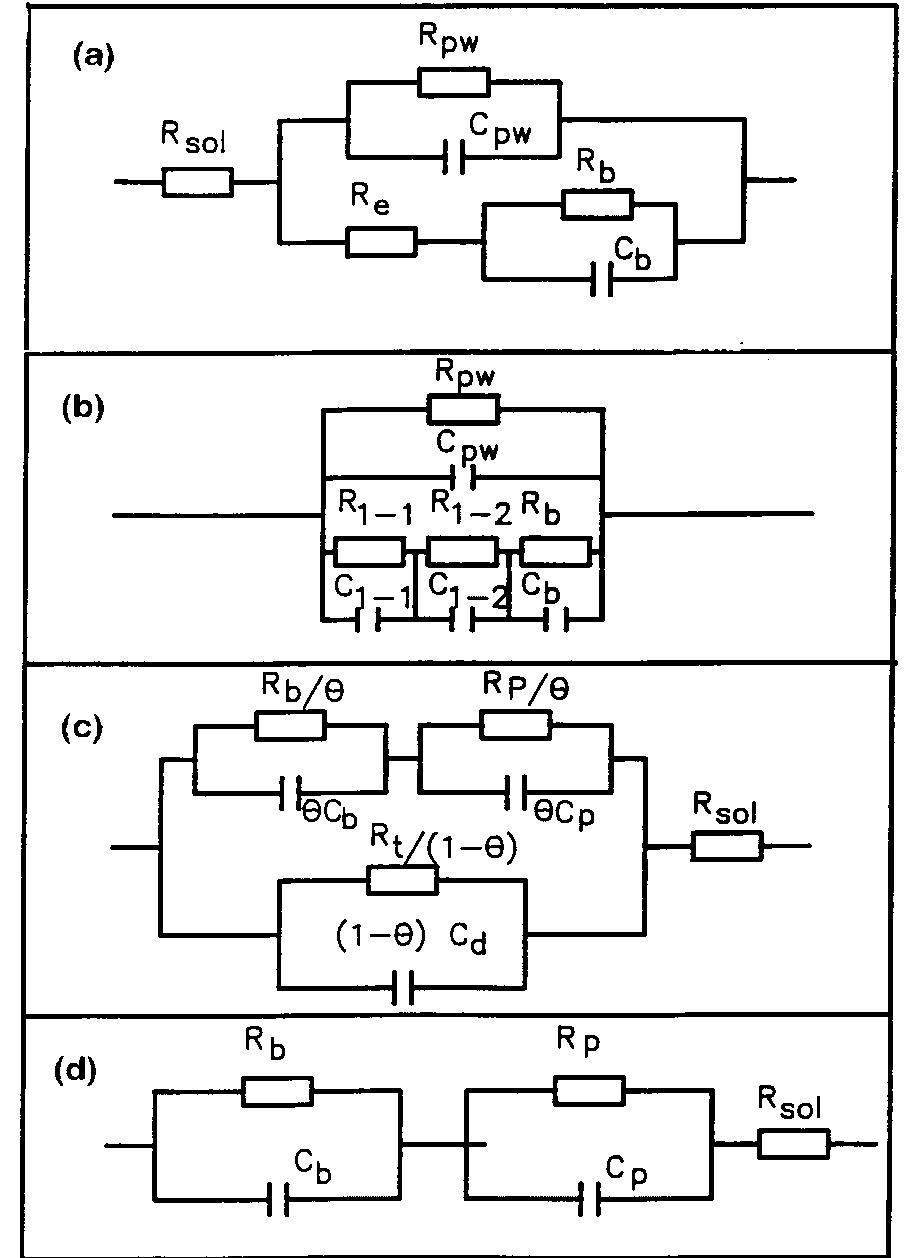
![Fig. 11. Schema of the structure of an anodized aluminium oxide film. Proposed EC is superimposed. Because the time constant results in characteristic frequencies in the nHz range (Table 1) which are dis- tant from the lowest frequency used in the tests (1 mHz), estimated (extrapolated) R, values will be highly uncertain. However, the data in Table | suggest If a permittivity of 20 for the barrier layer is also assumed, Cy values about | wF (e.g., those calculated from the impedance diagrams and given in Table 1) would lead to a barrier layer thickness of 17.7 nm. This is consistent with the result expected from the use of an anodizing voltage of 15 V (the films thus formed are widely accepted to be 1.0-1.4nmV7' thick) [3]. As can be seen from Table 1, 1000 times](https://figures.academia-assets.com/49134434/figure_012.jpg)
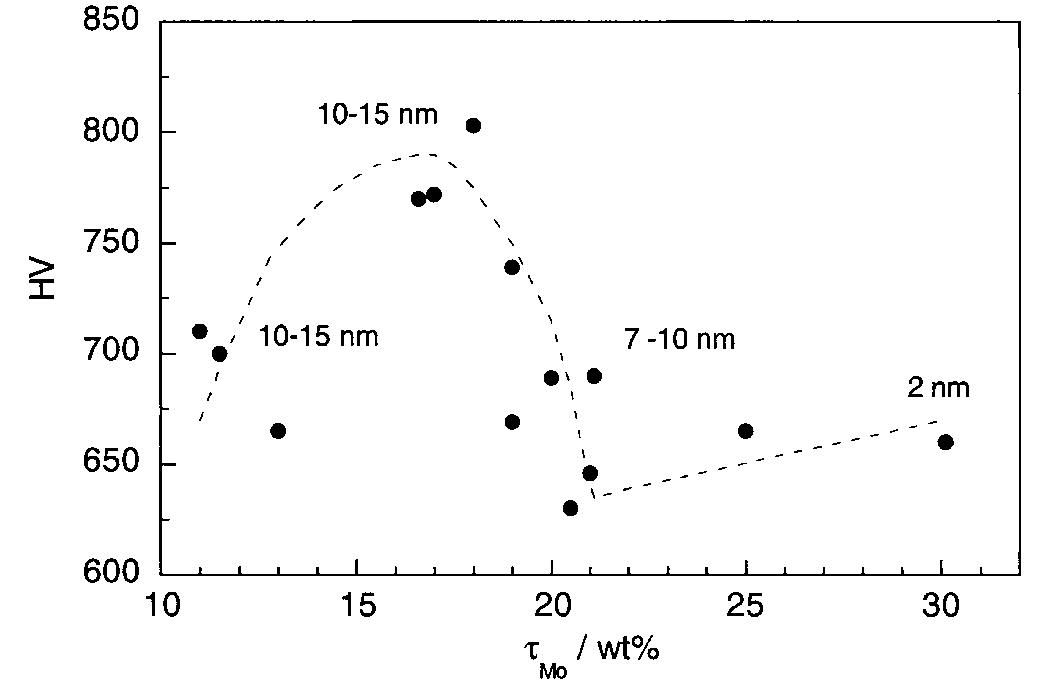
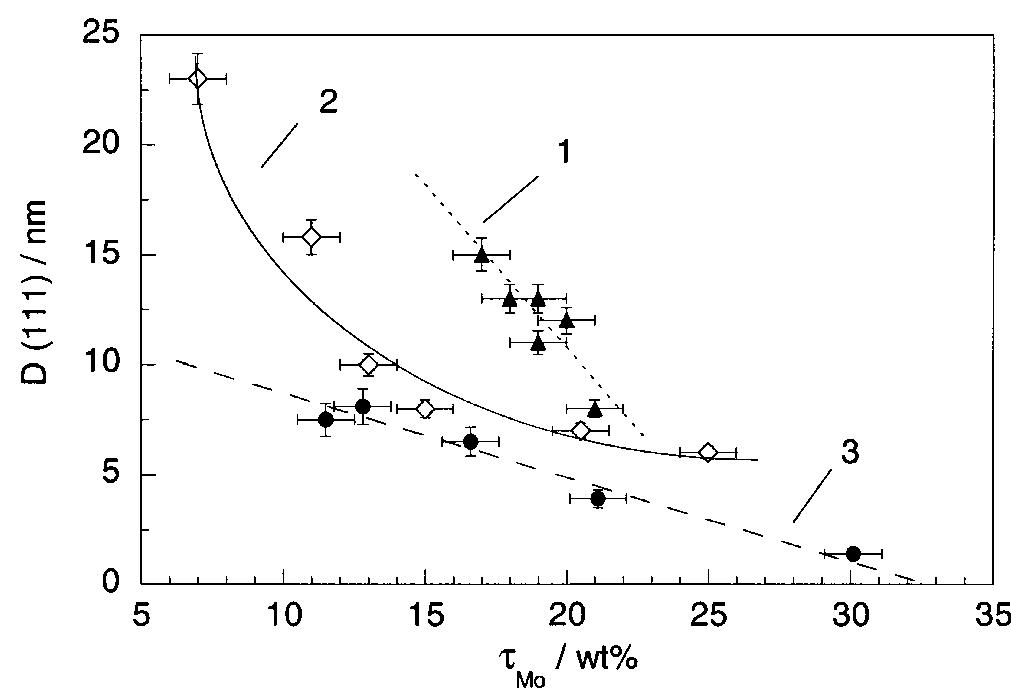
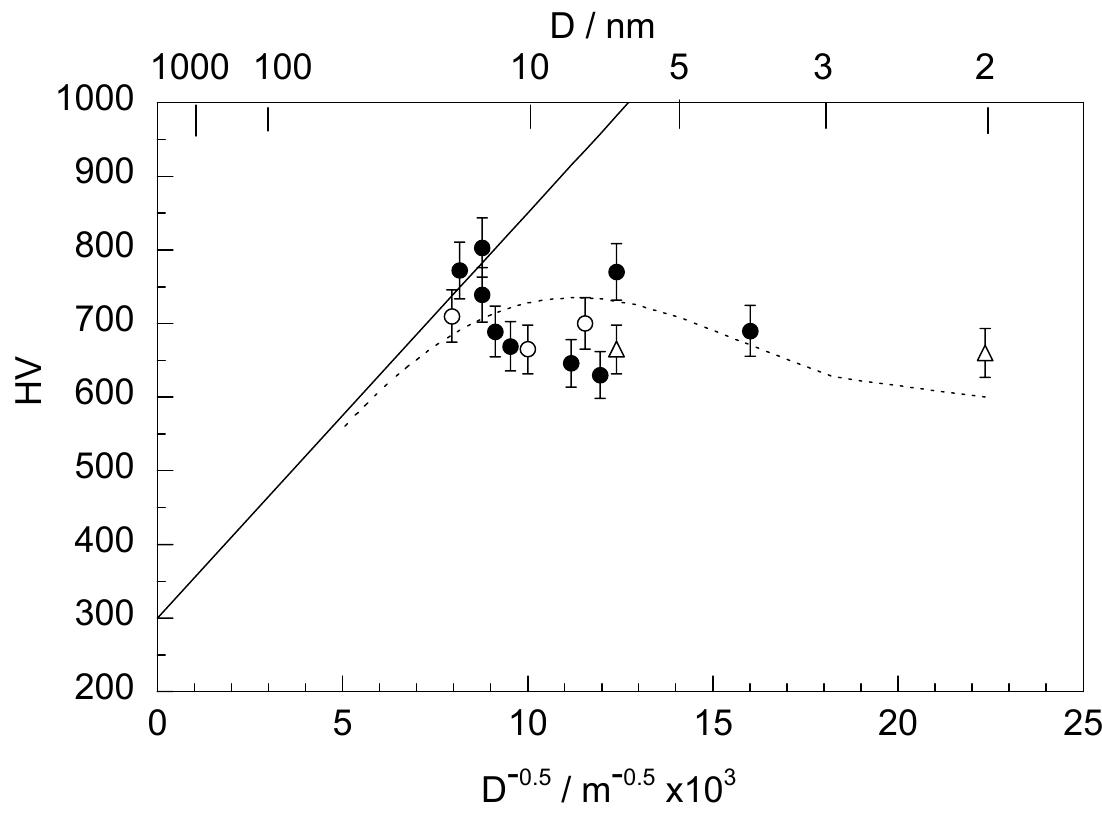
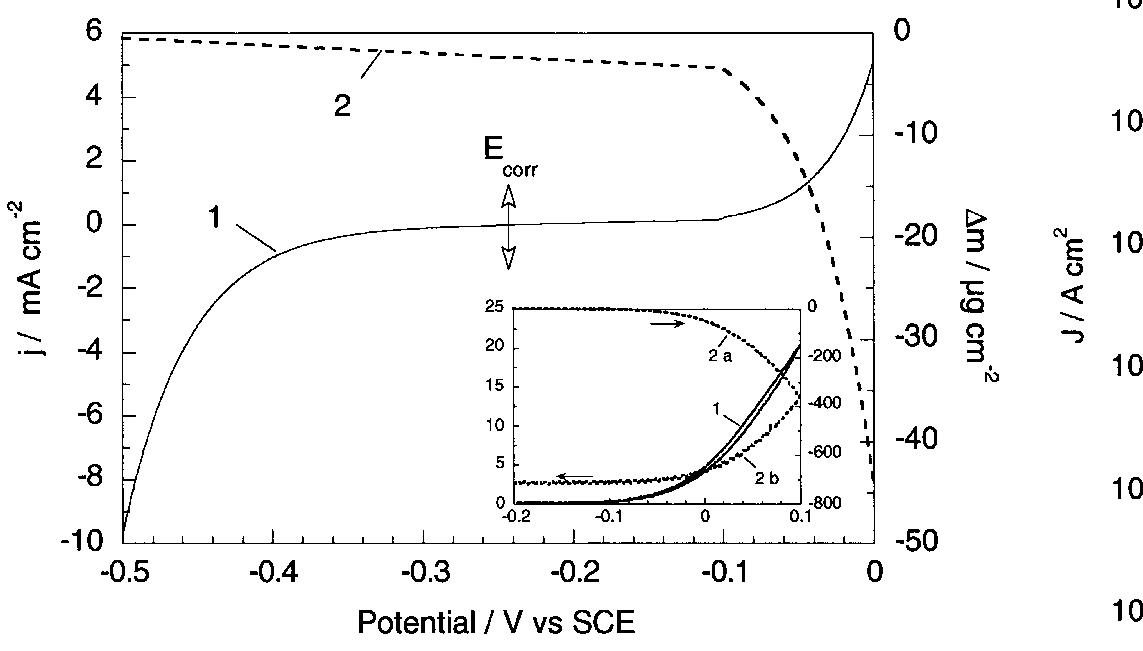
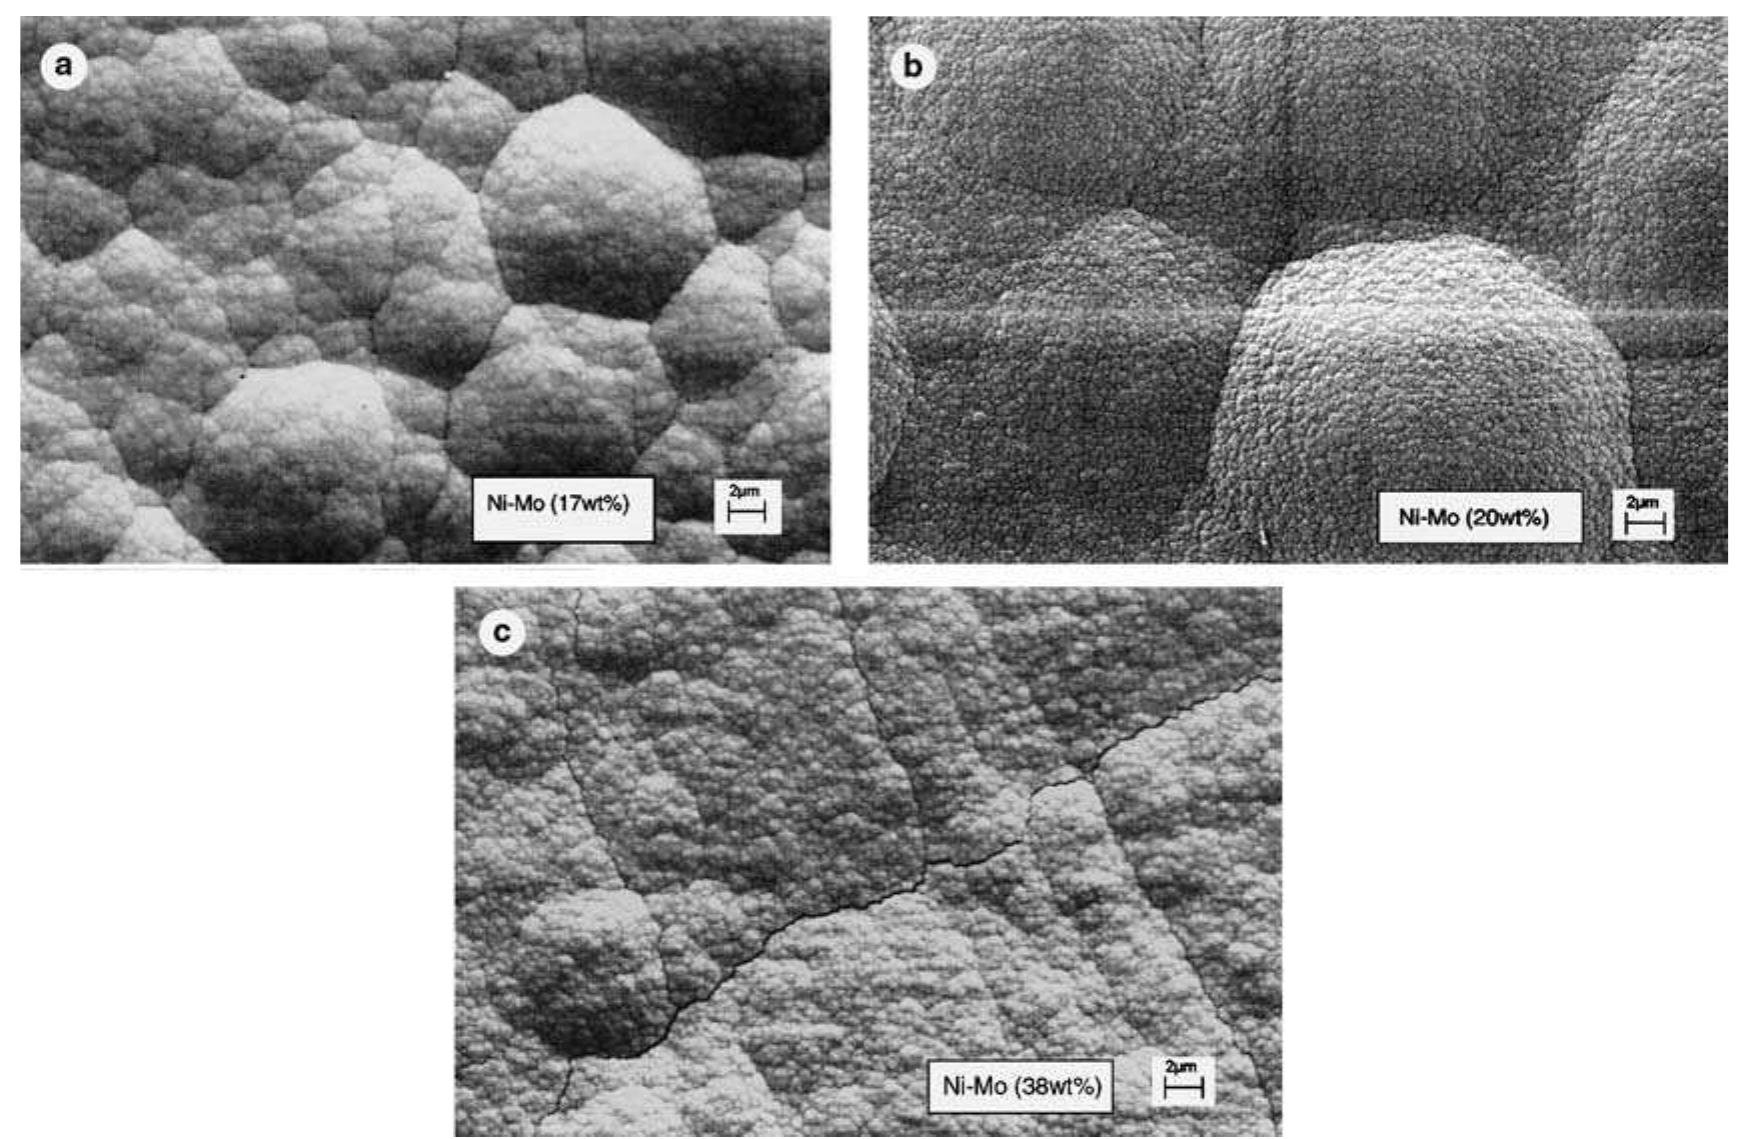
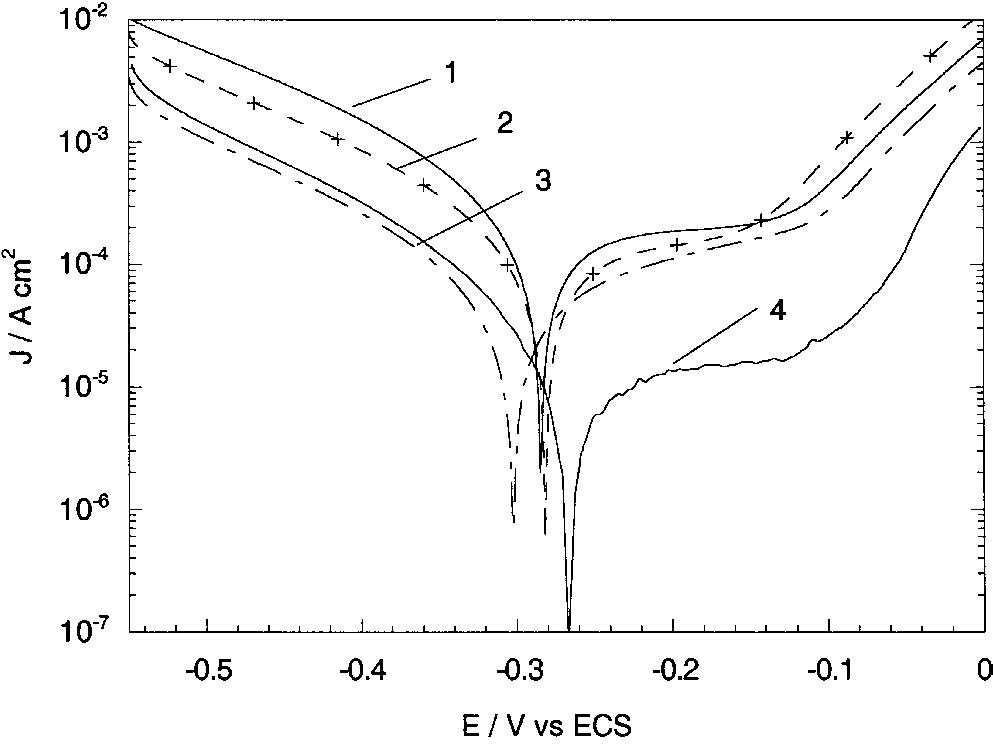
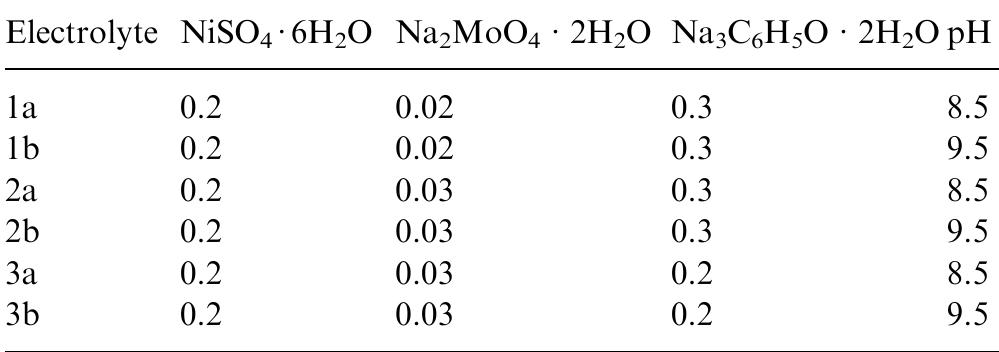
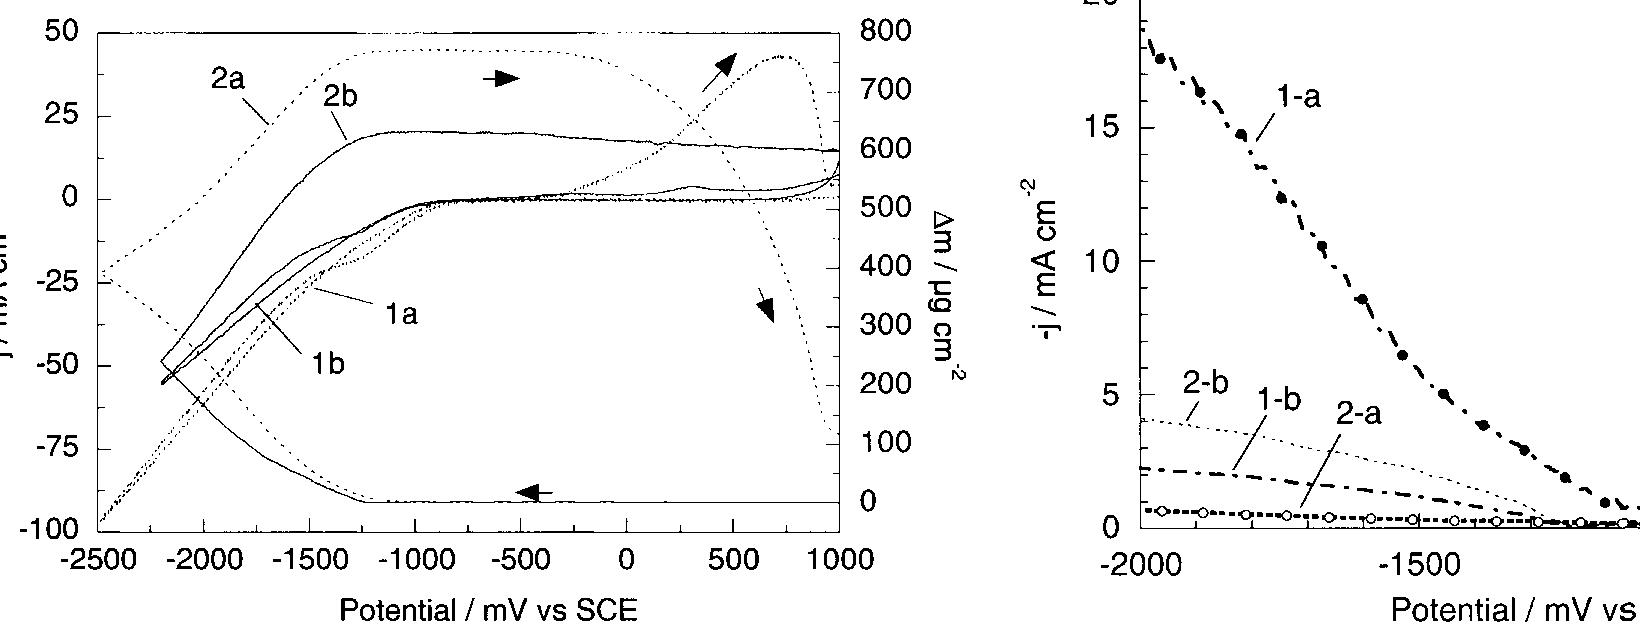
![Fig. 13. Passive behaviour as a function of molybdenum content (electrolyte 2b). Curve 1: Passivation current density, J); Curve 2: Jintrinsic = Jeb — Jp; Curve 3: Jp calculated according to [21]. Ni-Mo alloys have been electrodeposited using direct current. The grain size of the alloys decreases when the](https://figures.academia-assets.com/46698816/figure_012.jpg)