. 2022 Apr 12;8(4):393.
doi: 10.3390/jof8040393.

Faster Cryptococcus Melanization Increases Virulence in Experimental and Human Cryptococcosis

Affiliations

Faster Cryptococcus Melanization Increases Virulence in Experimental and Human Cryptococcosis

Herdson Renney de Sousa et al. J Fungi (Basel). .

Abstract

Cryptococcus spp. are human pathogens that cause 181,000 deaths per year. In this work, we systematically investigated the virulence attributes of Cryptococcus spp. clinical isolates and correlated them with patient data to better understand cryptococcosis. We collected 66 C. neoformans and 19 C. gattii clinical isolates and analyzed multiple virulence phenotypes and host-pathogen interaction outcomes. C. neoformans isolates tended to melanize faster and more intensely and produce thinner capsules in comparison with C. gattii. We also observed correlations that match previous studies, such as that between secreted laccase and disease outcome in patients. We measured Cryptococcus colony melanization kinetics, which followed a sigmoidal curve for most isolates, and showed that faster melanization correlated positively with LC3-associated phagocytosis evasion, virulence in Galleria mellonella and worse prognosis in humans. These results suggest that the speed of melanization, more than the total amount of melanin Cryptococcus spp. produces, is crucial for virulence.

Keywords: Cryptococcus neoformans; Galleria mellonella; LC3-associated phagocytosis; capsule; cryptococcosis; extracellular vesicles; melanin; virulence.


Conflict of interest statement

The authors have declared that no conflict of interest exists.

Figures

Figure 1
Figure 1
Melanization kinetics of and laccase production by Cryptococcus spp. clinical isolates. (AD) Histograms showing the distribution of the melanization kinetics parameters from clinical isolates. Images of each colony taken throughout 168 h of incubation in melanizing medium were processed and fitted to sigmoidal curves to obtain: (A) tHMM—time in hours for the colony to reach half maximum melanization; (B) melanization Top—median gray level of the colony at the end of the experiment, which indicates how dark the colony became; (C) melanization Span (difference in median gray levels of the colony at the beginning and end of the experiment); (D) melanization Slope (slope of the sigmoidal curve at the inflection point, an expression of how fast the colony melanizes. (E,F) Histograms showing the specific secreted and whole-cell laccase activity from clinical isolates. Experiments were repeated at least twice and had similar results. Frequency distribution of secreted laccase activity, n = 82 and (F) frequency distribution of whole-cell laccase activity, n = 84.
Figure 2
Figure 2
Capsule size of and GXM secretion by clinical isolates. (A) Frequency distribution of the capsule thickness in Sabouraud medium (Sab), n = 48. (B) Representative photo of isolates at both ends of the capsule thickness distribution, CNF001.1 isolate less than 1 µm thick and CGF005 isolate greater than 5 µm. (C) Frequency distribution of capsule induction in CO2-independent medium (CIM) relative to Sabouraud (CIM/Sabouraud), n = 47. (D) Representative photo of isolates at both ends of the relative distribution, isolate CGB009.1, which maintained the same capsule thickness in both media, and isolate CNF016, whose capsule was about three times larger in Sab-MOPS media (n = 48) and (E) frequency distribution of capsule induction in Sab-MOPS relative to Sabouraud (Sab-MOPS/Sabouraud). (F) Frequency distribution of capsule induction in minimum medium (MM) relative to Sabouraud (MM/Sabouraud), n = 48. (G) Frequency distribution of secreted GXM concentration, n = 46. Experiments were repeated at least twice and had similar results. Scale bars in all panels are 5 µm.
Figure 3
Figure 3
Interaction of clinical isolates with macrophages in LC3-associated phagocytosis (LAP). Representative photo of the autophagy assessment by immunofluorescence, measured by means of LAP. (A) Clinical isolate CNB020 with low LAP induction and CNB042 with high LAP induction, as examples. (B) Frequency distribution of the proportion of J774 cells in which all phagocytosed fungi were contained within LC3-positive phagosomes among all macrophages with at least one internalized yeast cell, n = 24. Experiments were repeated at least twice in different days and had similar results. Scale bar: 10 µm.
Figure 4
Figure 4
Differences in melanization, laccase production and capsule thickness between C. neoformans and C. gattii clinical isolates. (A–D) Differences in tHMM (time for half-maximum melanization); melanization Hill Slope (slope of the sigmoidal curve at the inflection point, proportional to how fast the colony melanizes); melanization Span (difference in median gray levels of the colony at the beginning and end of the experiment—difference between top and bottom) and melanization Top (median gray level of the colony image at the end of the experiment—proportional to how dark the colony turned), C. gattii, n = 19 and C. neoformans n = 60. (E,F) Differences in secreted laccase activity (C. gattii, n = 18; C. neoformans, n = 64) and whole-cell laccase activity (C. gattii, n = 19; C. neoformans, n = 65). (G) Capsule thickness in Sabouraud medium (Sab) ratio with H99. (H–J) Capsule induction in Sab-MOPS, minimum medium (MM) and CO2-independent medium relative to Sabouraud (C. gattii, n = 16; C. neoformans, n = 32). Experiments were repeated at least twice and had similar results. To compare the groups, we used a two-tailed t-test for independent samples.
Figure 5
Figure 5
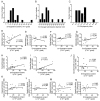
Extracellular vesicles (EVs) from clinical isolates. EV preparations were measured by dynamic light scattering (DLS). (A) Frequency distribution of the sterol quantification, an indirect measurement of the amount of vesicles secreted per cell. (B) Frequency distribution of the hydrodynamic diameter (intensity) and (C) frequency distribution of the polydispersity index. (D) Correlation between EV-ergosterol content and the melanization score. (E) Correlation between EV-ergosterol content and tHMM (represents the speed of melanization index from non-linear regression curve of median gray value). (F) No correlation between EV-ergosterol content with melanization Top (maximum melanization index from non-linear regression curve of median gray value) or (G) melanization Span (difference in median gray levels of the colony at the beginning and end of the experiment—difference between top and bottom). (H) Correlation between EV-ergosterol content with cell-wall laccase activity and (I) secreted laccase activity. (J) No correlation between EV-ergosterol content and secreted GXM concentration. (K) Correlation between EV-ergosterol content and capsule thickness in Sabouraud (Sab) medium. (L) No correlation between EV-ergosterol content with capsule induction in medium Sab-MOPS, (M) capsule induction in minimal medium and (N) capsule induction in CO2-independent medium. All samples (n = 18) were analyzed in duplicate and under the same conditions. All correlations were made with Spearman rank.
Figure 6
Figure 6
Melanization kinetics affect the ability of clinical isolates to escape from LC3-associated phagocytosis in J774 cells. (A) Correlation between LC3-associated phagocytosis with tHMM (represents the speed of melanization index from non-linear regression curve of median gray value), (B) with melanization Top (maximum melanization index from non-linear regression curve of median gray value), (C) with melanization Span (difference in median gray levels of the colony at the beginning and end of the experiment—difference between top and bottom) and (D) no correlation with secreted laccase activity. All correlations were made with Spearman rank (n = 23).
Figure 7
Figure 7
G. mellonella survival after infection with different C. neoformans isolates. (A) Survival curves of G. mellonella infected with clinical isolates. In this experimental batch, all isolates were C. neoformans of the molecular type VNI. (B) Frequency distribution of the median survival G. mellonella infected with clinical isolates (n = 46). Twelve larvae were infected per isolate.

References

    1. Rajasingham R., Smith R.M., Park B.J., Jarvis J.N., Govender N.P., Chiller T.M., Denning D., Loyse A., Boulware D. Global burden of disease of HIV-associated cryptococcal meningitis: An updated analysis. Lancet Infect. Dis. 2017;17:873–881. doi: 10.1016/S1473-3099(17)30243-8. - DOI - PMC - PubMed
    1. Kwon-Chung K.J., Bennett J.E., Wickes B.L., Meyer W., Cuomo C.A., Wollenburg K.R., Bicanic T.A., Castañeda E., Chang Y.C., Chen J., et al. The Case for Adopting the “Species Complex” Nomenclature for the Etiologic Agents of Cryptococcosis. mSphere. 2017;2:e00357-16. doi: 10.1128/mSphere.00357-16. - DOI - PMC - PubMed
    1. Perfect J.R., Dismukes W.E., Dromer F., Goldman D.L., Graybill J.R., Hamill R.J., Harrison T.S., Larsen R.A., Lortholary O., Nguyen M.-H., et al. Clinical Practice Guidelines for the Management of Cryptococcal Disease: 2010 Update by the Infectious Diseases Society of America. Clin. Infect. Dis. 2010;50:291–322. doi: 10.1086/649858. - DOI - PMC - PubMed
    1. Lin X., Heitman J. The Biology of the Cryptococcus neoformans Species Complex. Annu. Rev. Microbiol. 2006;60:69–105. doi: 10.1146/annurev.micro.60.080805.142102. - DOI - PubMed
    1. Chang Y.C., Kwon-Chung K.J. Complementation of a capsule-deficient mutation of Cryptococcus neoformans restores its virulence. Mol. Cell. Biol. 1994;14:4912–4919. doi: 10.1128/mcb.14.7.4912. - DOI - PMC - PubMed

LinkOut - more resources