. 2020 Jul 31;369(6503):eaba3373.
doi: 10.1126/science.aba3373.

Structural insights into differences in G protein activation by family A and family B GPCRs

Affiliations

Structural insights into differences in G protein activation by family A and family B GPCRs

Daniel Hilger et al. Science. .

Abstract

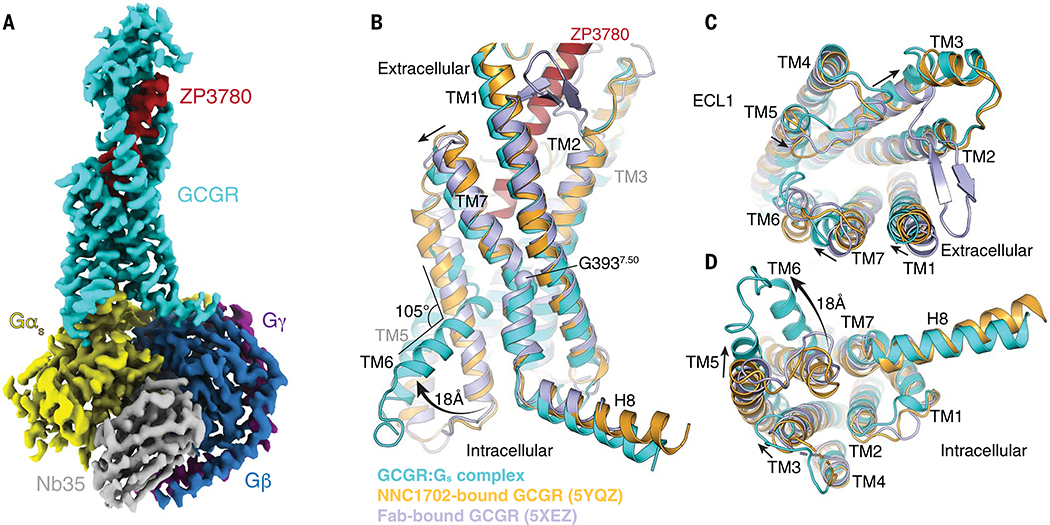
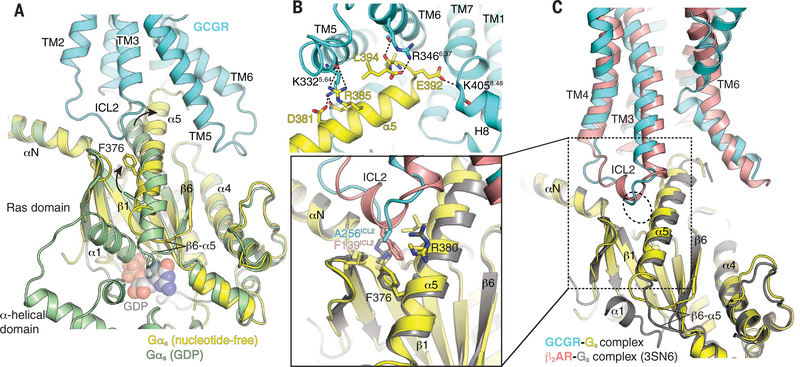
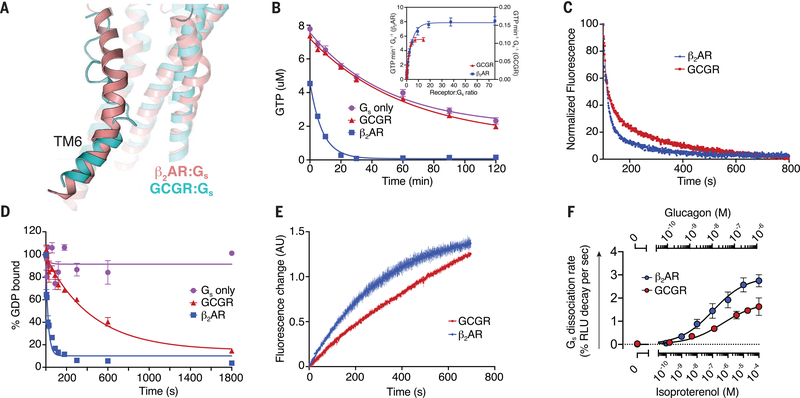
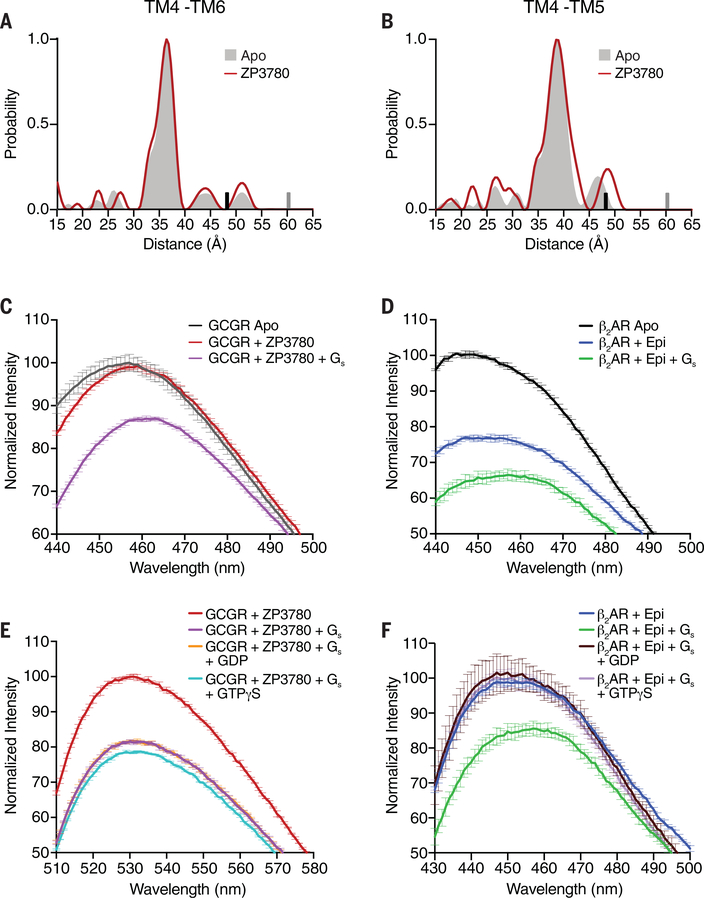
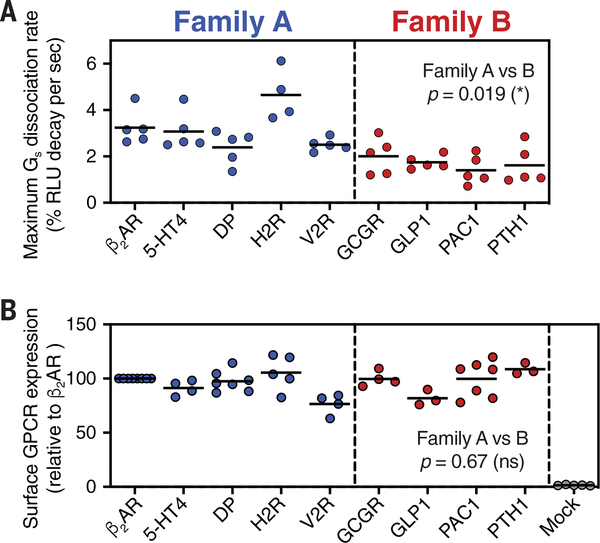
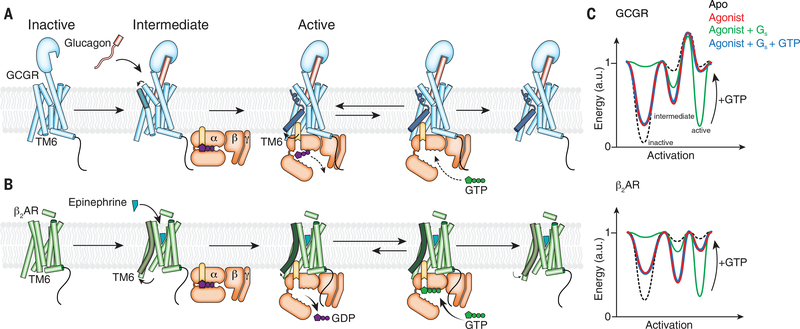
Family B heterotrimeric guanine nucleotide-binding protein (G protein)-coupled receptors (GPCRs) play important roles in carbohydrate metabolism. Recent structures of family B GPCR-Gs protein complexes reveal a disruption in the α-helix of transmembrane segment 6 (TM6) not observed in family A GPCRs. To investigate the functional impact of this structural difference, we compared the structure and function of the glucagon receptor (GCGR; family B) with the β2 adrenergic receptor (β2AR; family A). We determined the structure of the GCGR-Gs complex by means of cryo-electron microscopy at 3.1-angstrom resolution. This structure shows the distinct break in TM6. Guanosine triphosphate (GTP) turnover, guanosine diphosphate release, GTP binding, and G protein dissociation studies revealed much slower rates for G protein activation by the GCGR compared with the β2AR. Fluorescence and double electron-electron resonance studies suggest that this difference is due to the inability of agonist alone to induce a detectable outward movement of the cytoplasmic end of TM6.


Conflict of interest statement

Competing interests: B.K.K. is a cofounder of and consultant for ConfometRx. J.M.M. and L.G. are employees of Zealand Pharma. M.F.P. is a former employee of Zealand Pharma.

Figures

Fig. 1.
Fig. 1.. Cryo-EM structure of the ZP3780-bound GCGR-Gs complex.
(A) Cryo-EM density map of the ZP3780-bound GCGR-Gs heterotrimeric complex colored by subunit. Cyan, GCGR; red, ZP3780; yellow, Gαs; dark blue, Gβ; purple, Gγ; gray, Nb35. (B to D) Comparison of the inactive, peptide ligand–free state of GCGR (Fab-bound GCGR, blue, PDB 5XEZ) (19), partial agonist NNC1702-bound GCGR (orange, PDB 5YQZ) (17), and active, full-agonist ZP3780-bound state of GCGR (cyan). Substantial structural change is observed in TM6, which moves outward by 18 Å and partially unwinds to form a kink with an angle of 105°. Additional changes are also observed in TM1, TM3, TM5, and TM7.
Fig. 2.
Fig. 2.. ZP3780 binding and activation at GCGR.
(A) The N terminus of ZP3780 (red) is required for full ligand efficacy and penetrates deep in the receptor core to make H-bonds (dotted lines) with residues in TM1, TM3, TM7, and ECL3 (cyan). (B) The difference in receptor recognition by full-agonist ZP3780 (red) and partial-agonist NNC1702 (dark blue) that lacks H1 and has a D9E mutation is shown. NNC1702-bound GCGR is shown in orange (PDB 5YQZ) (17), and the ZP3780-bound GCGR-Gs complex structure is shown in cyan. The polar interactions are shown as dotted lines colored according to the GCGR structures bound to the two ligands, respectively (ZP3780, cyan; NNC1702, orange). (C) Comparison of the structures of the partial agonist NNC1702 (blue)–bound GCGR (orange, PDB 5YQZ) (17) and the full-agonist ZP3780 (red)–bound GCGR (cyan) reveal conformational differences in ECL3 and TM5, TM6, and TM7. The presence of H1 in ZP3780 ensures interaction with Q2323.37 and may induce rearrangement of residues in TM5. The interaction of D9 seems to stabilize TM7 and ECL3 displacement, which might trigger GCGR activation. (D) Mutation of Q2323.37, D370ECL3, R3787.35, and D3857.42 to alanine has a large effect on GCGR-mediated cAMP signaling. All mutants were expressed to similar levels as that of the WT receptor. For (D), data represent mean ± SEM from at least three independent experiments, performed in triplicates. Superscripts are Wootten numbering.
Fig. 3.
Fig. 3.. Structural changes in the PxxG motif of GCGR induced by full-agonist ZP3780 binding and Gs coupling.
(A) The rearrangement of TM3, TM5, and TM7 allows TM6 outward movement and kink formation at the conserved PxxG motif (P3566.47-L3576.48-L3586.49-G3596.50). The ZP3780-bound GCGR-Gs complex (cyan) is superimposed on the NNC1702-bound GCGR structure (orange) to highlight structural changes that result in the TM6 outward movement in the fully active GCGR-Gs complex structure. (B) Reorientation of residues in TM3, TM5, and TM7 around the PxxG motif that seems to facilitate kink formation in TM6. The polar interactions are shown as dotted lines colored according to the GCGR structure. The Cα atom of T3516.42 is presented as a sphere to highlight the extent of TM6 outward movement. (C) Alanine substitution of residues around the PxxG motif significantly reduces GCGR-mediated cAMP signaling. All mutants were expressed to similar levels as that of the WT receptor. For (C), data represent mean ± SEM from at least three independent experiments, performed in triplicates. Superscripts are Wootten numbering.
Fig. 4.
Fig. 4.. Structural changes in Gs upon coupling to GCGR.
(A) Comparison of GDP-bound Gαs (green, PDB 6EG8) (73) and nucleotide-free Gαs (yellow) in complex with GCGR (cyan). Major differences between these two structures are the opening and displacement of the α-helical domain, the rotational translation of the α5 helix to engage the receptor core, and conformational rearrangements in the α1 helix and α5-β6 loop. (B) The α5 helix (yellow) of Gαs in the nucleotide-free GCGR-Gs complex engages the cytoplasmic core of GCGR (cyan) to form extensive polar interactions (dotted lines) with TM5, TM6, and helix 8 (H8). (C) Comparison between the interaction of ICL2 of GCGR (cyan) and β2AR (pink) (PDB 3SN6) (50) and α5 of Gs (yellow and dark yellow, respectively). Close-up view shows that residue F139ICL2 of β2AR engages the hydrophobic pocket lined by residues from the αN-β1 loop, the β2-β3 loop, and the α5 helix. In GCGR, the corresponding residue is A256ICL2, which engages the hydrophobic pocket less efficiently.
Fig. 5.
Fig. 5.. Engagement and activation of Gs by GCGR and β2AR.
(A) Conformation of TM6 in the GCGR-Gs (cyan) and β2AR-Gs (pink, PDB 3SN6) (50) complex structures. (B) The GTP-turnover assay shows that β2AR (blue) activates Gs much faster than GCGR (red), with GCGR inducing a maximal GTP-turnover rate of 0.11 GTP min−1 Gs−1 compared with (inset) 8 GTP min−1Gs−1 for β2AR. (C) Monitoring of GPCR-Gs association by means of FRET between Cy3B-labeled GCGR (red) or Cy3B-labeled β2AR (blue) with Sulfo-Cy5-labeled Gs. The decrease in donor fluorescence shows comparable rates of association between the receptors and Gs. (D) The rate of receptor-induced [3H]-GDP dissociation from Gs shows faster release for β2AR (blue; koff = 0.042 s−1) compared with GCGR (red; koff = 0.0022 s−1). (E) Bodipy-GTPγS binding to nucleotide-free complex is slower for the GCGR-Gs complex (kon = 0.001 s−1) compared with the β2AR-Gs complex (kon = 0.003 s−1). (F) Concentration-response curves for Gs dissociation rates in HEK293 cells show slower Gs activation by GCGR compared with β2AR. In (B) and (D), data represent mean ± SEM from at least three independent experiments performed in triplicates. In (C) and (E), data represent mean ± SEM of triplicate measurements. In (F), data represent mean ± SEM of three to seven independent experiments.
Fig. 6.
Fig. 6.. Conformational changes in GCGR and β2AR upon ligand binding, G protein coupling, and G protein dissociation.
(A and B) DEER data showing no change in the distance distribution, between Apo (gray shading) and ZP3780 binding (red), of the TM4-TM6 and TM4-TM5 pairs. The upper limit of reliable distance (r) and width (σ) determination are shown as gray and black bars, respectively. (C) The apo (gray) spectrum of bimane-labeled GCGR (TM6) does not change upon ZP3780 addition (red). Further addition of Gs (purple) results in a decrease in fluorescence intensity and a 4-nm λmax shift owing to outward movement of TM6. (D) β2AR labeled with bimane in TM6 shows a decrease in fluorescence and a redshift in λmax when agonist, epinephrine (Epi) (blue), is added to apo (black), which changes further upon Gs (green) addition. (E) The addition of GDP (orange) or GTPγS (cyan) to NBD-labeled GCGR (TM6) bound to ZP3780 and coupled to Gs (purple) does not result in an increase of the fluorescence intensity to the level of ZP3780-bound GCGR in the absence of G protein (red). (F) The addition of GDP (brown) or GTPγS (light purple) to bimane-labeled β2AR bound to Epi and coupled to Gs (green) leads to an increase in fluorescence intensity and a blueshift in λmax to the same values as that for for Epi-bound β2AR in the absence of G protein (blue). In (C) to (F), data represent mean ± SEM of triplicate measurements.
Fig. 7.
Fig. 7.. Comparison of Gs activation kinetics between family A and family B GPCRs.
(A) Gs dissociation rates among family A and family B GPCRs. GPCR ligand-induced Gs dissociation was measured by monitoring real-time, luminescent signals from NanoBiT-Gs protein and by fitting the plot to a one-phase decay curve. (B) Surface expression levels of tested GPCRs. Cell-surface GPCRs were fluorescently labeled with anti-FLAG epitope-tagged antibody and analyzed by means of flow cytometry. Each dot represents data from individual independent experiments. P values were obtained by means of two-tailed Student’s t test with Welch’s correction.
Fig. 8.
Fig. 8.. Proposed model for GCGR activation and signaling in comparison with β2AR.
(A) Glucagon binding to GCGR induces conformational change on the extracellular side of the receptor (ECD, TM1, TM2, TM6, and TM7) without inducing outward movement of TM6 on the intracellular side. Coupling of GDP-bound Gs enables TM6 outward movement. The putative high energy required to produce the kinked and outward-moved TM6 may result in slower rates for the receptor-catalyzed nucleotide release of GCGR in comparison with β2AR. Another rate-limiting step for GCGR-mediated G protein activation is GTP binding to the nucleotide-free G protein that leads to dissociation of the G protein from the receptor. After disengagement of the G protein, relaxation of TM6 to the inactive state is very slow, which might lead to the previously observed prolonged G protein signaling of GCGR in comparison with β2AR (13). (B) β2AR activation by an agonist increases the active state population of the receptor with an outward-moved TM6. Gs coupling to β2AR fully stabilizes the active state and leads to rapid GDP release. The very transient nucleotide-free complex exhibits a high affinity for GTP that readily binds and dissociates the complex. After disengagement of the G protein, β2AR relaxes back to the more conformational heterogeneous agonist-bound but G protein–free state. (C) Model of the simplified free energy landscapes for GCGR and β2AR. Shown are the effects of agonist, G protein coupling, and GTP binding to the receptor–G protein complex on the equilibrium between the inactive and active states of the receptors.

Comment in

References

    1. Liang Y-L et al., Cryo-EM structure of the active, Gs-protein complexed, human CGRP receptor. Nature 561, 492–497 (2018). doi: 10.1038/s41586-018-0535-y - DOI - PMC - PubMed
    1. Liang Y-L et al., Phase-plate cryo-EM structure of a biased agonist-bound human GLP-1 receptor-Gs complex. Nature 555, 121–125 (2018). doi: 10.1038/nature25773 - DOI - PubMed
    1. Liang Y-L et al., Phase-plate cryo-EM structure of a class B GPCR-G-protein complex. Nature 546, 118–123 (2017). doi: 10.1038/nature22327 - DOI - PMC - PubMed
    1. Zhang Y et al., Cryo-EM structure of the activated GLP-1 receptor in complex with a G protein. Nature 546, 248–253 (2017). doi: 10.1038/nature22394 - DOI - PMC - PubMed
    1. Zhao L-H et al., Structure and dynamics of the active human parathyroid hormone receptor-1. Science 364, 148–153 (2019). doi: 10.1126/science.aav7942 - DOI - PMC - PubMed

Publication types

MeSH terms

Substances