. 2020 Jul 7;32(1):71-86.e5.
doi: 10.1016/j.cmet.2020.06.004. Epub 2020 Jun 22.

Small Extracellular Vesicles Have GST Activity and Ameliorate Senescence-Related Tissue Damage

Affiliations

Small Extracellular Vesicles Have GST Activity and Ameliorate Senescence-Related Tissue Damage

Juan Antonio Fafián-Labora et al. Cell Metab. .

Abstract

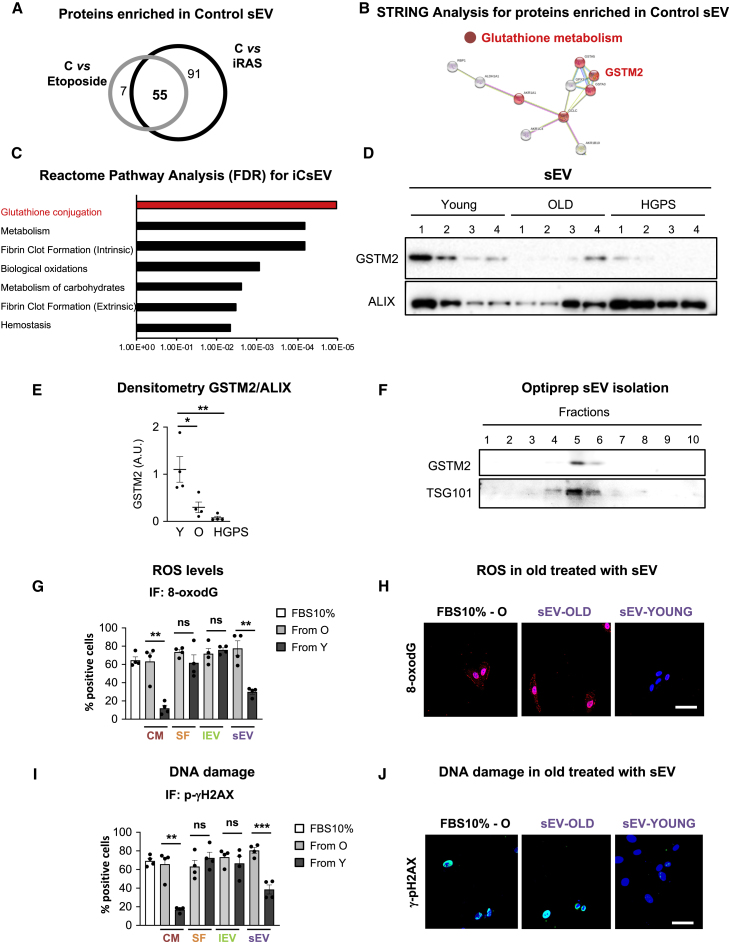
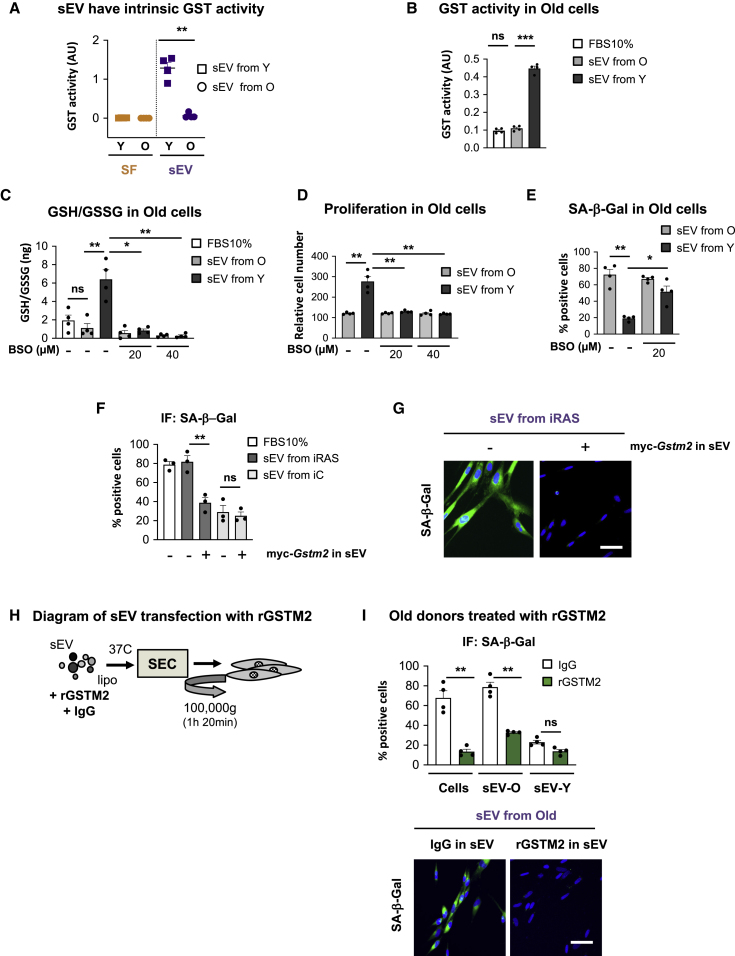
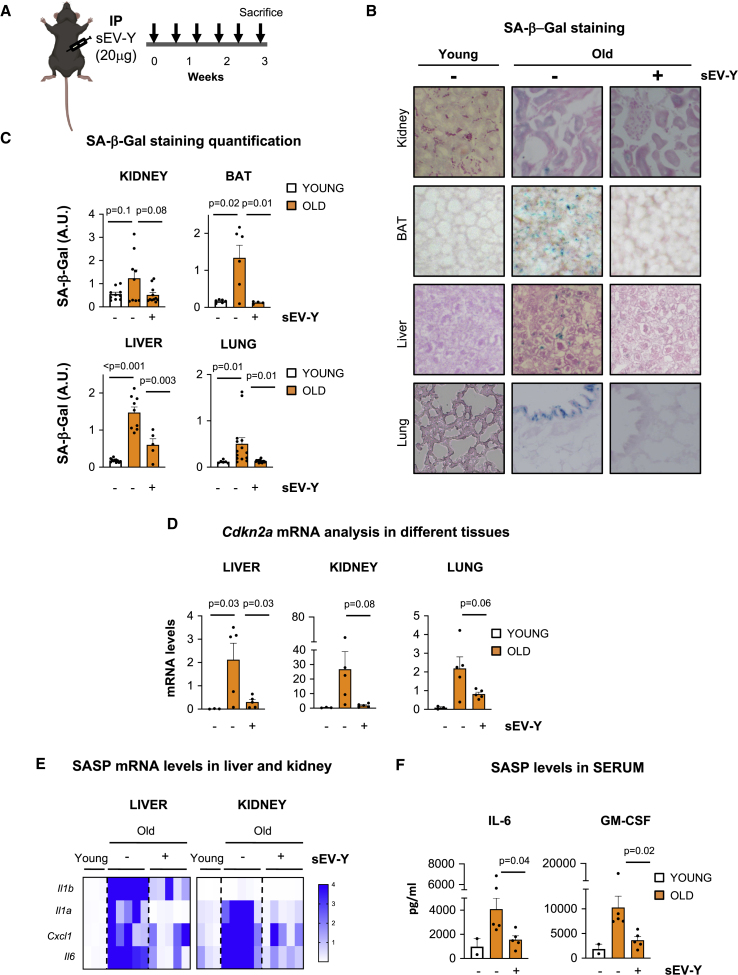
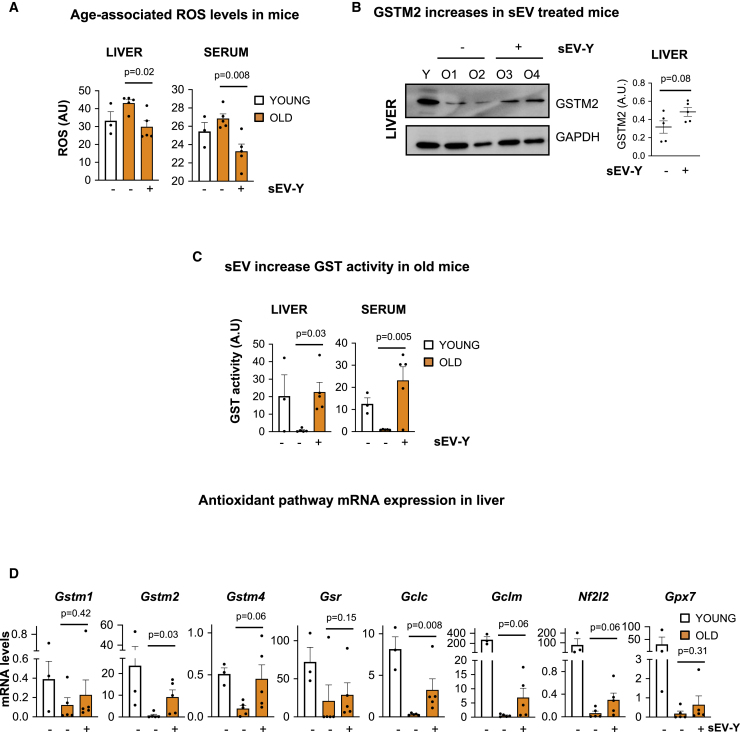
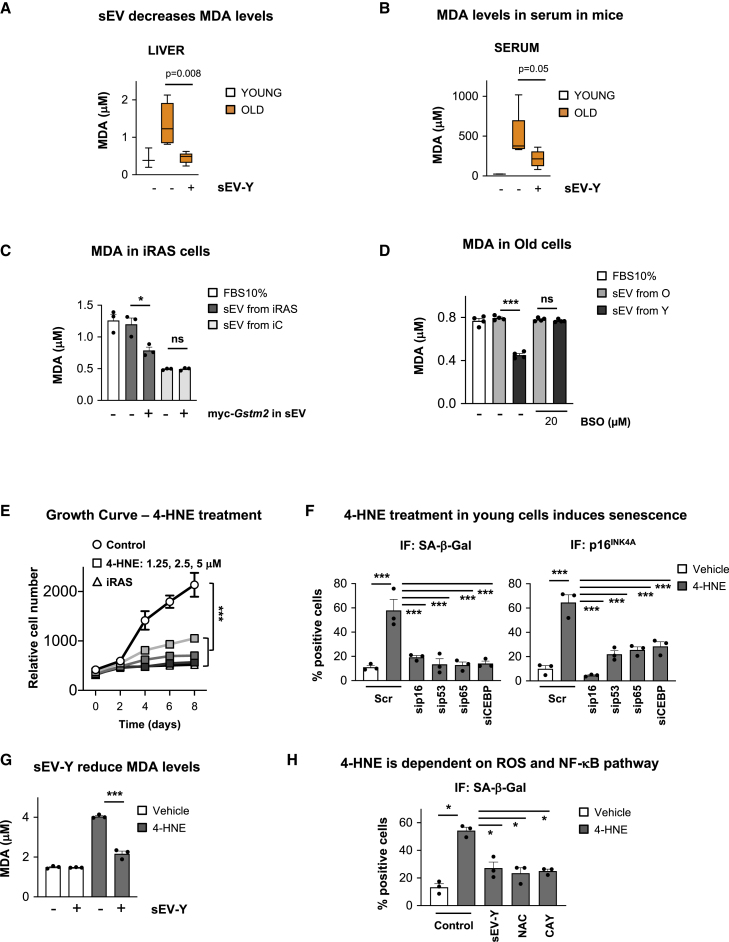
Aging is a process of cellular and tissue dysfunction characterized by different hallmarks, including cellular senescence. However, there is proof that certain features of aging and senescence can be ameliorated. Here, we provide evidence that small extracellular vesicles (sEVs) isolated from primary fibroblasts of young human donors ameliorate certain biomarkers of senescence in cells derived from old and Hutchinson-Gilford progeria syndrome donors. Importantly, sEVs from young cells ameliorate senescence in a variety of tissues in old mice. Mechanistically, we identified sEVs to have intrinsic glutathione-S-transferase activity partially due to the high levels of expression of the glutathione-related protein (GSTM2). Transfection of recombinant GSTM2 into sEVs derived from old fibroblasts restores their antioxidant capacity. sEVs increase the levels of reduced glutathione and decrease oxidative stress and lipid peroxidation both in vivo and in vitro. Altogether, our data provide an indication of the potential of sEVs as regenerative therapy in aging.

Keywords: 4-HNE; EV; GSH; GST; ROS; SASP; aging; extracellular vesicles; glutathione metabolism; glutathione-S-transferase; lipid peroxidation; rejuvenation; senescence; senescence-associated secretory phenotype.


Conflict of interest statement

Declaration of Interests The authors declare no conflicts of interest.

Figures

None
Graphical abstract
Figure 1
Figure 1
Functional Analysis of Different Fractions of the Conditioned Media of Young Donor Cells on Old Recipient Fibroblasts (A) Three (AG06240, AG13152, and AG13222) to four (AG16086, AG06240, AG13152, and AG13222) different cells derived from old donors were treated with pooled conditioned media (CM) from 3–4 young cells and separated fractions (SF, soluble fraction; large and small extracellular vesicles, lEVs and sEVs, respectively). Quantification of the percentage of cells staining positive for markers of senescence: proliferation measured by BrdU incorporation (left), p16INK4A (middle), and p21CIP1 (right) staining. Data represent the mean ± SEM of 2 independent experiments in 3–4 old cell lines. FBS 10% represents cells treated with medium as control. t test analyses were performed. ∗p < 0.05; ∗∗p < 0.01; ns, non-significant. (B) Representative pictures of p16INK4A and BrdU staining by IF in the old cell line AG16086 treated with CM from old (CM-OLD) or young cells (CM-YOUNG). (C) Representative pictures of AG16086 (old fibroblast) treated with sEVs derived from old (sEV-OLD) or young (sEV-YOUNG) cells. (D) Growth curve representing the mean ± SEM of the relative cell number of 4 old donor cell lines treated with either SF or sEVs from young or old donors at different time points shown in days. FBS 10% is control. Two-way ANOVA was performed. ∗∗∗p < 0.001. (E and F) Representative pictures of senescence-associated β-galactosidase (SA-β-Gal) activity (E) and quantification of IL-8 staining by IF in 4 old cell lines treated with sEVs from young or old donors (F). Representative images from AG16086 are shown. t test analysis was performed. ∗∗p < 0.01; ns, non-significant. (G) Schematic representation of the transmission of the rejuvenation potential of sEVs. Primary senescence are donor cells undergoing senescence by activation of H-RasG12V (iRAS cells); secondary and tertiary senescence are iRAS cells treated with sEVs isolated from either iC cells (iCsEV) or iRAS cells (RASsEV). (H) qPCR to determine SASP mRNA levels of cells undergoing either primary or secondary senescence. Mean of 3 independent experiments is shown. (I) Long-term treatment of 4 young or 4 old donor cells with the indicated sEVs every 72 h. Young and old donor cells with media (FBS 10%) were used as controls. Proliferation was measured by quantifying cell number ± SEM during different days. Two-way ANOVA statistical analysis was done. ∗∗∗p < 0.001. (B, C, and E) Scale bar, 50 μm. See also Figure S1.
Figure 2
Figure 2
sEV-Ys Ameliorate Cellular Phenotypes Associated with Senescence in HGPS Patient-Derived Fibroblasts (A) Three or four different cells derived from HGPS patients (AG11572, AG06917, AG07493, and AG10677) were treated with pooled conditioned media (CM) and fractions (SF, lEV, and sEV) from 3–4 pooled young cells. The percentage of cells staining positive for BrdU (left), p16INK4A (middle), and p21CIP1 (right) was quantified. Data represent the mean ± SEM of 2 independent experiments in 3–4 HGPS-derived cell lines. FBS 10% represents medium-treated cells as control. t test analyses were performed. ∗p < 0.05; ∗∗p < 0.01; ∗∗∗p < 0.001; ns, non-significant. (B and C) Representative images for AG11572 (HGPS-derived fibroblast line), treated with (B) CM or (C) sEVs derived from either HGPS or young donors. Scale bar, 50 μm. (D) Long-term growth curve of 4 HGPS-derived fibroblasts treated with either SF or sEV fractions for 72 h, replated, and counted on different days. Data show the mean ± SEM of the relative cell number along time in days. Two-way ANOVA was performed. ∗∗∗p < 0.001. See also Figure S2.
Figure 3
Figure 3
sEV-Ys Are Enriched in Proteins Related to Glutathione Conjugation and Ameliorate ROS Levels in Old Donor-Derived Fibroblasts (A) Analysis of a published proteomic analysis (Borghesan et al., 2019) on sEVs isolated from iC fibroblasts and sEVs derived from cells undergoing senescence (iRAS and by etoposide treatment). We found 55 proteins enriched in sEVs derived from iC in comparison with sEVs from iRAS and etoposide. (B and C) STRING (B) and Reactome pathway analysis (C) for the 55 proteins enriched in sEVs from iC highlight the glutathione metabolism pathway where GSTM2 is highlighted. (D) Immunoblotting for GSTM2 and ALIX in sEVs isolated from young, old, and HGPS fibroblasts loading the same number of sEVs (3 × 109). sEVs isolated from all four cell lines are shown. (E) Densitometry quantification for GSTM2 immunoblotting versus ALIX. t test analyses were performed. ∗p < 0.05; ∗∗p < 0.01. (F) sEVs were subjected to density gradient by Optiprep and different fractions were immunoblotted for GSTM2 and TSG101 showing the presence of sEVs containing GSTM2. (G) IF quantification for ROS by 8-oxodG staining in 4 old fibroblasts treated with the CM and other fractions derived from young cells. t test analyses were performed. ∗∗p < 0.01; ns, non-significant. (H) Representative pictures for 8-oxodG staining in GM05565 (old cell line) treated with sEV-Ys and sEV-Os or with FBS 10%. (I) IF quantification for p-γH2AX staining in 4 old fibroblasts treated with young donor CM and fractions. t test analyses were performed. ∗∗p < 0.01; ∗∗∗p < 0.001; ns, non-significant. (J) Pictures of p-γH2AX in AG16086 (old cell line) basal levels or treated with sEV-Ys or sEV-Os. (H and J) Scale bar, 50 μm. (G and I) FBS 10% is shown as negative control. All data represent mean ± SEM in 4 different cells lines derived from old donors. See also Figure S3.
Figure 4
Figure 4
GST Activity and GSH Levels Are Important in Mediating sEV-Y Rejuvenation in Old Donors (A) sEVs isolated from 4 different young donors have independent GST activity. sEVs from old donors and their respective SF fractions from young and old donors do not present GST activity. t test analysis was performed. ∗∗p < 0.01. (B) GST activity was determined in old fibroblasts treated with sEVs from either young or old donors. FBS 10% was used as a control. Data show the mean ± SEM of 4 different donor cells. t test analysis was performed. ∗∗∗p < 0.001; ns, non-significant. (C) Ratio of GSH/GSSG in old cells treated with sEVs and different concentrations (20 or 40 μM) of BSO (buthionine sulphoximine), which prevent de novo GSH synthesis. The increase in GSH/GSSG levels when old cells are treated with sEV-Ys is prevented after BSO treatment. ∗p < 0.05; ∗∗p < 0.01; ns, non-significant. (D) Relative cell number shows an increase in proliferation in old cells treated with sEV-Ys, which is prevented by GSH inhibition (BSO). ∗∗p < 0.01. (E) SA-β-Gal activity downregulation by sEV-Ys is prevented by 20 μM BSO treatment. ∗p < 0.05; ∗∗p < 0.01. (F and G) iC or iRAS HFFF2 cells were treated with sEVs derived from iC or iRAS ectopically expressing myc-Gstm2 or empty vector. The mean ± SEM from three independent experiments is shown. (F) SA-β-Gal activity was quantified and (G) representative images are shown. ∗∗p < 0.01; ns, non-significant. (H) Diagram of the protocol followed to transfect recombinant GSTM2 (rGSTM2) into old sEVs. (I) Four old donor cells were treated with sEVs isolated from old and young donors transfected with either IgG or rGSTM2 (rGSTM2-sEV). rGSTM2 was used on old donor cells on its own as a positive control. SA-β-Gal activity quantification and representative pictures are shown. Quantification represents the mean ± SEM of 4 different donor cell lines. ∗∗p < 0.01; ns, non-significant. See also Figure S4.
Figure 5
Figure 5
Analysis of Different Biomarkers of Aging and Senescence in Old Mice Treated with sEV-Ys (A) Schematic representation of the experimental settings for the sequential i.p. injection of 20 μg sEV-Ys twice a week for 3 weeks. Five 22- to 24-month-old mice were used per condition. (B and C) Immunohistochemistry (IHC) staining and quantification for SA-β-Gal in tissue sections from liver, kidney, lung, and brown adipose tissue (BAT) of young and old mice treated with or without sEV-Ys. Nuclear Fast Red staining is also shown. Representative pictures (B) and quantification (C) of SA-β-Gal activity for 3 young and 5 mice per condition. Welch’s t test was performed. (D) Relative Cdkn2a mRNA levels measured by qPCR in liver, kidney, and lung in young, old, and old mice treated with sEV-Ys. ANOVA was performed. (E) Heatmap showing mean mRNA levels for different components of the SASP in liver and kidney from young, old, and old mice treated with sEV-Ys. (F) ELISA for Il-6 and GM-CSF present in serum of the indicated mice. Data represent mean ± SEM of 2 young mice and 5 old mice per condition. Welch’s t test was performed. (D and E) Three mice were used as young controls while 5 mice were used for old and 5 for old sEV-Y-treated. See also Figure S5.
Figure 6
Figure 6
sEV-Ys Prevent ROS Accumulation and Increase the Levels of GSH in Old Mice (A) The levels of oxidative stress (ROS) were measured in liver and serum from young mice (n = 3 mice) and old mice treated or not with sEV-Ys (n = 5 old mice per condition). Data represent mean ± SEM. t test analysis was performed. (B) Representative immunoblot for the expression of GSTM2 in the liver in young and old treated or untreated mice. GAPDH was used as loading control and quantification of 5 mice per condition is shown in graph. (C) Measurement of GST activity in the liver and serum from different young, old sEV-Y-treated, or non-treated mice (n = 3 young and n = 5 per condition in old mice). Data represent mean ± SEM. t test was performed. (D) qPCR analysis for different transcripts related to the antioxidant pathway in the liver from young, old sEV-Y-treated, or untreated old mice (n = 3 young and n = 5 per condition in old mice). Mann-Whitney test was performed. See also Figure S6.
Figure 7
Figure 7
sEV-Ys Ameliorate Lipid Peroxidation In Vitro and In Vivo (A and B) MDA levels in (A) liver and (B) serum from young and old mice treated with sEV-Ys or not. Data represent the mean ± SEM of 3–5 mice. t test analysis was performed. (C) MDA quantification in iRAS cells treated with sEVs from iC or iRAS expressing myc-Gstm2 or not. Data show the mean ± SEM of 3 independent experiments. ∗p < 0.05; ns, non-significant. (D) Quantification of MDA in old donor fibroblasts incubated with sEVs isolated from either young or old donors treated with 20 μM BSO. Graphs represents the mean ± SEM of 4 old donor fibroblasts. ∗∗∗p < 0.001; ns, non-significant. (E) Growth curve for young HFFF2 fibroblasts treated with increasing concentrations of 4-HNE (1.25, 2.5, and 5 μM). iRAS were used as a positive control. Data represent the mean ± SEM of 3 independent experiments. Two-way ANOVA was performed. ∗∗∗p < 0.001. (F) IF analyses of biomarkers of senescence (SA-β-Gal and p16INK4A) in 4-HNE-treated young fibroblasts with different siRNA targeting a variety of pathways that regulate senescence. 50 nM siRNA targeting p16 (sip16), p53 (sip53), NF-κB (sip65), and C/EBPβ (siCEBP) was used. Scr is a non-targeting control. ∗∗∗p < 0.001. (G) MDA levels in 4-HNE-treated young HFFF2 cells incubated or not with sEV-Ys. ∗∗∗p < 0.001. (H) Quantification of SA-β-Gal in HFFF2 cells treated with 4-HNE and different inhibitors targeting IKK (NF-κB pathway; 20 μM CAY10576) or ROS (100 nM NAC). sEV-Ys were used as a positive control. ∗p < 0.05. See also Figure S7.

Comment in

References

    1. Acosta J.C., O’Loghlen A., Banito A., Guijarro M.V., Augert A., Raguz S., Fumagalli M., Da Costa M., Brown C., Popov N. Chemokine signaling via the CXCR2 receptor reinforces senescence. Cell. 2008;133:1006–1018. - PubMed
    1. Acosta J.C., Banito A., Wuestefeld T., Georgilis A., Janich P., Morton J.P., Athineos D., Kang T.W., Lasitschka F., Andrulis M. A complex secretory program orchestrated by the inflammasome controls paracrine senescence. Nat. Cell Biol. 2013;15:978–990. - PMC - PubMed
    1. Ademowo O.S., Dias H.K.I., Burton D.G.A., Griffiths H.R. Lipid (per) oxidation in mitochondria: an emerging target in the ageing process? Biogerontology. 2017;18:859–879. - PMC - PubMed
    1. Basisty N., Kale A., Jeon O.H., Kuehnemann C., Payne T., Rao C., Holtz A., Shah S., Sharma V., Ferrucci L. A proteomic atlas of senescence-associated secretomes for aging biomarker development. PLoS Biol. 2020;18:e3000599. - PMC - PubMed
    1. Binder C.J., Papac-Milicevic N., Witztum J.L. Innate sensing of oxidation-specific epitopes in health and disease. Nat. Rev. Immunol. 2016;16:485–497. - PMC - PubMed

Publication types

Substances