. 2020 Jan 24;23(1):100772.
doi: 10.1016/j.isci.2019.100772. Epub 2019 Dec 13.

Clostridium butyricum Modulates the Microbiome to Protect Intestinal Barrier Function in Mice with Antibiotic-Induced Dysbiosis

Affiliations

Clostridium butyricum Modulates the Microbiome to Protect Intestinal Barrier Function in Mice with Antibiotic-Induced Dysbiosis

Mao Hagihara et al. iScience. .

Abstract

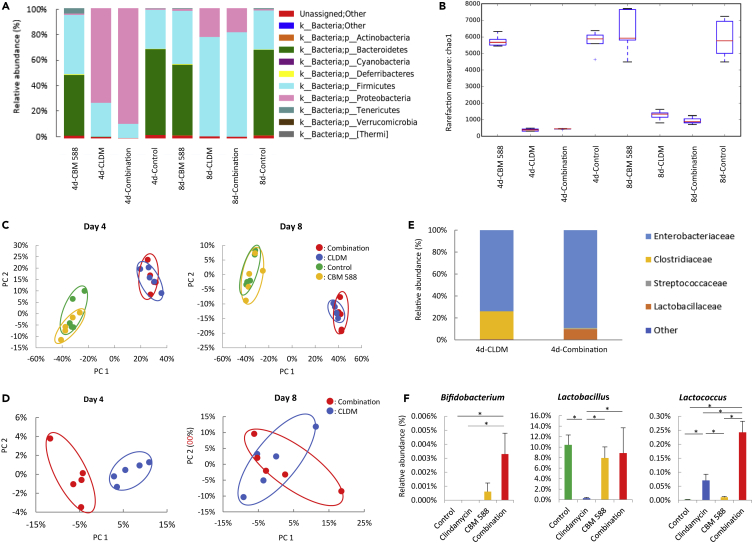
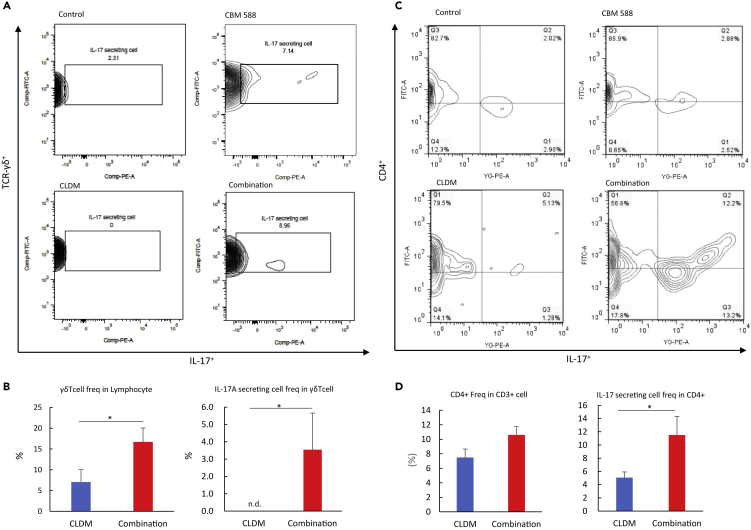
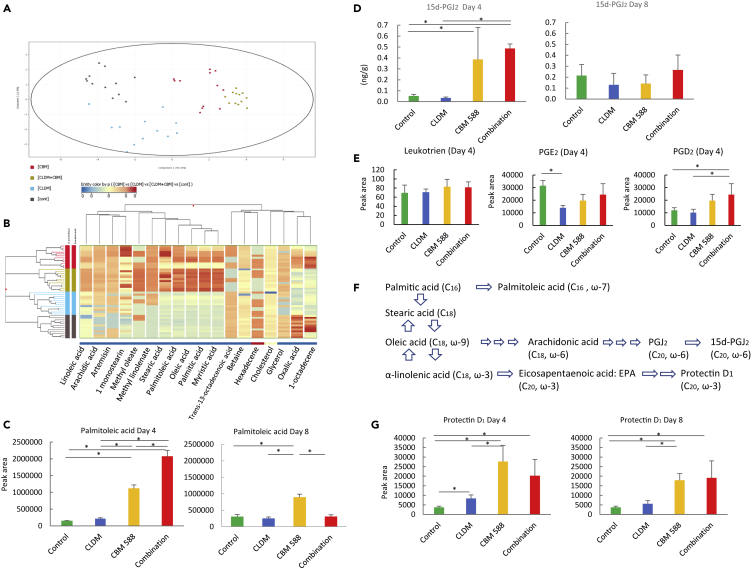
Clostridium butyricum MIYAIRI 588 (CBM 588) is a probiotic bacterium that has previously been used to prevent antibiotic-associated diarrhea. However, the underlying mechanism by which CBM 588 protects the gut epithelial barrier remains unclear. Here, we show that CBM 588 increased the abundance of Bifidobacterium, Lactobacillus, and Lactococcus species in the gut microbiome and also enhanced the intestinal barrier function of mice with antibiotic-induced dysbiosis. Additionally, CBM 588 significantly promoted the expansion of IL-17A-producing γδT cells and IL-17A-producing CD4 cells in the colonic lamina propria (cLP), which was closely associated with changes in the intestinal microbial composition. Additionally, CBM 588 plays an important role in controlling antibiotic-induced gut inflammation through upregulation of anti-inflammatory lipid metabolites such as palmitoleic acid, 15d-prostaglandin J2, and protectin D1. This study reveals a previously unrecognized mechanism of CBM 588 and provides new insights into gut epithelial barrier protection with probiotics under conditions of antibiotic-induced dysbiosis.

Keywords: Clinical Microbiology; Microbiome.


Conflict of interest statement

Declaration of Interests The authors declare no competing financial interests.

Figures

None
Graphical abstract
Figure 1
Figure 1
Mice Suffer Worse Epithelial Injury after Clindamycin Administration (A) Experimental design of clindamycin and/or CBM 588 administration in 9- to 10-week-old ICR mice. Mice received clindamycin and/or CBM 588 via sonde for 4 days; 1: control group (Control), 2: clindamycin administration group (CLDM), 3: CBM 588 administration group (CBM 588), and 4: combination (CBM 588 + clindamycin) group (Combination). Collection time points of stool for C. butyricum colony count and microbiome analysis and colon tissue for cytokine and macroscopic analysis are indicated. (B) Enumerating C. butyricum in feces in ▲: total colony count in CBM 588 administration group (CBM 588-T), ▵: spore colony count in CBM 588 monotherapy group (CBM 588-AS), ●: total colony count in combination group (Combination-T), ○: spore colony count in combination group (Combination-AS). The testing detectable level is above 2.3 (log amount) in per gram feces, with representative data n = 5–10 per group, mean ± SEM. Statistical analysis of quantitative multiple group comparisons was performed using a one-way analysis of variance followed by Tukey's test, *p < 0.05. (C) Weight changes of control group (●), CBM 588 administration group (▲), clindamycin administration group (■), and combination group (◆) for mice over time duration of the study (18 days), with representative data n = 5 per group, mean ± SEM. (D) Colon length (cm) at day 8, with representative data n = 5 per group, mean ± SEM. Pictures show representative isolated colons from each group. Statistical analysis of the quantitative multiple group comparisons was performed using a one-way analysis of variance followed by Tukey's test, *p < 0.05. (E) Hematoxylin and eosin (H&E) staining of colons at day 8 revealed superficial epithelial necrosis and the presence of inflammatory cells only in the clindamycin administration group (magnification, 10× and the scale bar represents 150 μm). (F) Histopathology scoring of H&E-stained colon sections in each group mice. All values are mean ± SEM (n = 5). Statistical analysis of the quantitative multiple group comparisons was performed using a one-way analysis of variance followed by Tukey's test, *p < 0.05. (G) Intestinal permeability was determined. All values are mean ± SEM (n = 5). Statistical analysis of the quantitative multiple group comparisons was performed using a one-way analysis of variance followed by Tukey's test, *p < 0.05.
Figure 2
Figure 2
CBM 588 Modulates Gut Bacterial Composition in Mice (A) Bacterial compositions in different experimental groups at the phylum level. 4d: sampling at day 4, 8d: sampling at day 8. (B) Comparison of the Shannon index of different groups. The box and whiskers represent the smallest and largest values, with the median in the center of each box. (C) Principal Coordinate Analysis (PCoA) based on weighted Unifrac distances among four groups. (D) PCoA based on weighted Unifrac distances between the clindamycin administration group and the combination group. (E) The bacterial composition at day 4 in the clindamycin administration group and combination group at the family level. (F) Effect of clindamycin and CBM 588 administrations on relative species abundance (≥0.001%) in the fecal samples. After quality filtering steps, three species (Bifidobacterium, Lactobacillus, and Lactococcus) were considered to have significantly higher relative abundance (%) in the combination group, compared with the clindamycin administration group at day 4. Data represent the mean values of relative abundances ±SEM (n = 5–10). Statistical analysis of the quantitative multiple group comparisons was performed using a one-way analysis of variance followed by Tukey's test, *p < 0.05.
Figure 3
Figure 3
CBM 588 Modulates Inflammation and Anti-inflammation Cytokines to Suppress Antibiotic-Induced Colitis (A) The relative RNA expression levels of genes encoding TGF-β1 in colon tissue of mice detected at day 8 by qPCR. (B) TGF-β1 protein concentrations in colon tissues of mice detected at day 8 by ELISA. (C) The relative RNA expression levels of genes encoding TLR-2 in colon tissue of mice detected at day 8, as detected by qPCR. (D) The relative RNA expression levels of genes encoding IL-1β, IL-6, TNF-α, COX-2, INF-γ, and IL-10 in colon tissue of mice at day 8, as detected by qPCR. (E) TNF-α protein concentrations in colon tissues of mice detected at day 8, as measured by ELISA. (F) The relative RNA expression levels of genes encoding NF-κB and HSP-70 in colon tissue of mice detected at day 8, measured by qPCR. (G) Hematoxylin and eosin (H&E) staining of colons in the clindamycin group shows the presence of inflammatory cells at day 8, including many neutrophil infiltration after clindamycin administration (left: magnification, 10× and the scale bar represents 150 μm) (right: magnification, 20×). All values are mean ± SEM (n = 5–10). Statistical analysis of the quantitative multiple group comparisons was performed using a one-way analysis of variance followed by Tukey's test, *p < 0.05.
Figure 4
Figure 4
CBM 588 Enhances Intestinal Barrier Function of Colitis Mice (A) The relative RNA expression of genes encoding mucin-2 (MUC-2), claudin (CLDN4), zonula occludens (ZO-1), and occludin (OCLN) in colon tissues of mice, detected by qPCR. (B) The relative RNA expression levels of genes encoding IL-17A in colon tissues of mice, detected by qPCR. (C) The IL-17A concentration in each animal group was detected by ELISA. (D) The MUC-2 and ZO-1 concentrations in each animal group were detected by ELISA. All values are mean ± SEM (n = 5–10). Statistical analysis of the quantitative multiple group comparisons was performed using a one-way analysis of variance followed by Tukey's test, *p < 0.05.
Figure 5
Figure 5
CBM 588 Upregulates IL-17A-producing γδT Cells and CD4 Cells (A) Representative flow cytometry plots of γδT cells identified, and IL-17A-producing γδT cell expression among lymphocytes in colonic lamina propria (cLP) in the control group (Control), CBM 588 administration group (CBM 588), clindamycin administration group (CLDM), and combination group (Combination). (B) Percentage of γδT cells in lymphocytes of cLP for the clindamycin administration group (CLDM) and combination group (left). Percentage of IL-17A secreting γδT cells among γδT cells in cLP cells (right). (C) Representative flow cytometry plots of CD4 cells identified, and IL-17A-producing CD4 cell expression among lymphocytes in cLP in the control group (Control), CBM 588 administration group (CBM 588), clindamycin administration group (CLDM), and combination group (Combination). (D) Percentage of CD4 cells in lymphocytes of cLP for the clindamycin administration group (CLDM) and combination group (left). Percentage of IL-17A secreting CD4 cells among CD3 cells in cLP cells (right). All values, except Figures 5A and 5C, are mean ± SEM (n = 5–10). Statistical analysis of the quantitative multiple group comparisons was performed using a one-way analysis of variance followed by Tukey's test, *p < 0.05, n.d., not detected.
Figure 6
Figure 6
Anti-IL-17 Antibodies Reduced CBM 588 Effects on Intestinal Barrier Function (A) The relative RNA expression levels of genes encoding IL-1β, IL-6, TNF-α, and COX-2 in colon tissue of mice detected at day 8 by qPCR. Expression of target genes was analyzed by the ΔΔCt method. Relative RNA expression levels of each target gene in mice treated with combination (clindamycin + CBM 588) + Anti-IL-17 antibodies were normalized to the combination group (represented as RQ). (B) Hematoxylin and eosin (H&E) staining of colons at day 8 revealed superficial epithelial necrosis and the presence of inflammatory cells only in mice treated with combination (clindamycin + CBM 588) + Anti-IL-17 antibodies (magnification, 4× and the scale bar represents 150 μm). All values are mean ± SEM (n = 5–10). Statistical analysis of the quantitative multiple group comparisons was performed using a one-way analysis of variance followed by Tukey's test, *p < 0.05, n.d., not detected.
Figure 7
Figure 7
CBM 588 Changes Gut Microbiome Metabolic Profiles to Protect the Gut Epithelial Barrier (A) Heatmaps, generated by hierarchical clustering, of selected colon metabolites at day 4, were significant between the control, clindamycin, and/or CBM 588 administration groups by Kruskal-Wallis test. An FDR p value < 0.05 was considered statistically significant, and the Benjamini-Hochberg method was used to calculate FDR p value. (B) Expansion sites derived from Figure 7A. (C) Comparison of the relative abundance of “starch and sucrose metabolism” and “fructose and mannose metabolism” in individual groups. (D) The concentration of SCFAs in fecal samples. These fecal samples were taken at day 4 and day 8. (E) The ratio of n-butyrate/lactate among all groups at day 4 and day 8. (F) Comparison of the relative abundance of “lipid metabolism,” “arachidonic acid metabolism,” and “α-linoleic acid metabolism” in individual groups. All values are mean ± SEM (n = 5–10). Statistical analysis of the quantitative multiple group comparisons was performed using a one-way analysis of variance followed by Tukey's test, *p < 0.05.
Figure 8
Figure 8
CBM 588 Promotes the Production of Several Anti-inflammatory Compounds in Mouse Colon Tissue (A) PCA analysis representation of major sources of metabolite variability in the colon at day 4. Data points represent colon samples from three independent experiments (biological replicates; n = 5) injected randomly into the GC-MS. (B) Heatmaps of selected colon metabolites, generated by hierarchical clustering, were significant between the control, clindamycin, and/or CBM 588 administration groups by Kruskal-Wallis test. An FDR p value < 0.05 was considered statistically significant, and the Benjamini-Hochberg method was used to calculate FDR p value. (C) The peak height comparison of palmitoleic acid at day 4 and day 8 in each group. (D) The concentration of 15d-PGJ2 at day 4 and day 8. (E) The peak height comparison of leukotriene, PGE2, and PGD2 at day 4. These results are represented with the mean ± SEM (n = 5). (F) Featured metabolic pathway from palmitic acid to palmitoleic acid, 15d-PGJ2, and Protectin D1. (G) The peak height comparison of protectin D1 at day 4 and day 8. These results are represented with the mean ± SEM (n = 5–10). *p < 0.05. Statistical analysis of the quantitative multiple group comparisons was performed using a one-way analysis of variance followed by Tukey's test, *p < 0.05.

References

    1. Alvarez C.S., Badia J., Bosch M., Giménez R., Baldomà L. Outer membrane vesicles and soluble factors released by probiotic Escherichia coli nissle 1917 and commensal ECOR63 enhance barrier function by regulating expression of tight junction proteins in intestinal epithelial cells. Front. Microbiol. 2016;7:1981. - PMC - PubMed
    1. Atarashi K., Tanoue T., Shima T., Imaoka A., Kuwahara T., Momose Y., Cheng G., Yamasaki S., Saito T., Ohba Y. Induction of colonic regulatory T cells by indigenous Clostridium species. Science. 2011;331:337–341. - PMC - PubMed
    1. Awad A.B., Kamei A., Horvath P.J., Fink C.S. Prostaglandin synthesis in human cancer cells: influence of fatty acids and butyrate. Prostaglandins Leukot. Essent. Fatty Acids. 1995;53:87–93. - PubMed
    1. Bartlett J.G. Clinical practice. Antibiotic-associated diarrhea. N. Engl. J. Med. 2002;346:334–339. - PubMed
    1. Benakis C., Brea D., Caballero S., Faraco G., Moore J., Murphy M., Sita G., Racchumi G., Ling L., Pamer E.G. Commensal microbiota affects ischemic stroke outcome by regulating intestinal γδ T cells. Nat. Med. 2016;22:516–523. - PMC - PubMed