. 2019 Dec;21(12):e13099.
doi: 10.1111/cmi.13099. Epub 2019 Aug 26.

Infection with genotoxin-producing Salmonella enterica synergises with loss of the tumour suppressor APC in promoting genomic instability via the PI3K pathway in colonic epithelial cells

Affiliations

Infection with genotoxin-producing Salmonella enterica synergises with loss of the tumour suppressor APC in promoting genomic instability via the PI3K pathway in colonic epithelial cells

Océane C B Martin et al. Cell Microbiol. 2019 Dec.

Abstract

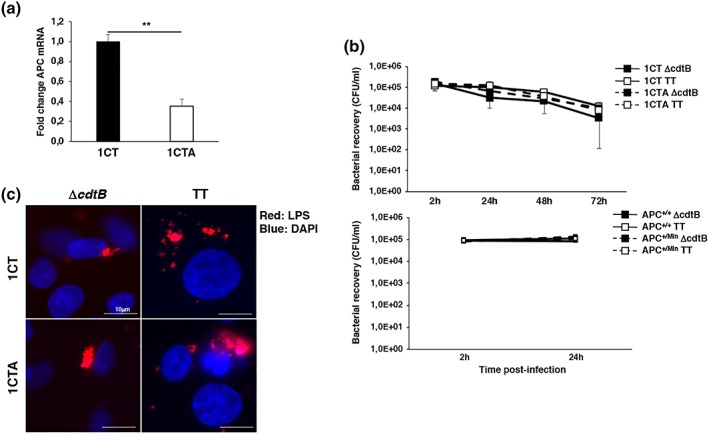
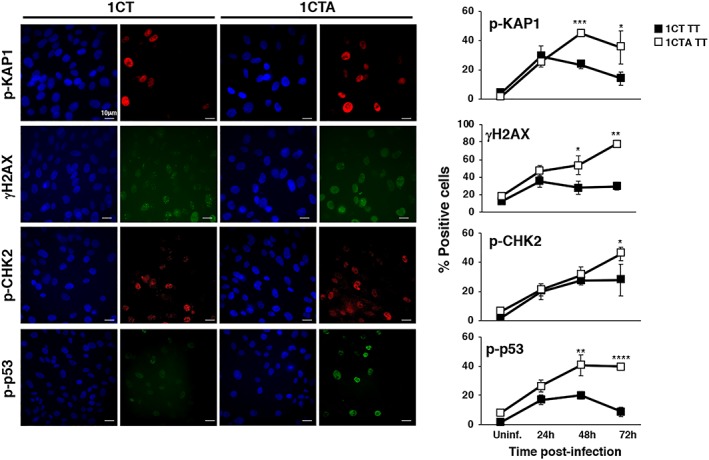
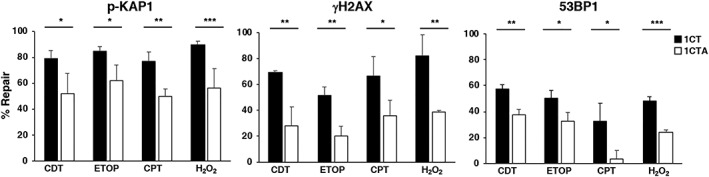
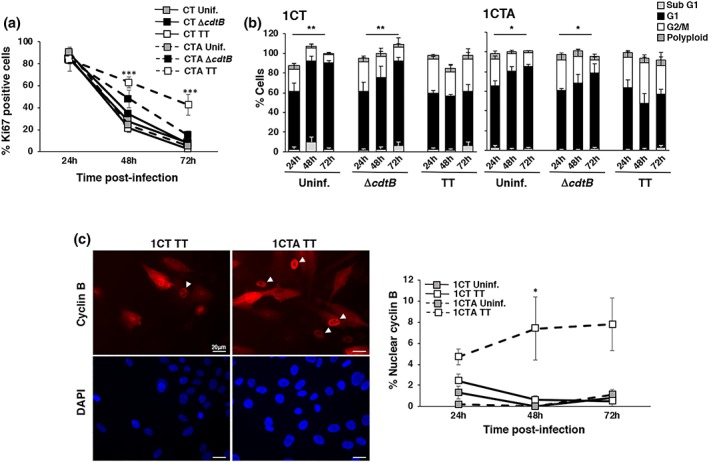
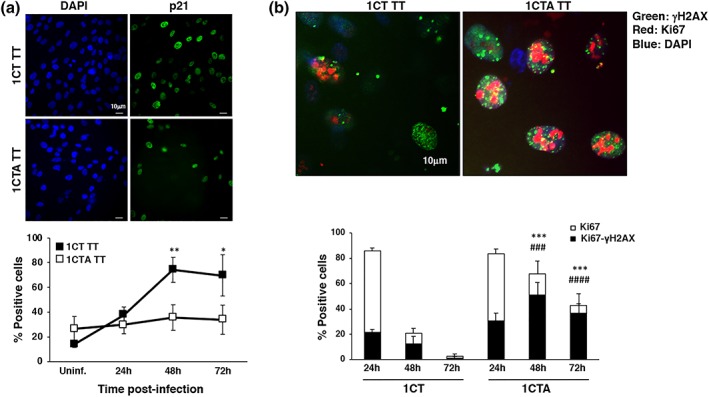
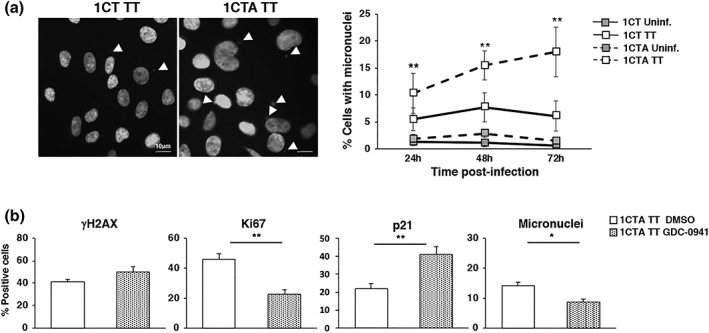
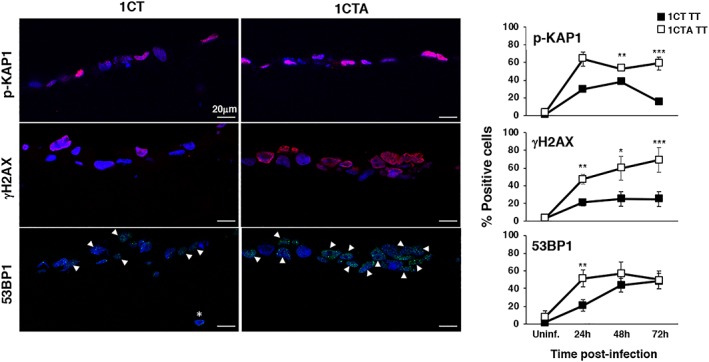
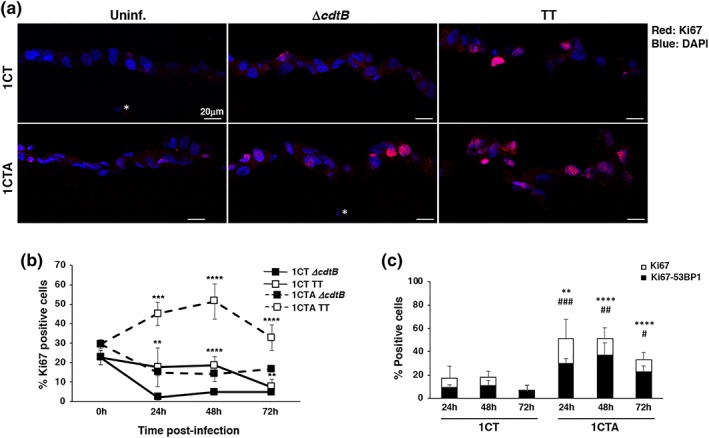
Several commensal and pathogenic Gram-negative bacteria produce DNA-damaging toxins that are considered bona fide carcinogenic agents. The microbiota of colorectal cancer (CRC) patients is enriched in genotoxin-producing bacteria, but their role in the pathogenesis of CRC is poorly understood. The adenomatous polyposis coli (APC) gene is mutated in familial adenomatous polyposis and in the majority of sporadic CRCs. We investigated whether the loss of APC alters the response of colonic epithelial cells to infection by Salmonella enterica, the only genotoxin-producing bacterium associated with cancer in humans. Using 2D and organotypic 3D cultures, we found that APC deficiency was associated with sustained activation of the DNA damage response, reduced capacity to repair different types of damage, including DNA breaks and oxidative damage, and failure to induce cell cycle arrest. The reduced DNA repair capacity and inability to activate adequate checkpoint responses was associated with increased genomic instability in APC-deficient cells exposed to the genotoxic bacterium. Inhibition of the checkpoint response was dependent on activation of the phosphatidylinositol 3-kinase pathway. These findings highlight the synergistic effect of the loss of APC and infection with genotoxin-producing bacteria in promoting a microenvironment conducive to malignant transformation.

Keywords: APC; DNA damage response; DNA repair; bacteria and cancer; bacterial genotoxin; organotypic model; tumour-suppressor gene.


Conflict of interest statement

The authors declare no conflict of interest

Figures

Figure 1
Figure 1
Infection with the Salmonella MC1 TT and MC1ΔcdtB strains. (a) Levels of APC mRNA assessed by qPCR in the 1CT and 1CTA cell lines. Mean ± SEM of three independent experiments. (b) 1CT and 1CTA cells (upper panel) and Apc +/+ and Apc +/Min cells (lower panel) grown in 2D culture were infected with the MC1 ∆cdtB (∆cdtB) or MC1 TT (TT) strains at MOI 100:1. The data are presented as number of CFU/ml of viable bacteria recovered at the indicated time points. Mean ± SEM of four to eight independent experiments. (c) Cells grown in 2D culture were infected with the MC1 ∆cdtB or MC1 TT strains at MOI 100:1. Bacteria were visualised using a rabbit serum anti‐LPS followed by a goat anti‐rabbit secondary antibody conjugated to Alexa‐568 (red). Nuclei were counterstained with DAPI (blue). Representative scanning confocal micrographs at magnification 63×
Figure 2
Figure 2
APC‐deficient cells show a sustained activation of the DNA damage response. 1CT and 1CTA cells, grown in 2D culture, were left untreated (Uninf.) or infected with the MC1 TT strain (TT) at MOI 100:1 for the indicated period of time. Activation of the DNA damage response was assessed by immunofluorescence analysis, using antibodies specific for phosphorylated KAP1 (p‐KAP1), phosphorylated H2AX (γH2AX), phosphorylated CHK2 (p‐CHK2), Ser15 phosphorylated p53 (p‐p53). Left panel: representative fluorescence micrographs; right panel: quantification of the positive cells. The percentage of positive cells in uninfected cells was similar during all the time kinetics experiment; thus, we have presented the values relative to the 24‐hr time point. Mean ± SEM of three independent experiments. One hundred cells were evaluated for each experiment for each cell line. Statistical analysis comparing 1CT and 1CTA for each time point was performed using the Student t test, *p < .05; **p < .01; ***p < .001; ****p < .0001
Figure 3
Figure 3
APC deficiency reduces the repair of DNA damage induced by a broad spectrum of genotoxic stresses. 1CT and 1CTA cells, grown in 2D culture, were left untreated (see Figure S5) or treated for 6 hr with CDT (1 μg/ml), etoposide (ETOP, 15 μM), camptothecin (CPT, 5 μM), or H2O2 (50 μM), defined as 6 hr. After 6‐hr incubation, cells were washed and maintained in medium without the genotoxic agents for additional 18 hr, defined as 24 hr. The percentage of repair was calculated as follows: [1 − (% positive cells at 24 hr/% positive cells at 6 hr)] × 100. One hundred cells were evaluated for each experiment for each cell line. Mean ± SEM of three independent experiments. Statistical analysis was performed using the Student t test, *p < .05; **p < .01; ***p < .001
Figure 4
Figure 4
APC deficiency impairs activation of cell cycle arrest. 1CT and 1CTA cells grown in 2D culture were left uninfected or infected with the MC1 ∆cdtB or MC1 TT strains as described in Figure 1. The proliferation status was assessed by immunofluorescence analysis, using antibodies specific for Ki67 and cyclin B1. (a) Quantification of cells positive for Ki67. Mean ± SEM of four independent experiments. (b) Cell cycle distribution assessed by PI staining followed by FASC analysis. Mean ± SEM of four independent experiments. Statistical analysis was performed using the Student t test *p < .05; **p < .01. Significant accumulation in the G1 phase of the cell cycle was observed in 1CT and 1CTA cells at 72‐hr postinfection compared with the 24‐hr time point. (c) Left panel: fluorescence micrographs showing the subcellular distribution of cyclin B1, white arrowheads indicated cells progressing to the M phase of the cell cycle, characterised by the nuclear translocation of cyclin B1. Right panel: quantification of cells with nuclear translocation of cyclin B1. Mean ± SEM of three independent experiments. One hundred cells were evaluated for each experiment for each cell line. Statistical analysis was performed using the Student t test, *p < .05; ***p < .001
Figure 5
Figure 5
APC deficient cells proliferate in spite of the presence of DNA damage. 1CT and 1CTA cells grown in 2D culture were infected with the MC1 TT strain as described in Figure 1. (a) Upregulation of p21 expression was assessed by immunofluorescence analysis. Upper panel: representative fluorescence micrographs; lower panel: quantification of the positive cells. Mean ± SEM of three to four independent experiments. Statistical analysis comparing 1CT and 1CTA for each time point was performed using the Student t test: *p < .05; **p < .01. (b) Induction of proliferation status and DNA damage was assessed by immunofluorescence analysis, using antibodies specific for Ki67 and γH2AX, respectively. Upper panel: representative micrograph showing cells double positive for the proliferation (Ki67, red) and DNA damage (γH2AX, green) markers. Nuclei were counterstained with DAPI (blue). Lower panel: quantification of 1CT and 1CTA cells infected with the MC1 TT strain positive for Ki67 (white bar) and double positive for both Ki67 and γH2AX (black bar). Mean ± SEM of three to four independent experiments. Statistical analysis was performed using the Student t test. *,# p < .05; **,## p < 0.01; ***,### p < .001; ****,#### p < .0001. *comparison Ki67 positive cells, #comparison Ki67‐γH2AX double‐positive cells
Figure 6
Figure 6
APC deficiency promotes acquisition of genomic instability upon infection with the genotoxic Salmonella in a PI3K dependent manner. (a) 1CT and 1CTA cells, grown in 2D culture, were left untreated (Uninf.) or infected with the MC1 TT (TT) strain at MOI 100:1 for the indicated period of time. The left panel shows representative fluorescence micrographs of the infected cells illustrating the presence of micronuclei (white arrowheads) detected by DAPI staining. The right panel shows the quantification of micronuclei positive cells. Mean ± SEM of four to eight independent experiments. (b) 1CTA cells were pretreated for 1 hr with the specific PI3K inhibitor CDG‐0941 (1 μM) for 1‐hr prior infection, which was carried on for 72 hr. DMSO was used as vehicle control. Detection of DNA damage, proliferative capacity, and micronuclei formation were assessed by γH2AX, Ki67, p21, and DAPI staining. Mean ± SEM of three independent experiments. Statistical analysis was performed using the Student t test, *p < .05; **p < .01
Figure 7
Figure 7
APC‐deficient cells show a sustained activation of the DNA damage response in 3D culture. 1CT and 1CTA cells, grown in 3D culture, were left untreated (Uninf.) or infected with the MC1TT strain (TT) at MOI 25:1 for the indicated period of time. Activation of the DNA damage response was assessed as described in Figure 3. Left panel: representative scanning confocal micrographs; right panel: quantification of the positive cells. Mean ± SD of three to seven independent experiments. One hundred cells were evaluated for each experiment for each cell line. Statistical analysis was performed using the Student t test, *p < .05; **p < .01; ***p < .001
Figure 8
Figure 8
Infection with genotoxic Salmonella promotes exit from quiescence of the 1CTA cells. 1CT and 1CTA cells, grown in 3D culture, were infected with the MC1 TT or MC1 ∆cdtB strain. Induction of proliferation status and DNA damage was assessed by immunofluorescence analysis, using antibodies specific for Ki67 and 53BP1, respectively, at the indicated time points. (a) Representative scanning confocal micrograph of infected 1CT and 1CTA cells grown in 3D culture stained with the anti‐Ki67 specific antibody (red). Nuclei were counterstained with DAPI (blue). Magnification 40×. The white asterisk indicates nuclei of fibroblasts embedded in the collagen matrix. (b) Quantification of cells positive for Ki67. (c) Quantification of cells positive for Ki67 (white bar) and double positive for both Ki67 and 53BP1 foci (black bar). Mean ± SEM of three to four independent experiments. Statistical analysis was performed using the Student t test. *,# p < .05; **,## p < .01; ***,### p < .001; ****,#### p < .0001. *comparison Ki67 positive cells, #comparison Ki67‐γH2AX double‐positive cells

References

    1. Amaro, A. , Chiara, S. , & Pfeffer, U. (2016). Molecular evolution of colorectal cancer: From multistep carcinogenesis to the big bang. Cancer Metastasis Reviews, 35(1), 63–74. 10.1007/s10555-016-9606-4 - DOI - PubMed
    1. Armaghany, T. , Wilson, J. D. , Chu, Q. , & Mills, G. (2012). Genetic alterations in colorectal cancer. Gastrointest Cancer Res, 5(1), 19–27. - PMC - PubMed
    1. Arthur, J. C. , Perez‐Chanona, E. , Muhlbauer, M. , Tomkovich, S. , Uronis, J. M. , Fan, T. J. , … Jobin, C. (2012). Intestinal inflammation targets cancer‐inducing activity of the microbiota. Science, 338(6103), 120–123. doi:science.1224820 [pii]. 10.1126/science.1224820 - DOI - PMC - PubMed
    1. Bjur, E. , Eriksson‐Ygberg, S. , Aslund, F. , & Rhen, M. (2006). Thioredoxin 1 promotes intracellular replication and virulence of Salmonella enterica serovar Typhimurium. Infection and Immunity, 74(9), 5140–5151. 10.1128/IAI.00449-06 - DOI - PMC - PubMed
    1. Blazkova, H. , Krejcikova, K. , Moudry, P. , Frisan, T. , Hodny, Z. , & Bartek, J. (2010). Bacterial intoxication evokes cellular senescence with persistent DNA damage and cytokine signalling. Journal of Cellular and Molecular Medicine, 14(1‐2), 357–367. doi: JCMM862 [pii]. 10.1111/j.1582-4934.2009.00862.x - DOI - PMC - PubMed

Publication types

MeSH terms