. 2019 May 6;7(1):72.
doi: 10.1186/s40168-019-0685-7.

Haem iron reshapes colonic luminal environment: impact on mucosal homeostasis and microbiome through aldehyde formation

Affiliations

Haem iron reshapes colonic luminal environment: impact on mucosal homeostasis and microbiome through aldehyde formation

Océane C B Martin et al. Microbiome. .

Abstract

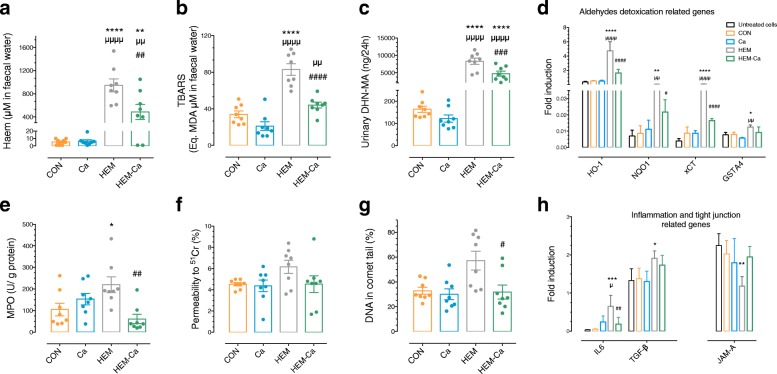
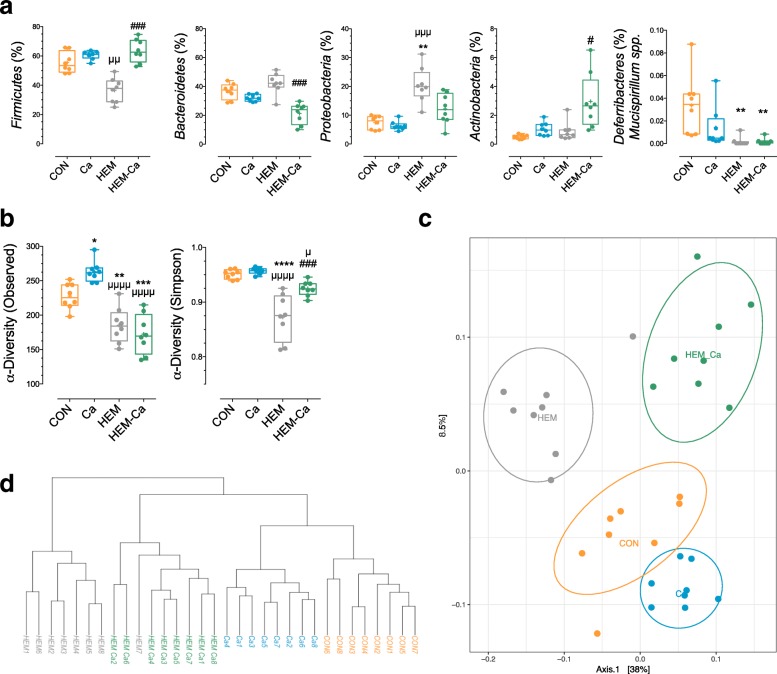
Background: The World Health Organization classified processed and red meat consumption as "carcinogenic" and "probably carcinogenic", respectively, to humans. Haem iron from meat plays a role in the promotion of colorectal cancer in rodent models, in association with enhanced luminal lipoperoxidation and subsequent formation of aldehydes. Here, we investigated the short-term effects of this haem-induced lipoperoxidation on mucosal and luminal gut homeostasis including microbiome in F344 male rats fed with a haem-enriched diet (1.5 μmol/g) 14-21 days.

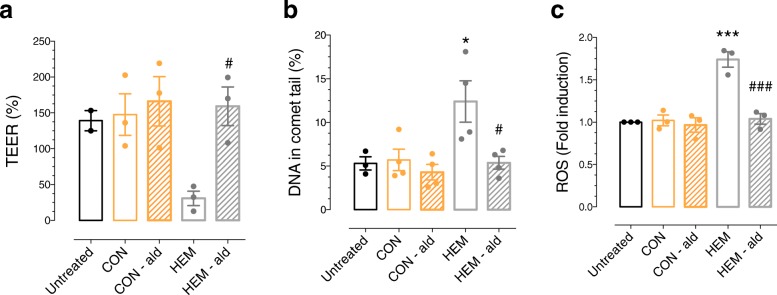
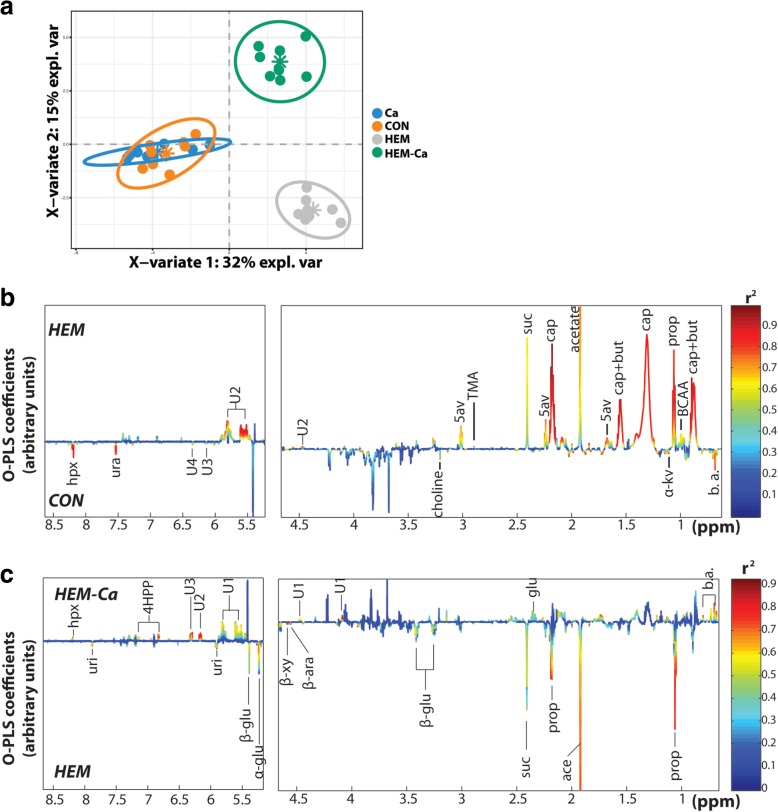
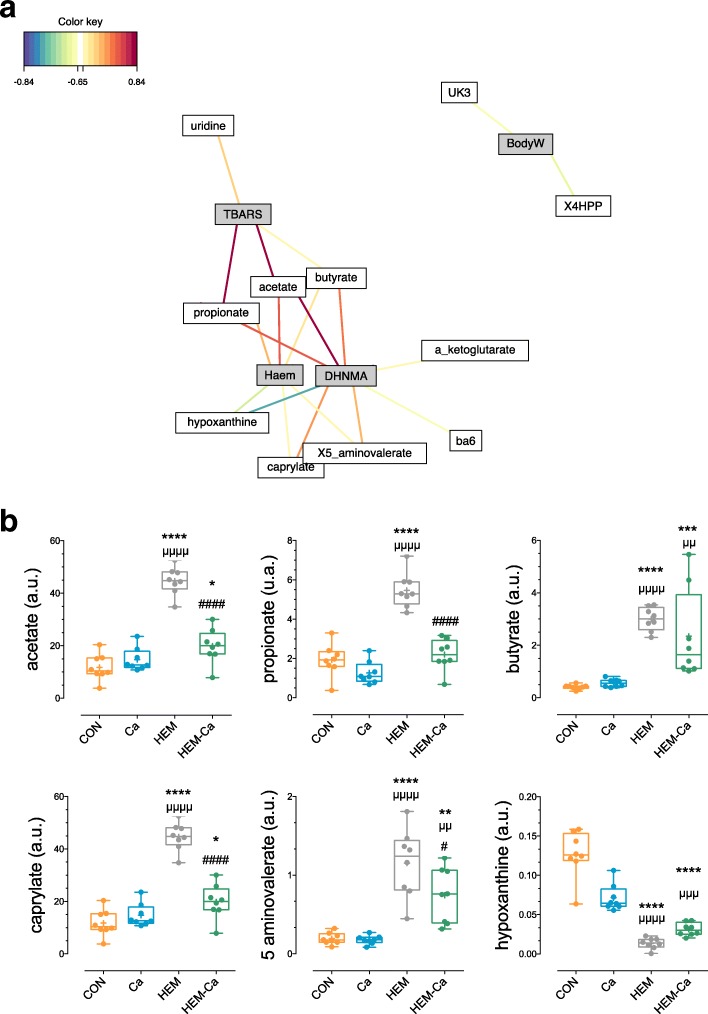
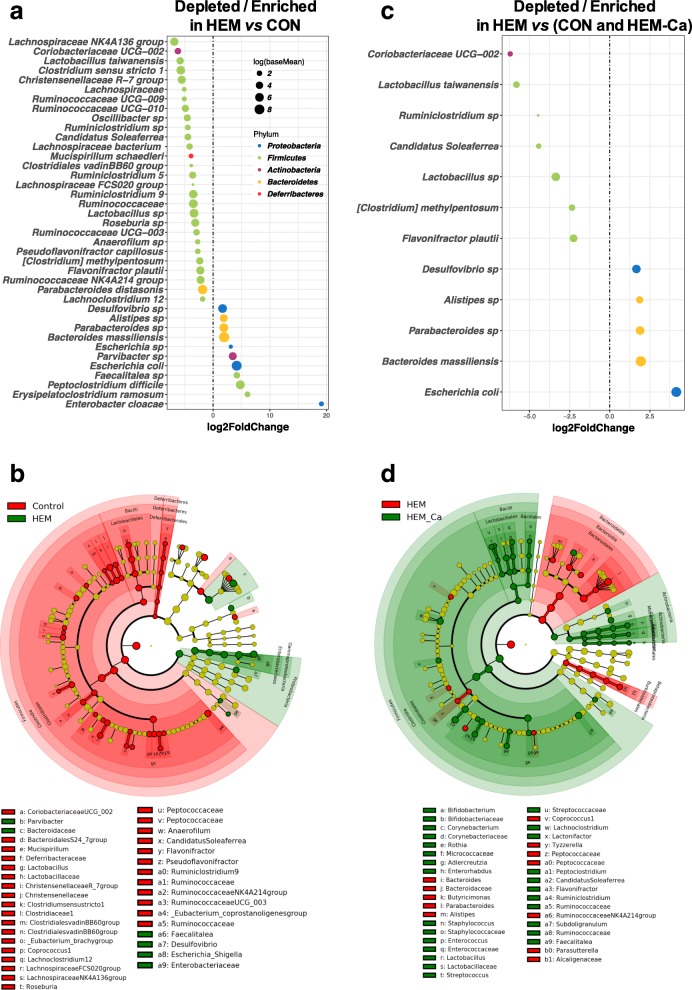
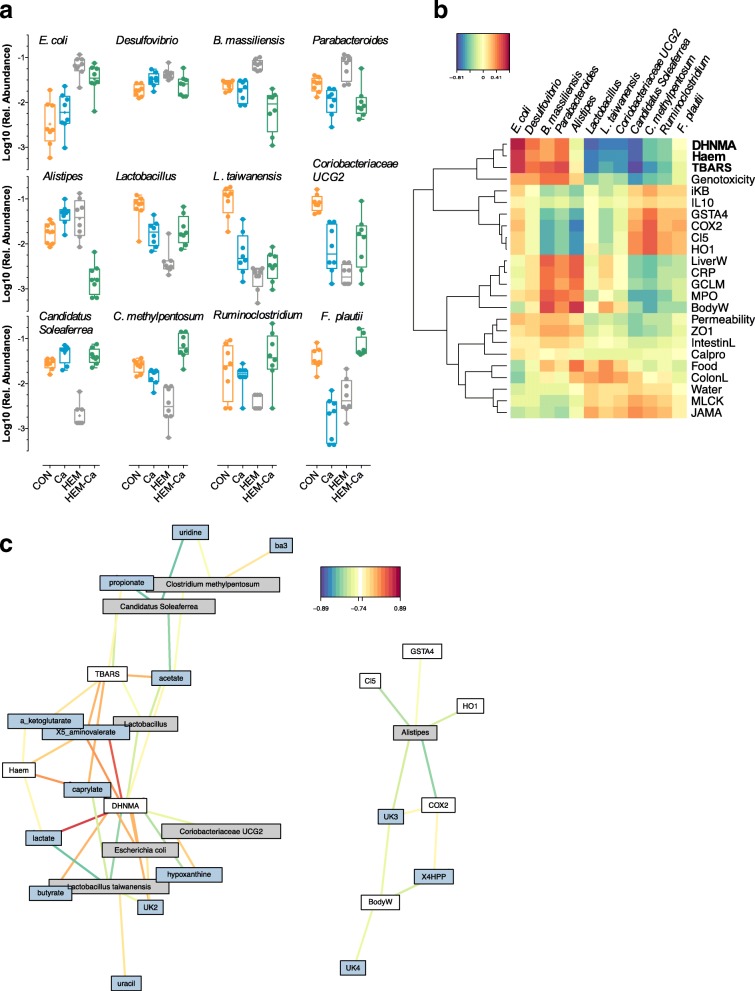
Results: Changes in permeability, inflammation, and genotoxicity observed in the mucosal colonic barrier correlated with luminal haem and lipoperoxidation markers. Trapping of luminal haem-induced aldehydes normalised cellular genotoxicity, permeability, and ROS formation on a colon epithelial cell line. Addition of calcium carbonate (2%) to the haem-enriched diet allowed the luminal haem to be trapped in vivo and counteracted these haem-induced physiological traits. Similar covariations of faecal metabolites and bacterial taxa according to haem-induced lipoperoxidation were identified.

Conclusions: This integrated approach provides an overview of haem-induced modulations of the main actors in the colonic barrier. All alterations were closely linked to haem-induced lipoperoxidation, which is associated with red meat-induced colorectal cancer risk.

Keywords: Barrier function; Dysbiosis; Lipoperoxidation; Meat; Metabolites.


Conflict of interest statement

Ethics approval and consent to participate

All experimental protocols were approved by the local Animal Care Use Committee (Comité d'Ethique Pharmacologie-Toxicologie de Toulouse, France), registered as no. 86 at the Ministry of Research, and conducted in accordance with the European directive 2010/63/UE and the ARRIVE guidelines for animal research.

Consent for publication

Not applicable.

Competing interests

OCB Martin was employed by the French Technical Center of Meat (ADIV). The other authors declare that they have no competing interests.

Publisher’s Note

Springer Nature remains neutral with regard to jurisdictional claims in published maps and institutional affiliations.

Figures

Fig. 1
Fig. 1
In vivo and ex vivo effects of the addition of haem and/or calcium carbonate on faecal, mucosal, and cellular biomarkers. After 21 days of experimental diets, effect on (a) faecal haem, (b) faecal TBARs, (c) urinary DHN-MA, (d) ex vivo expression of aldehyde detoxication-related genes, (e) colonic myeloperoxidase activity, (f) permeability, (g) DNA damage, and (h) ex vivo expression of cytokines and JAM-A genes. CON, control diet; Ca, control diet + calcium carbonate; HEM, haem-enriched diet; HEM-Ca, haem-enriched diet + calcium carbonate. Values are presented as means ± SEM; n = 8 for in vivo and n = 3 to 4 for ex vivo. ANOVA, Holm-Sidak’s multiple comparison test: *versus CON, μversus Ca, #versus HEM
Fig. 2
Fig. 2
Ex vivo effect of haem-enriched diet. Effect of faecal water from rats fed with control (CON) and haem-enriched (HEM) diets, before or after treatment with a polymer resin carrying hydrazine functional groups, which trap aldehydes, on (a) cellular trans-epithelial resistance, (b) DNA damage, and (c) reactive oxygen species formation on murine colonic epithelial cells. CON, control diet; HEM, haem-enriched diet; -ald, after aldehyde trapping. Values are presented as means ± SEM; n = 3 to 4. P < 0.05 using one-way ANOVA. Holm-Sidak’s multiple comparison test: *versus CON, #versus HEM
Fig. 3
Fig. 3
Metabolic profiling in faecal water of rats. a PLS-DA score plot. b, c Plot of O-PLS-DA coefficients related to the discrimination between 1H-NMR spectra for rats treated with b HEM (top) vs. Con (bottom), and c HEM-Ca (top) vs. HEM (bottom). Metabolites are colour-coded according to their correlation coefficient, with red indicating a very strong positive correlation (r2 > 0.7). The direction of the metabolite indicates the group with which it is positively associated as labelled on the diagrams. α-glu, α-glucose; ace, acetate; β-ara, β-arabinose; β-glu, β-glucose; β-xy, β-xylose; b.a., bile acids; BCAA, branched-chain amino acids; but, butyrate; cap, caprylate; hpx, hypoxanthine; prop, propionate; suc, succinate; TMA, trimethylamine; ura, uracil; uri, uridine; U1-4, unknown compounds; 4-HPP, 3-(4-hydroxyphenyl)propionic acid; 5av, 5-aminovalerate
Fig. 4
Fig. 4
Correlation between metabolomic and physiological data. a Relevance networks representing the stronger correlations (higher than 0.65) between 25 metabolites and 12 animal physiological traits (metadata) selected with rCCA. The edge colours indicate the nature of the correlation (positive in red, negative in blue). Metabolites and metadata are represented respectively as white and grey rectangles. b Boxplot of the area under the curve of the NMR spectra for selected metabolites that covariated with lipoperoxidation status. P < 0.05 using ANOVA. Holm-Sidak’s multiple comparison test: *versus CON, μversus Ca, #versus HEM. Haem, haem in faecal water; BodyW, body weight; UK3, unknown compound; 4HPP, 3-(4-hydroxyphenyl)propionic acid; ba6, unknown bile acid
Fig. 5
Fig. 5
Effect of dietary haem and/or calcium carbonate on the community distribution and diversity of the faecal microbiota as determined by 16S rRNA gene Illumina Miseq sequencing. a Relative abundance (%) per phylum according to diet. b Richness (α-diversity) measured by observed OTU number and Simpson Index according to diet. c Weighted UniFrac Multidimensional Scaling (MDS) plot representing structural changes between diets (β-diversity). d Hierarchical clustering based on the wUniFrac distances with complete linkage. CON, control diet; Ca, control diet + calcium carbonate; HEM, haem-enriched diet; HEM-Ca, haem-enriched diet + calcium carbonate. Values are presented as mean ± SEM; n = 8. P < 0.05 using ANOVA. Holm-Sidak’s multiple comparison test (b) or Kruskal-Wallis test with Dunn’s multiple comparison post-test (c): *versus CON, μversus Ca, #versus HEM
Fig. 6
Fig. 6
Differentially abundant faecal bacterial taxa in response to the addition of dietary haem and/or calcium carbonate. a Classified differentially abundant taxa between rats fed with a haem-enriched diet and control diet. Log2FoldChange (HEM vs. CON) = log2(HEM/CON) is plotted on the X-axis. Phylum is indicated using colour codes. Features were considered significant if their adjusted post-test P value was < 0.01 (haem effect against other three groups). b Circular cladogram generated from LEfSe analysis showing the most differentially abundant taxa enriched in microbiota from rats fed with control (red) or haem (green) diets. c Classified differentially abundant taxa between rats fed a haem-enriched diet and other diets. The taxa were identified using a 2 × 2 factor design by sorting the interaction term corresponding to haem-affected taxa, for which the addition of calcium restored the initial levels observed in the control diet. Log2FoldChange (HEM vs. (CON and HEM-Ca) = log2(HEM/(CON and HEM-Ca)) is plotted on the X-axis. Phylum is indicated by colour codes. Features were considered significant if the adjusted P value of the interaction term was < 0.01. d Cladogram showing the most differentially abundant taxa enriched in microbiota from rats fed with haem (red) or haem-calcium (green) diets. LDA scores > 3 and significance of alpha < 0.01 determined by Kruskal-Wallis test. Corresponding LDA scores are presented in Additional file 2: Figure S4
Fig. 7
Fig. 7
Bacterial communities that covariated with lipoperoxidation status and metabolites. a Relative abundance of bacterial taxa (12) that strongly covariated with haem lipoperoxidation status. b CIM of 12 previously selected bacterial taxa and 19 physiological traits (metadata) selected with rCCA. c Relevance network of 12 bacterial taxa, metadata, and metabolites selected with DIABLO framework. Only associations with an absolute correlation > 0.75 are represented. Red and blue colours indicate regions where bacterial taxa, metadata, and metabolites are highly positively and negatively correlated, respectively. CON, control diet; Ca, control diet + calcium carbonate; HEM, haem-enriched diet; HEM-Ca, haem-enriched diet + calcium carbonate; DHNMA, urinary 1,4 dihydroxynonenal; Haem, haem in faecal water; TBARS, faecal thiobarbituric reactive substances; Genotoxicity, DNA damage by comet assay; iKB, ikappaB; IL10, IL10 in serum; GSTA4, gene expression of glutathione S-transferase alpha 4; COX2, cyclooxygenase2; Cl5, claudin 5; HO1, Haemoxygenase1; LiverW, weight of liver; CRP, C-reactive protein; GCLM, glutamate-cysteine ligase modifier; MPO, myeloperoxidase; BodyW, body weight; Permeability, Cr51 permeability; ZO1, tight junction protein 1; IntestinL, intestine length; Calpro, Calprotectin; Food, food intake; Colon L, colon length; Water, water intake; MLCK, myosin light-chain kinase; JAMA, junctional adhesion molecule; UK2-4, unknown compounds; 4HPP, 3-(4-hydroxyphenyl)propionic acid; ba3, unknown bile acid

References

    1. Bouvard Véronique, Loomis Dana, Guyton Kathryn Z, Grosse Yann, Ghissassi Fatiha El, Benbrahim-Tallaa Lamia, Guha Neela, Mattock Heidi, Straif Kurt. Carcinogenicity of consumption of red and processed meat. The Lancet Oncology. 2015;16(16):1599–1600. doi: 10.1016/S1470-2045(15)00444-1. - DOI - PubMed
    1. Abid Z, Cross AJ, Sinha R. Meat, dairy, and cancer. Am J Clin Nutr. 2014;100:386S–393S. doi: 10.3945/ajcn.113.071597. - DOI - PMC - PubMed
    1. Bastide NM, Pierre FHF, Corpet DE. Heme iron from meat and risk of colorectal cancer: a meta-analysis and a review of the mechanisms involved. Cancer Prev Res (Phila). 2011;4:177–184. doi: 10.1158/1940-6207.CAPR-10-0113. - DOI - PubMed
    1. Bastide NM, Chenni F, Audebert M, Santarelli RL, Taché S, Naud N, et al. A central role for heme iron in colon carcinogenesis associated with red meat intake. Cancer Res. 2015;75:870–879. doi: 10.1158/0008-5472.CAN-14-2554. - DOI - PubMed
    1. Bastide N, Morois S, Cadeau C, Kangas S, Serafini M, Gusto G, et al. Heme iron intake, dietary antioxidant capacity, and risk of colorectal adenomas in a large cohort study of French women. Cancer Epidemiol Biomarkers Prev. 2016;25:640–647. doi: 10.1158/1055-9965.EPI-15-0724. - DOI - PubMed

Publication types