

Modeling the impact of quarantine during an outbreak of Ebola virus disease
- PMID: 30828672
- PMCID: PMC6382747
- DOI: 10.1016/j.idm.2019.01.003
Modeling the impact of quarantine during an outbreak of Ebola virus disease
Abstract
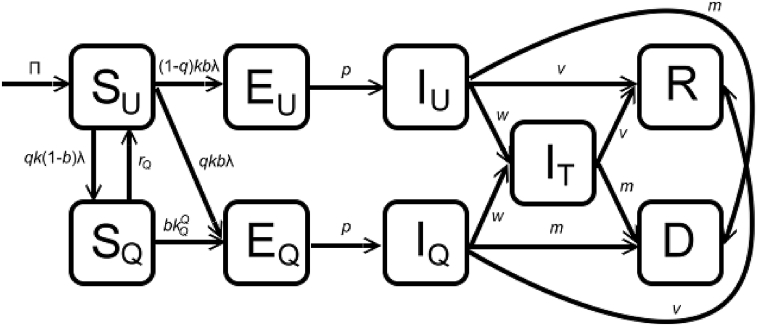
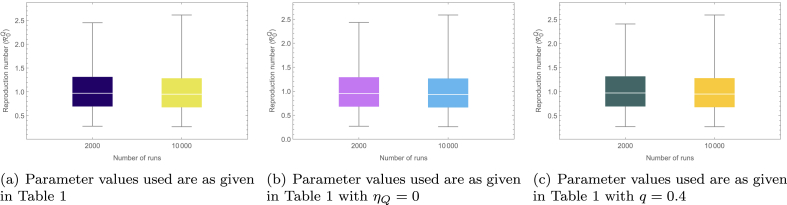
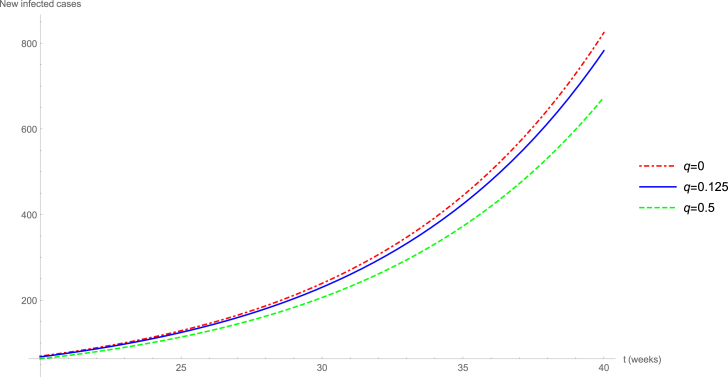
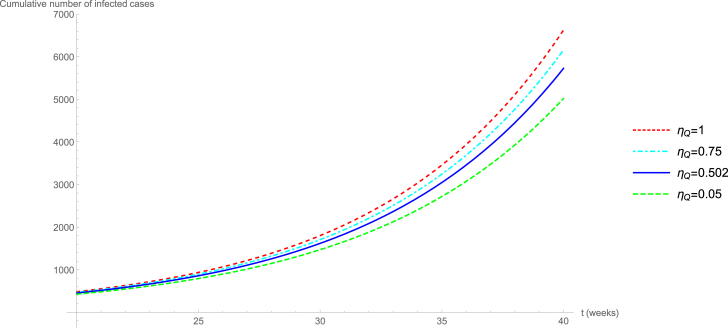
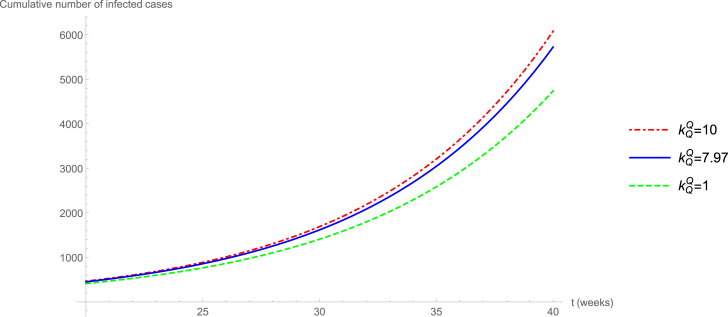
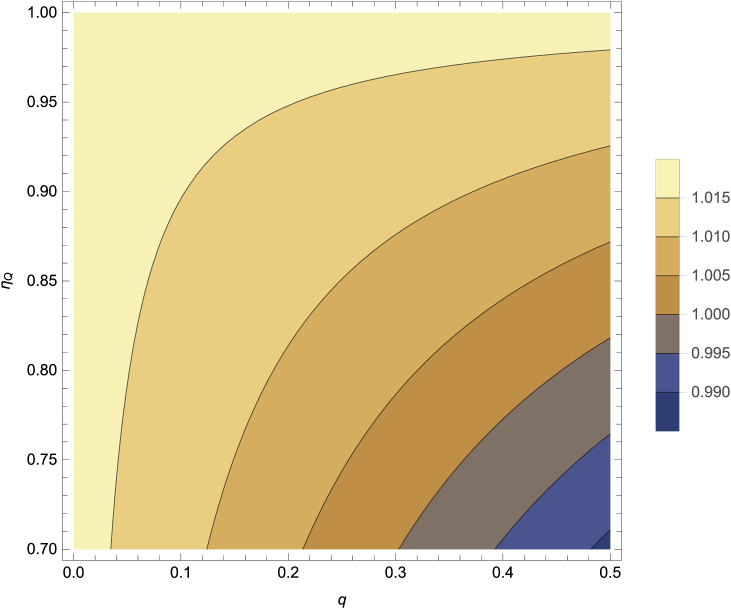
The quarantine of people suspected of being exposed to an infectious agent is one of the most basic public health measure that has historically been used to combat the spread of communicable diseases in human communities. This study presents a new deterministic model for assessing the population-level impact of the quarantine of individuals suspected of being exposed to disease on the spread of the 2014-2015 outbreaks of Ebola viral disease. It is assumed that quarantine is imperfect (i.e., individuals can acquire infection during quarantine). In the absence of quarantine, the model is shown to exhibit global dynamics with respect to the disease-free and its unique endemic equilibrium when a certain epidemiological threshold (denoted by ) is either less than or greater than unity. Thus, unlike the full model with imperfect quarantine (which is known to exhibit the phenomenon of backward bifurcation), the version of the model with no quarantine does not undergo a backward bifurcation. Using data relevant to the 2014-2015 Ebola transmission dynamics in the three West African countries (Guinea, Liberia and Sierra Leone), uncertainty analysis of the model show that, although the current level and effectiveness of quarantine can lead to significant reduction in disease burden, they fail to bring the associated quarantine reproduction number ( ) to a value less than unity (which is needed to make effective disease control or elimination feasible). This reduction of is, however, very possible with a modest increase in quarantine rate and effectiveness. It is further shown, via sensitivity analysis, that the parameters related to the effectiveness of quarantine (namely the parameter associated with the reduction in infectiousness of infected quarantined individuals and the contact rate during quarantine) are the main drivers of the disease transmission dynamics. Overall, this study shows that the singular implementation of a quarantine intervention strategy can lead to the effective control or elimination of Ebola viral disease in a community if its coverage and effectiveness levels are high enough.
Keywords: Ebola virus disease; Global dynamics; Quarantine.
Figures

References
-
- Blower S.M., Dowlatabadi H. Sensitivity and uncertainty analysis of complex models of disease transmission: An HIV model, as an example. International Statistical Review. 1994;62:229–243.
-
- Bowen E.T.W., Platt G.S., Lloyd G., Baskerville A., Harris W.J., Vella E.E. Viral haemorrhagic fever in southern Sudan and northern Zaire. Preliminary studies on the aetiological agent. Lancet. 1977;309:571–573. - PubMed
LinkOut - more resources
Full Text Sources
