. 2019 Jan 2;6(1):181695.
doi: 10.1098/rsos.181695. eCollection 2019 Jan.

Epidemiology of a bubonic plague outbreak in Glasgow, Scotland in 1900

Affiliations

Epidemiology of a bubonic plague outbreak in Glasgow, Scotland in 1900

Katharine R Dean et al. R Soc Open Sci. .

Abstract

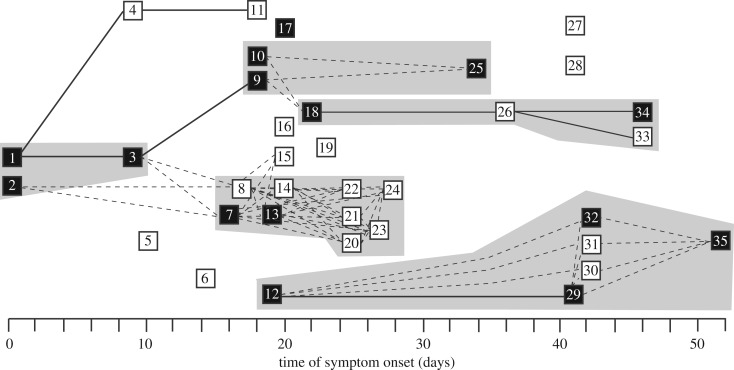
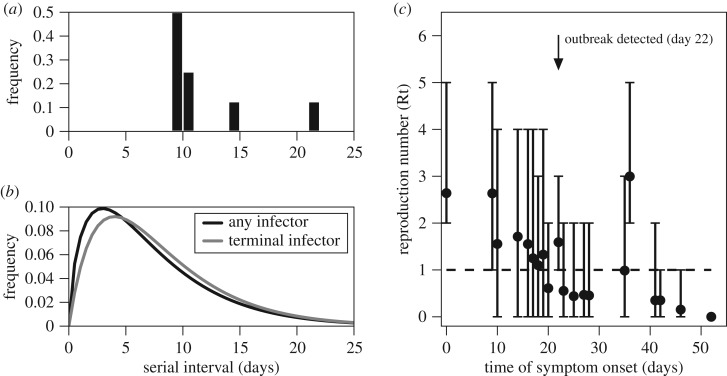
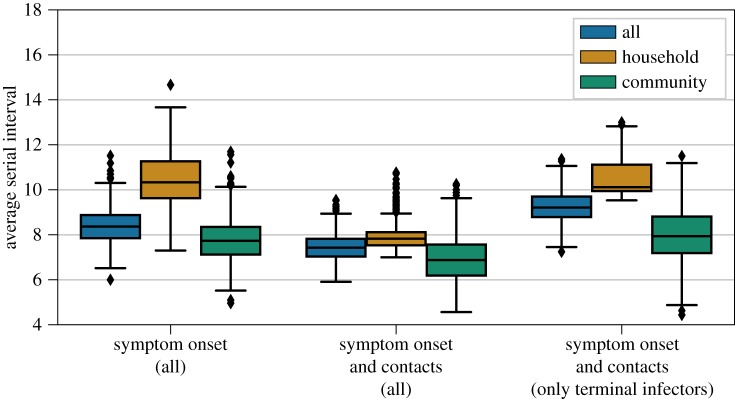
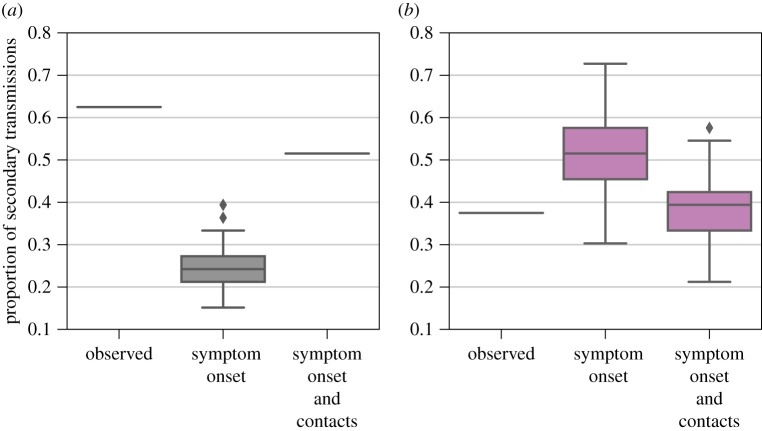
On 3 August 1900, bubonic plague (Yersinia pestis) broke out in Glasgow for the first time during the Third Pandemic. The local sanitary authorities rigorously tracked the spread of the disease and they found that nearly all of the 35 cases could be linked by contact with a previous case. Despite trapping hundreds of rats in the area, there was no evidence of a rat epizootic and the investigators speculated that the outbreak could be due to human-to-human transmission of bubonic plague. Here we use a likelihood-based method to reconstruct transmission trees for the outbreak. From the description of the outbreak and the reconstructed trees, we infer several epidemiological parameters. We found that the estimated mean serial interval was 7.4-9.2 days and the mean effective reproduction number dropped below 1 after implementation of control measures. We also found a high rate of secondary transmissions within households and observations of transmissions from individuals who were not terminally septicaemic. Our results provide important insights into the epidemiology of a bubonic plague outbreak during the Third Pandemic in Europe.

Keywords: Third Pandemic; Yersinia pestis; human ectoparasite transmission; reproduction number; serial interval.


Conflict of interest statement

The authors declare no competing interests.

Figures

Figure 1.
Figure 1.
Recorded transmission events during a plague outbreak in Glasgow, Scotland, from 3 August 1900 to 24 September 1900. Cases are represented by squares (solid = dead) and ordered by the date of symptom onset. Solid lines indicate transmission events between cases with a known infector. For cases without a known infector, dashed lines indicate reported contacts between cases. Grey shaded boxes indicate cases in the same household.
Figure 2.
Figure 2.
Reconstruction of transmission events for a plague outbreak in Glasgow, Scotland, from 3 August 1900 to 24 September 1900. (a) Relative frequency of the serial intervals, based on eight observed transmission events, (b) Relative frequency of the serial intervals, based on 8 observed transmission events and 27 reconstructed transmission events. The black line shows the distribution with any infector, mean = 7.4 days [95% CI: 6.5, 8.6]. The grey line shows the distribution with only terminally ill infectors, mean = 9.2 days [95% CI: 7.9, 10.6]. (c) Average effective reproduction number (Re(t)) per day (dots) and 95% bootstrap percentile confidence interval (bars).
Figure 3.
Figure 3.
Average serial interval for all cases, community cases and household cases in 1000 simulated trees reconstructed using only the symptom onset dates, the symptom onset dates and the contact information with any infector, and the symptom onset dates and contact information with only terminally ill infectors.
Figure 4.
Figure 4.
Proportion of secondary cases arising from (a) primary cases within the same household for observed pairs, simulated trees using only symptom onset information and simulated trees using symptom onset and contact information, and (b) primary cases that ultimately recovered from their infection for observed pairs, simulated trees using only symptom onset information and simulated trees using symptom onset and contact information.

References

    1. Morelli G, et al. 2012. Yersinia pestis genome sequencing identifies patterns of global phylogenetic diversity. Nat. Genet. 42, 1140–1143. (10.1038/ng.705) - DOI - PMC - PubMed
    1. Dennis DT, Gage KL, Gratz NG, Poland JD, Tikhomirov E. 1999. Plague manual: epidemiology, distribution, surveillance and control, pp. 1–72. Geneva, Switzerland: World Health Organization.
    1. Migliani R, Chanteau S, Rahalison L, Ratsitorahina M, Boutin JP, Ratsifasoamanana L, Roux J. 2006. Epidemiological trends for human plague in Madagascar during the second half of the 20th century: a survey of 20,900 notified cases. Trop. Med. Int. Health 11, 1228–1237. (10.1111/j.1365-3156.2006.01677.x) - DOI - PubMed
    1. Kugeler KJ, Staples JE, Hinckley AF, Gage KL, Mead PS. 2015. Epidemiology of human plague in the United States, 1900–2012. Emerg. Infect. Dis. 21, 16–22. (10.3201/eid2101.140564) - DOI - PMC - PubMed
    1. Gage KL, Kosoy MY. 2004. Natural history of plague: perspectives from more than a century of research. Annu. Rev. Entomol. 50, 505–528. (10.1146/annurev.ento.50.071803.130337) - DOI - PubMed

LinkOut - more resources