

Gait Pattern and Motor Performance During Discrete Gait Perturbation in Children With Autism Spectrum Disorders
- PMID: 30618953
- PMCID: PMC6297554
- DOI: 10.3389/fpsyg.2018.02530
Gait Pattern and Motor Performance During Discrete Gait Perturbation in Children With Autism Spectrum Disorders
Abstract
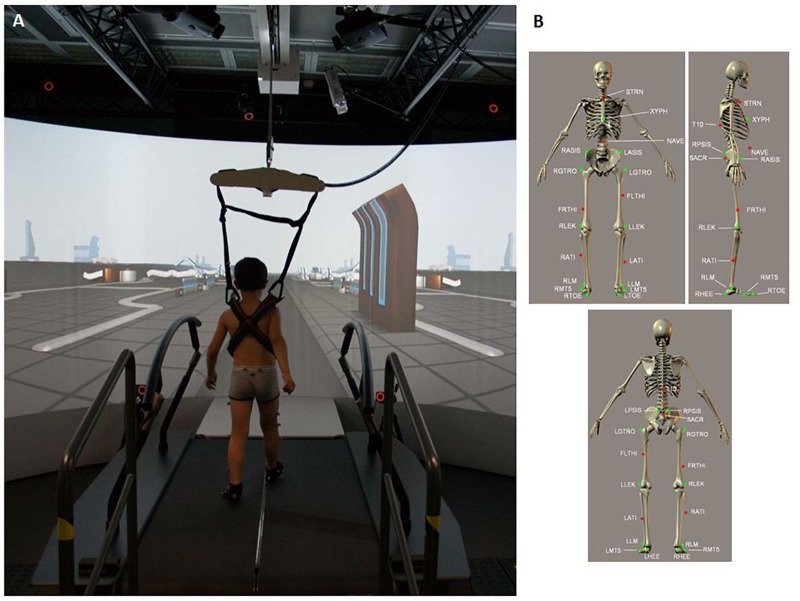
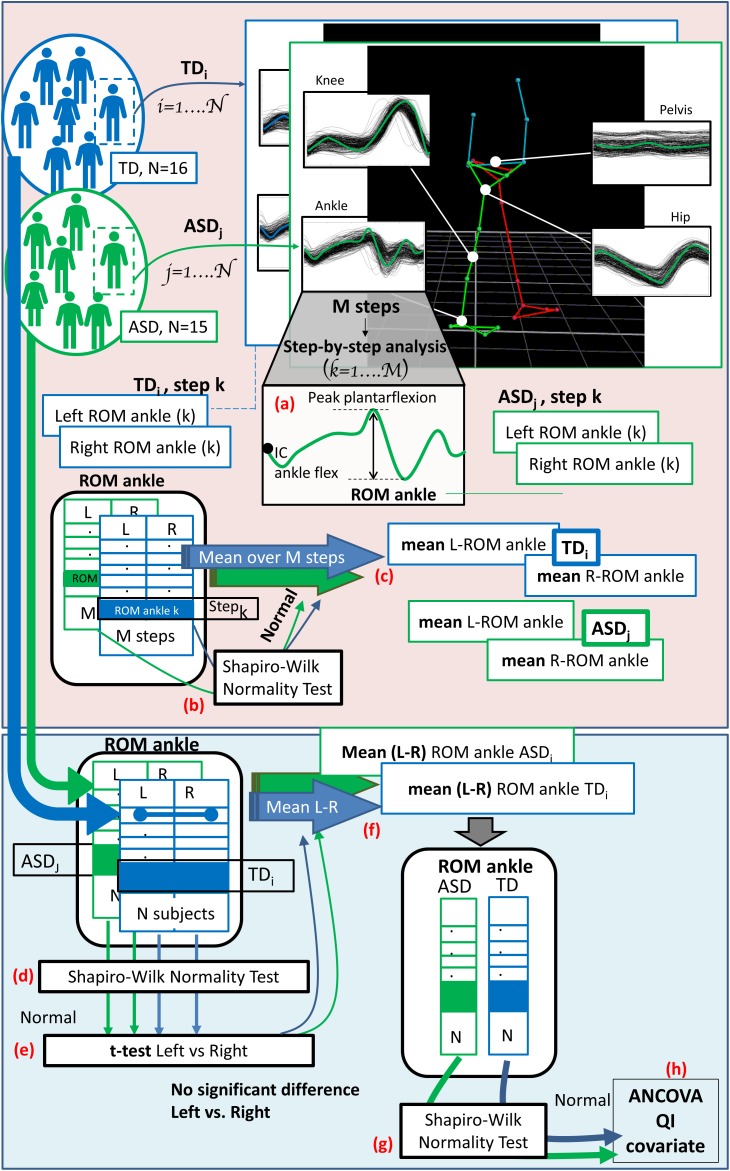
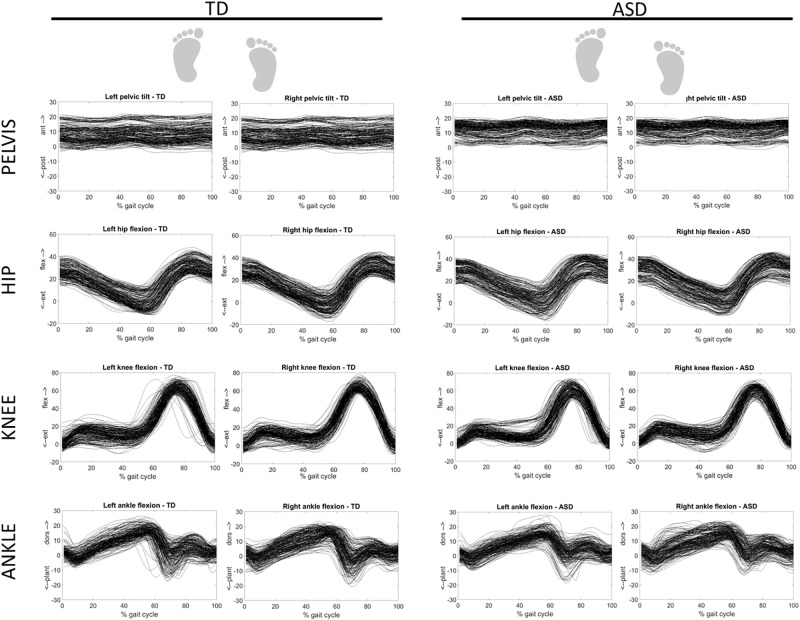
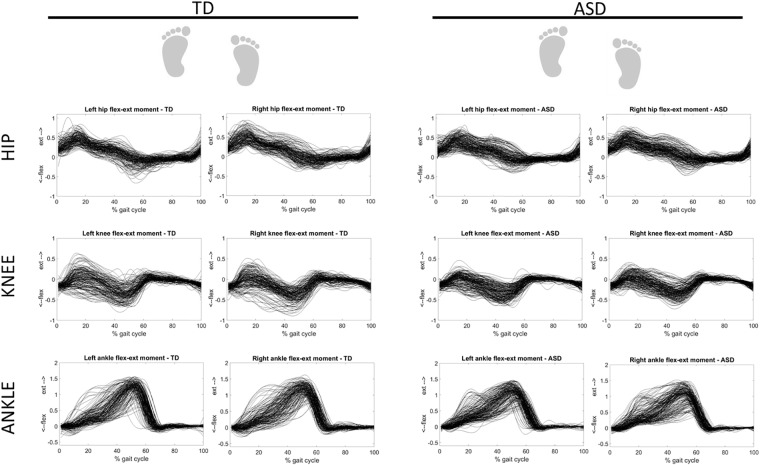
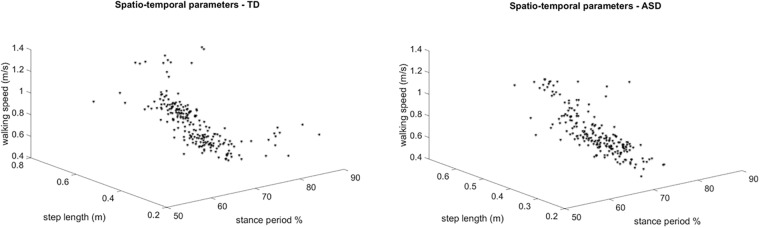
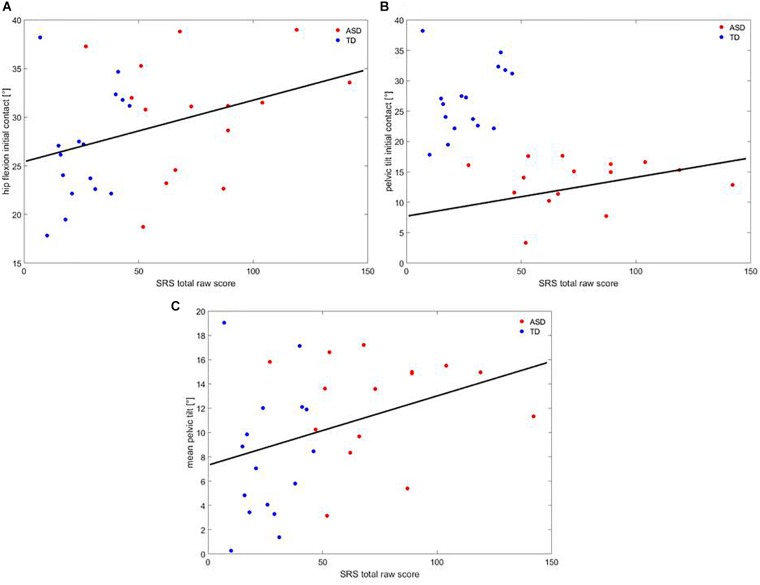
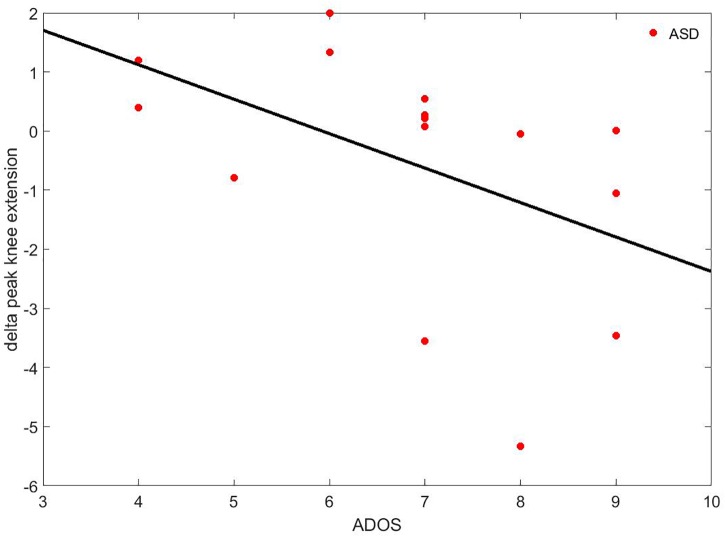
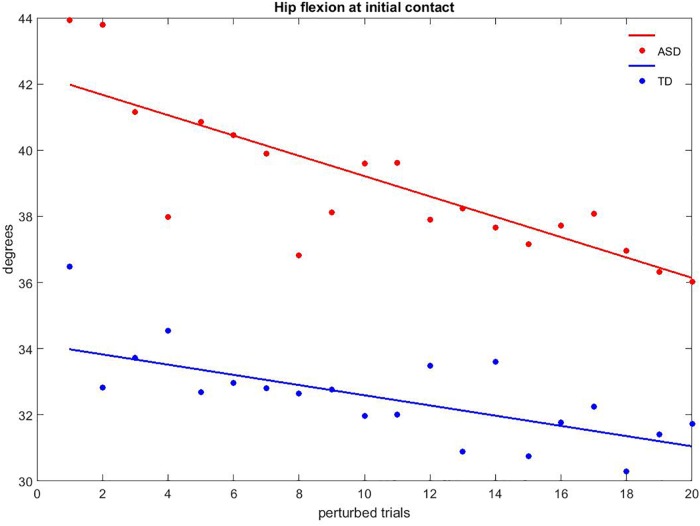
Quantitative evaluation of gait has been considered a useful tool with which to identify subtle signs of motor system peculiarities in autism spectrum disorder (ASD). However, there is a paucity of studies reporting gait data in ASD as well as investigating learning processes of locomotor activity. Novel advanced technologies that couple treadmills with virtual reality environments and motion capture systems allows the evaluation of gait patterns on multiple steps and the effects of induced gait perturbations, as well as the ability to manipulate visual and proprioceptive feedbacks. This study aims at describing the gait pattern and motor performance during discrete gait perturbation of drug-naïve, school-aged children with ASD compared to typically developing (TD) peers matched by gender and age. Gait analysis was carried out in an immersive virtual environment using a 3-D motion analysis system with a dual-belt, instrumented treadmill. After 6 min of walking, 20 steps were recorded as baseline. Then, each participant was exposed to 20 trials with a discrete gait perturbation applying a split-belt acceleration to the dominant side at toe-off. Single steps around perturbations were inspected. Finally, 20 steps were recorded during a post-perturbation session. At baseline, children with ASD had reduced ankle flexion moment, greater hip flexion at the initial contact, and greater pelvic anteversion. After the discrete gait perturbation, variations of peak of knee extension significantly differed between groups and correlated with the severity of autistic core symptoms. Throughout perturbation trials, more than 60% of parameters showed reliable adaptation with a decay rate comparable between groups. Overall, these findings depicted gait peculiarities in children with ASD, including both kinetic and kinematic features; a motor adaptation comparable to their TD peers, even though with an atypical pattern; and a motor adaptation rate comparable to TD children but involving different aspects of locomotion. The platform showed its usability with children with ASD and its reliability in the definition of paradigms for the study of motor learning while doing complex tasks, such as gait. The additional possibility to accurately manipulate visual and proprioceptive feedback will allow researchers to systematically investigate motor system features in people with ASD.
Keywords: autism spectrum disorder; dual-belt treadmill; gait analysis; motor adaptation; virtual reality.
Figures
References
-
- Ambrosini D., Courchesne E., Kaufman K. (1998). Motion analysis of patients with infantile autism. Gait Posture 7:188 10.1016/S0966-6362(98)90288-0 - DOI
-
- American Psychiatric Association (2000). Diagnostic and Statistical Manual of Mental Disorders, 4th Edn. Washington, DC: American Psychiatric Association.
-
- American Psychiatric Association (2013). Diagnostic and Statistical Manual of Mental Disorders, 5th Edn. Arlington, VA: American Psychiatric Association; 10.1176/appi.books.9780890425596 - DOI
-
- Asperger H. (1944). Die “Autistischen Psychopathen” im Kindesalter. Eur. Arch. Psychiatry Clin. Neurosci. 117 76–136. 10.1007/BF01837709 - DOI
LinkOut - more resources
Full Text Sources
Medical