. 2018 Jun 25;9(1):2470.
doi: 10.1038/s41467-018-04926-x.

Antifungal tolerance is a subpopulation effect distinct from resistance and is associated with persistent candidemia

Affiliations

Antifungal tolerance is a subpopulation effect distinct from resistance and is associated with persistent candidemia

Alexander Rosenberg et al. Nat Commun. .

Abstract

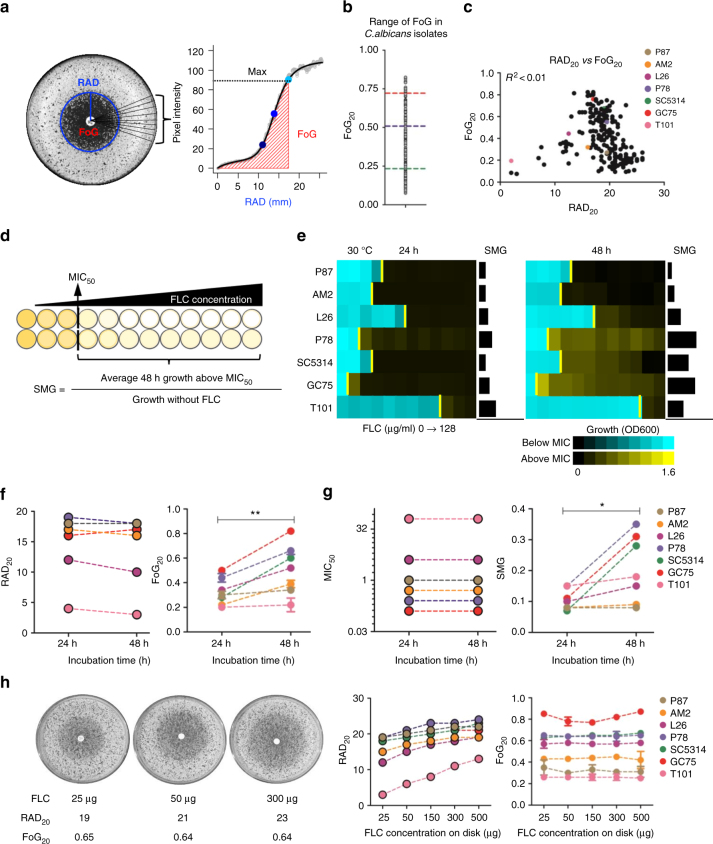
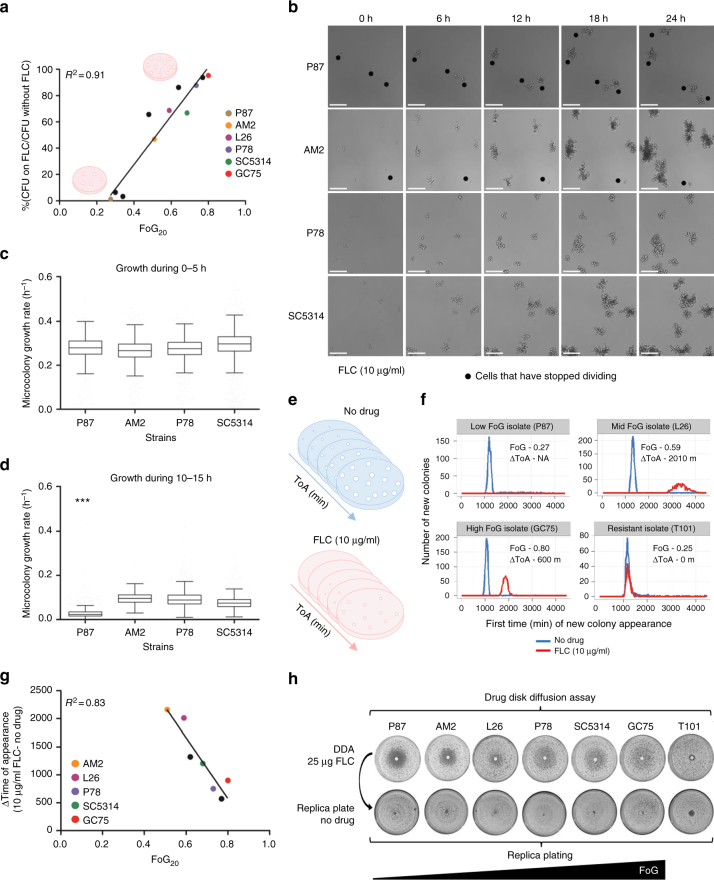
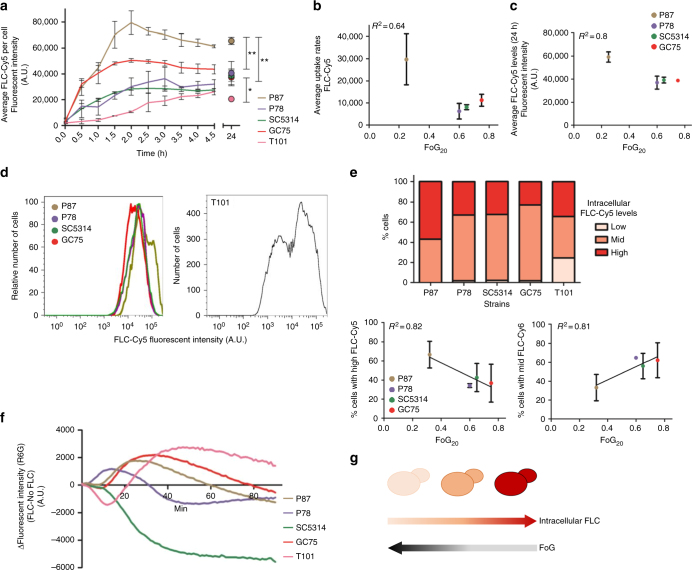
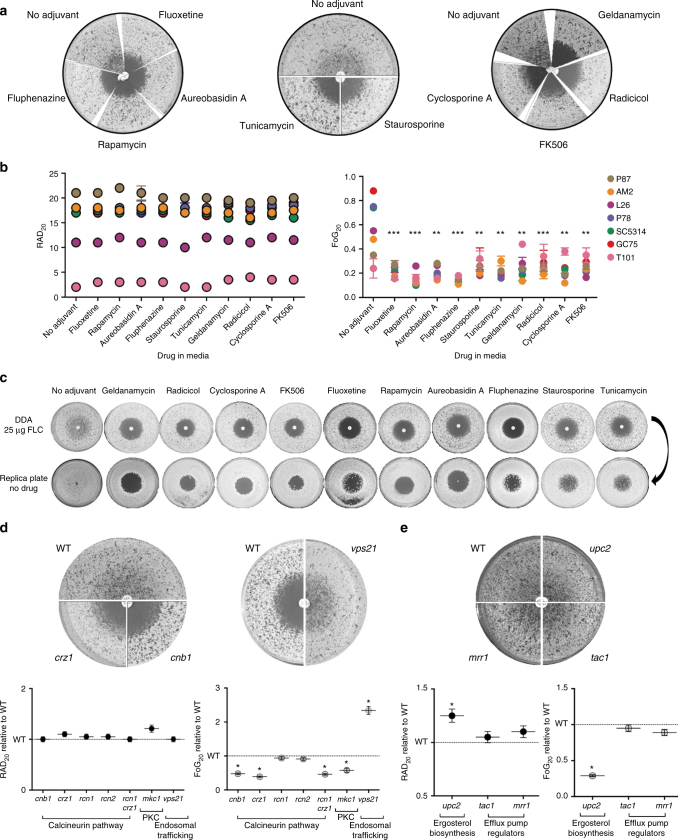
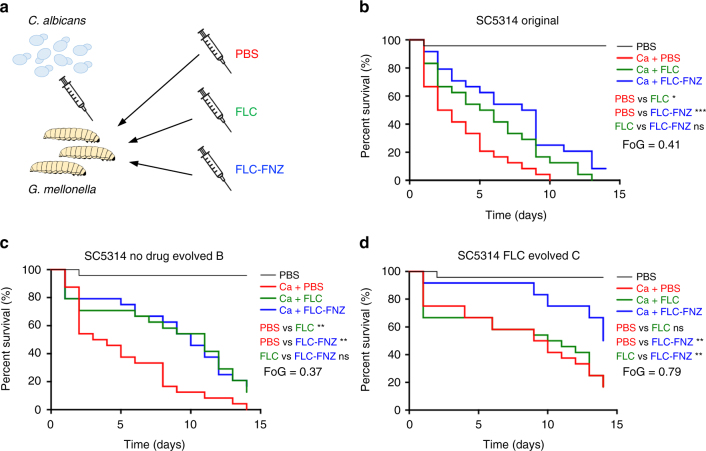
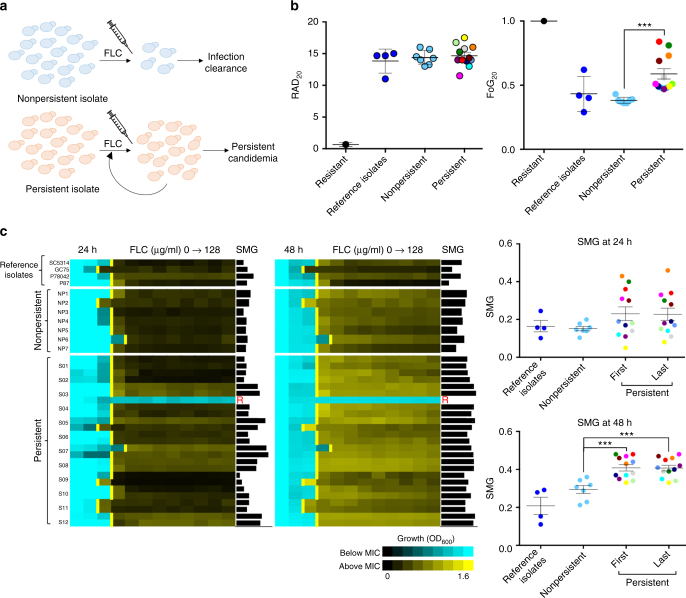
Tolerance to antifungal drug concentrations above the minimal inhibitory concentration (MIC) is rarely quantified, and current clinical recommendations suggest it should be ignored. Here, we quantify antifungal tolerance in Candida albicans isolates as the fraction of growth above the MIC, and find that it is distinct from susceptibility/resistance. Instead, tolerance is due to the slow growth of subpopulations of cells that overcome drug stress more efficiently than the rest of the population, and correlates inversely with intracellular drug accumulation. Many adjuvant drugs used in combination with fluconazole, a widely used fungistatic drug, reduce tolerance without affecting resistance. Accordingly, in an invertebrate infection model, adjuvant combination therapy is more effective than fluconazole in treating infections with highly tolerant isolates and does not affect infections with low tolerance isolates. Furthermore, isolates recovered from immunocompetent patients with persistent candidemia display higher tolerance than isolates readily cleared by fluconazole. Thus, tolerance correlates with, and may help predict, patient responses to fluconazole therapy.


Conflict of interest statement

A.L.C. has received educational grants from Pfizer, Gilead Sciences, United Medical (Brazil), MSD, and TEVAS, and a research grant from Astellas and Pfizer. The remaining authors declare no competing interests.

Figures

Fig. 1
Fig. 1
Measuring drug responses in disk diffusion assays (DDAs) and in liquid broth microdilution assays (BMDAs). a diskImageR analysis measures pixel intensity corresponding to cell density, along 72 radii every 5°. The average radius (RAD) represents the distance in mm corresponding to the point where 20%, 50%, or 80% growth reduction occurs (light, medium, dark blue dots). The fraction of growth inside the zone of inhibition (FoG) is the area under the curve (red) at the RAD threshold, divided by the maximum area. b Range of FoG levels in 219 C. albicans clinical isolates. Red, blue, and green lines estimate high, medium, and low FoG levels, respectively. Unless otherwise specified, DDAs were performed using a single 25 µg FLC disk and analyzed after 48 h at 30 °C. c Comparison of FoG20 and RAD20 for the 219 isolates. d Illustration of MIC and supra-MIC growth (SMG) calculations. MIC50 was calculated at 24 h as the FLC concentration at which 50% of the growth was inhibited, relative to growth in the absence of drug. SMG was calculated as the average growth per well above the MIC divided by the level of growth without drug. FLC was used in two-fold dilutions (0, 0.125 to 128 μg/ml). e Heatmaps illustrating OD600 levels for concentrations below the MIC (yellow bar) in cyan and above the MIC in yellow for the isolates from Fig. 1c. Maps show OD600 values at 24 and 48 h. f, g Effect of incubation time on RAD/MIC and FoG/SMG values. diskImageR analysis (f) and corresponding MIC and SMG levels (g) measured at 24 and 48 h for strains as in d. Of note, for truly drug-resistant strains such as T101 (MIC = 64, e), the small zone of inhibition makes FoG measurements less accurate than SMG levels. h RAD is concentration-dependent and FoG is concentration-independent as illustrated for strain SC5314 exposed to disks containing increasing concentrations of FLC (25, 50 and 300 µg) (left); RAD (middle) and FoG (right) levels for strains as listed. For all panels, n ≥ 2; ** P < 0.01; *P < 0.05
Fig. 2
Fig. 2
Analysis of cells growing at supra-MIC concentrations. All tested strains, except for T101 (MIC = 64 µg/ml), had FLC MIC values below 10 µg/ml. a FoG correlates with the proportion of colonies that grow on 10 µg/ml FLC relative to growth on plates without drug. Black dots are additional strains from Fig. 1c. b Microcolony analysis at supra-MIC concentrations of FLC (10 µg/ml). Symbols indicate cells that have stopped dividing in the presence of drug over 24 h, scale bars = 100 µm. On average, strain AM2 formed fewer microcolonies than strain SC5314, but these were larger than those formed by SC5314. Time-lapse videos are available as Supplementary Movies 1–4. c, d Growth rate analysis of cells growing at supra-MIC FLC (10 µg/ml) during 0–5 h (c) and 10–15 h (d). e Schematic of ScanLag analysis that measures time of colony appearance (ToA), colony growth rate, and colony size using desktop scanners. f ToA on medium without drug (blue) or with 10 µg/ml FLC (red) for resistant isolate T101, and isolates with different FoG levels. Graphs show the number of colonies (y-axis) at each time point (x-axis). Additional isolates are included in Supplementary Fig. 4. g Correlation between FoG20 and the difference (Δ) in the ToA of colonies in the presence vs. absence of FLC (ΔToA = ToA with FLC – ToA without FLC). Black dots are additional strains from Fig. 1c. h Cells that grow within the zone of inhibition are viable, as seen by replica plating of disk diffusion assays grown on casitone without FLC and incubated at 30 °C for 48 h. For all panels, n ≥ 2; ***P < 0.001; error bars denote standard deviations
Fig. 3
Fig. 3
Uptake, efflux and steady-state intracellular concentrations of FLC-Cy5. a Average intracellular FLC-Cy5 uptake per cell. Uptake curves for 0–5 h and for steady-state FLC-Cy5 per cell at 24 h measured by flow cytometry. b, c Correlation between FoG20 and uptake rate of FLC-Cy5 between 0.5 and 1.5 h (b) and intracellular FLC-Cy5 at 24 h (c). d Intracellular FLC-Cy5 fluorescent intensity at 24 h for four strains with similar MIC and diverse FoG levels (left) and for the resistant strain T101 (right) normalized for number of cells (n = 15863 for P87, 15075 of P78, 22406 for SC5314, 18186 for GC75). e The proportion of cells (%) with FLC-Cy5 levels at 24 h was divided into thirds: Low (391–422 A.U.), Mid (3912–34,643 A.U.), and High (3.5 × 104–3.14 × 105 A.U.) (upper panel). Proportion of cells (%) with high (lower left panel) or mid (lower right panel) intracellular FLC-Cy5 concentration at 24 h vs. FoG20 levels of the strains. f Efflux of Rhodamine 6G (R6G) normalized by culture density (OD600). Efflux curves represent data from one (of two) experiment and the curves show fluorescence intensity recorded over 90 min and calculated as follows: Δ[FLC(with glucose − without glucose) − no drug(with glucose − without glucose)]. g Cartoon illustrates the steady-state drug levels in cells with high to low FoG levels. For all panels, n ≥ 2; **P < 0.01; *P < 0.05, error bars denote standard deviations
Fig. 4
Fig. 4
Adjuvant drugs significantly reduce FLC tolerance but not resistance and render FLC cidal. a Disk diffusion assays performed with 25 µg FLC on casitone plates supplemented with adjuvant drugs 20 µg/ml fluoxetine, 5 ng/ml aureobasidin A, 0.5 ng/ml rapamycin, 10 µg/ml fluphenazine, 12.5 ng/ml staurosporine, 0.25 µg/ml tunicamycin, Hsp90 inhibitors (0.5 µg/ml geldanamycin and 0.5 µg/ml radicicol), and calcineurin inhibitors (0.5 µg/ml FK506 and 0.4 µg/ml cyclosporine A) shown for strain SC5314. b RAD and FoG levels performed on disk diffusion assays with FLC and adjuvants. c Effect of drug adjuvants and pathways inhibitors on the viability of cells growing inside the zone of inhibition. FLC disk diffusion assays of SC5314 without or with adjuvant were replica plated (after removal of the drug disk) onto casitone plates (without FLC or adjuvants) and incubated at 30 °C for 48 h. d, e FLC disk diffusion assays performed using a series of mutants carrying deletions in genes encoding the calcineurin subunit Cnb1, the calcineurin-responsive transcription factor Crz1, calcineurin regulators Rcn1 and Rcn2, MAP kinase Mkc1, vacuolar trafficking protein Vps21 (d), ergosterol biosynthesis regulator Upc2, and efflux pump regulators Tac1 and Mrr1 (e). These mutants as well as the rcn1 crz1 double mutant were analyzed by diskImageR, and RAD and FoG levels are shown relative to the isogenic parental strains (WT). All pictures in this figure are representative of two biological replicates, asterisks denote significant differences relative to corresponding parental strains. For all panels, n ≥ 2; ***P < 0.001; **P < 0.01; *P < 0.05, error bars denote standard deviations
Fig. 5
Fig. 5
Combination therapy partially rescues systemic infection of G. mellonella by high FoG C. albicans isolates. a G. mellonella larvae were injected with 3 × 105 yeast cells/larvae followed by a second injection with either PBS, FLC alone, or FLC and FNZ within 90 min of the first injection. bd Survival curves of larvae infected with SC5314 (b), low FoG (c) and high FoG (d) isogenic derivatives. Each curve represents a group of 24 larvae (n = 24) which were monitored daily for survival for up to 14 days after infection. P values represent results of log-rank test comparing different treatment conditions with significance values as follows: ***P < 0.001; **P < 0.01; *P < 0.05; ns nonsignificant
Fig. 6
Fig. 6
FoG and SMG levels differ between persistent and non-persistent isolates. a Candida albicans isolates from bloodstream infections were either efficiently cleared by a single course of FLC treatment (non-persistent) or persisted in the host despite multiple rounds of FLC therapy. b FoG and RAD levels for isolates SC5314, GC75, P78042, and P87 (reference isolates studied in Figs. 1–5), resistant (R, n = 1) isolate P60002, the non-persistent isolates (NP, n = 7), and only the first patient isolate from each of the series of clinically persistent strains (P, n = 12). Asterisks indicate significant differences between persistent and non-persistent isolates (t test, ***P < 0.001). c Broth microdilution assays showing MIC and SMG levels at 24 and 48 h for the susceptible control strains, the non-persistent isolates as in b and for both the first and last isolates for each of the 12 clinically persistent series (S01–12). The final isolate of the S03 series of persistent strains had become FLC-resistant (MIC > 128 µg/ml, Supplementary Fig. 10a), and therefore the penultimate isolate, which remained susceptible, was used across analyses. Asterisks indicate significant differences between persistent and non-persistent isolates (t test, ***P < 0.001). For all panels isolates were tested in three or more biological replicates, error bars denote standard deviations

Comment in

  • Candida tolerates and persists.
    Hofer U. Hofer U. Nat Rev Microbiol. 2018 Sep;16(9):520-521. doi: 10.1038/s41579-018-0056-6. Nat Rev Microbiol. 2018. PMID: 29976950 No abstract available.

References

    1. Brauner A, Fridman O, Gefen O, Balaban NQ. Distinguishing between resistance, tolerance and persistence to antibiotic treatment. Nat. Rev. Microbiol. 2016;14:320–330. doi: 10.1038/nrmicro.2016.34. - DOI - PubMed
    1. Marcos-Zambrano LJ, Escribano P, Sanchez-Carrillo C, Bouza E, Guinea J. Scope and frequency of fluconazole trailing assessed using EUCAST in invasive Candida spp. isolates. Med. Mycol. 2016;54:733–739. doi: 10.1093/mmy/myw033. - DOI - PubMed
    1. Pfaller MA, Diekema DJ. Progress in antifungal susceptibility testing of Candida spp. by use of Clinical and Laboratory Standards Institute broth microdilution methods, 2010 to 2012. J. Clin. Microbiol. 2012;50:2846–2856. doi: 10.1128/JCM.00937-12. - DOI - PMC - PubMed
    1. Doern GV, Brecher SM. The clinical predictive value (or lack thereof) of the results of in vitro antimicrobial susceptibility tests. J. Clin. Microbiol. 2011;49:S11–S14. doi: 10.1128/JCM.00580-11. - DOI
    1. Delarze E, Sanglard D. Defining the frontiers between antifungal resistance, tolerance and the concept of persistence. Drug Resist. Updat. 2015;23:12–19. doi: 10.1016/j.drup.2015.10.001. - DOI - PubMed

Publication types

MeSH terms