. 2018 Jan 9;9(1):105.
doi: 10.1038/s41467-017-02651-5.

Microbiota derived short chain fatty acids promote histone crotonylation in the colon through histone deacetylases

Affiliations

Microbiota derived short chain fatty acids promote histone crotonylation in the colon through histone deacetylases

Rachel Fellows et al. Nat Commun. .

Abstract

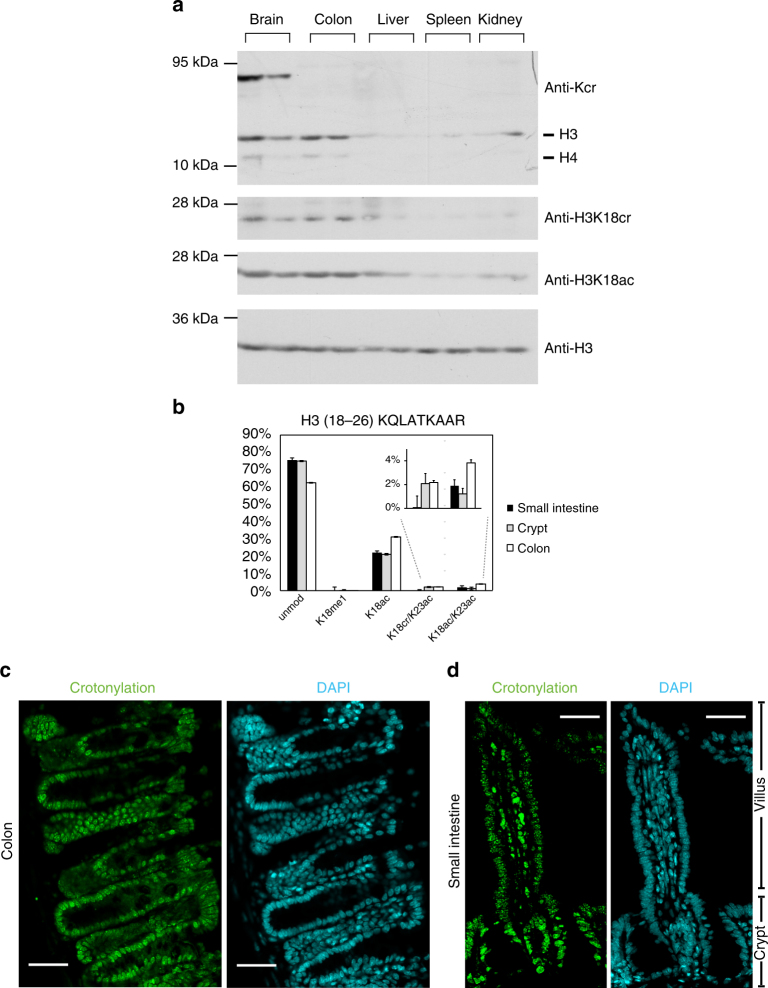
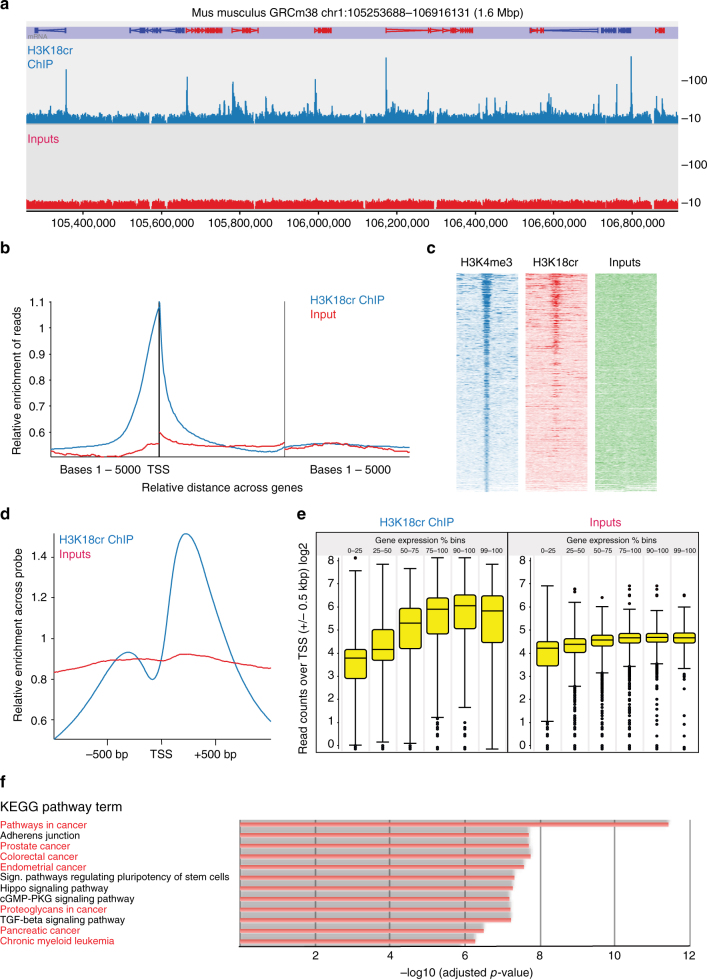
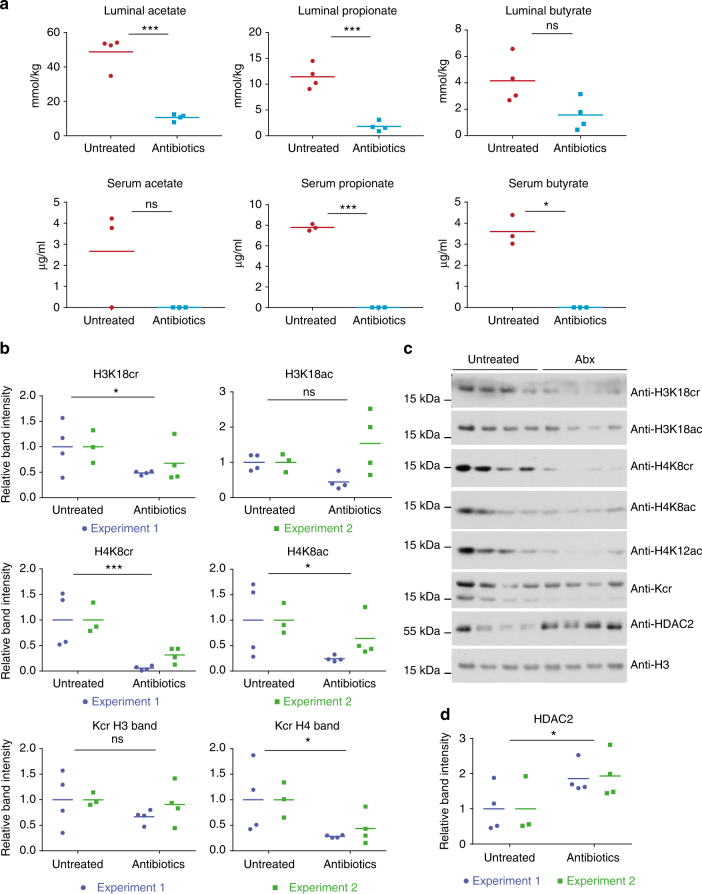
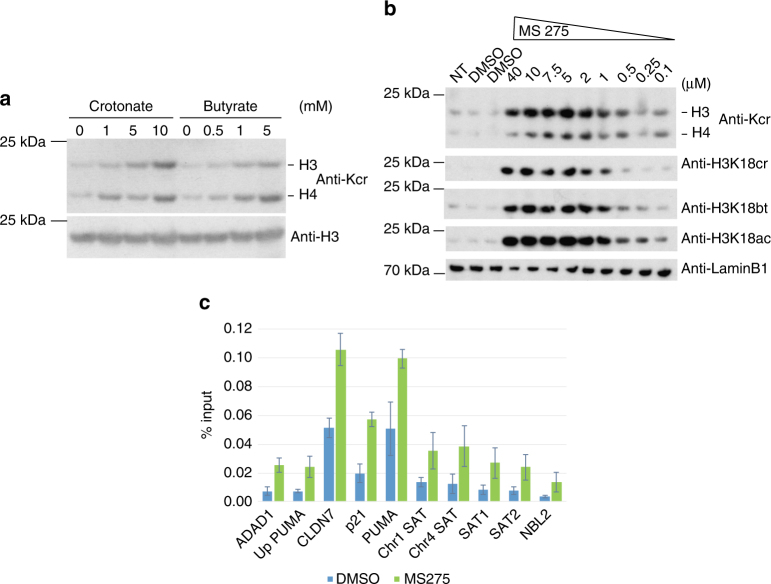
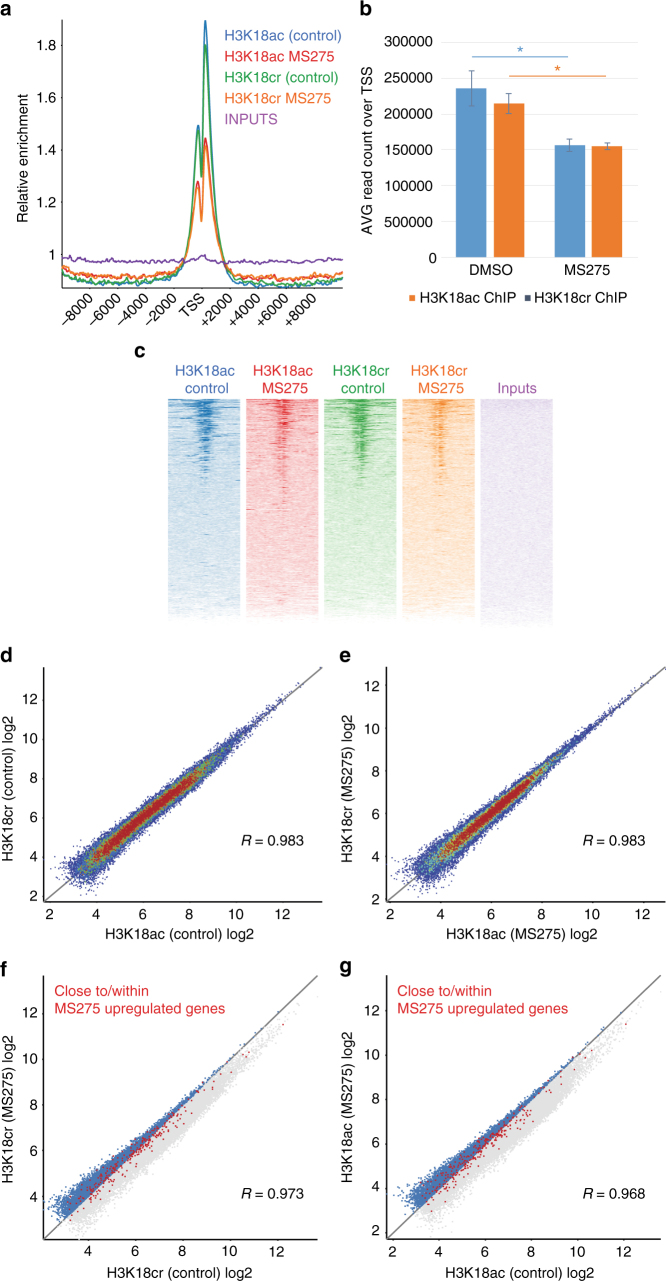
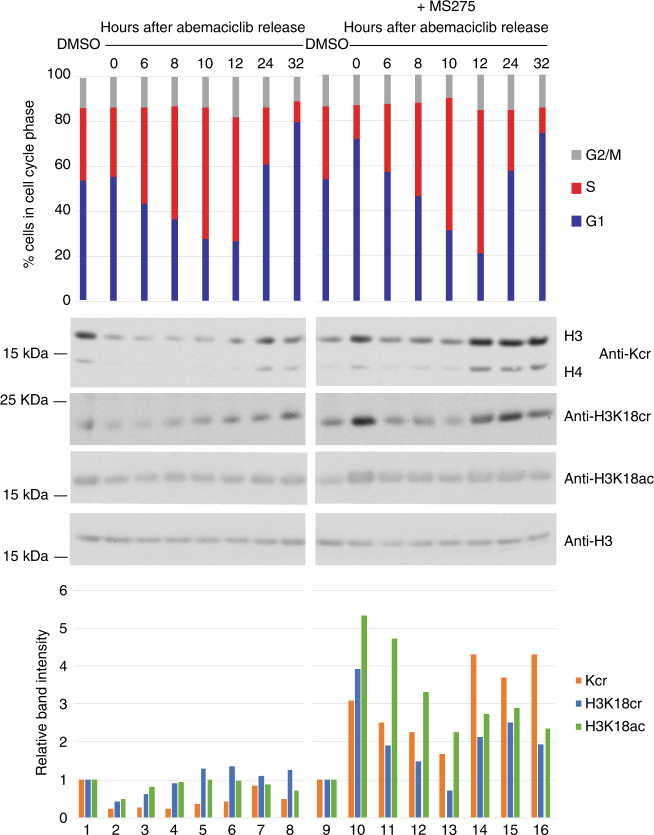
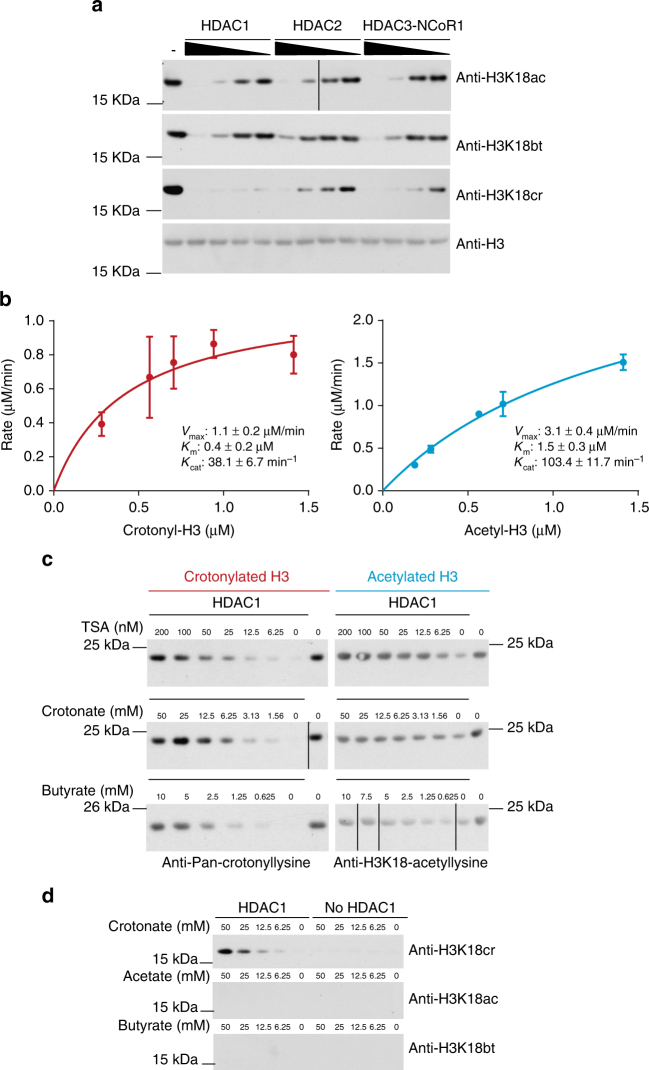
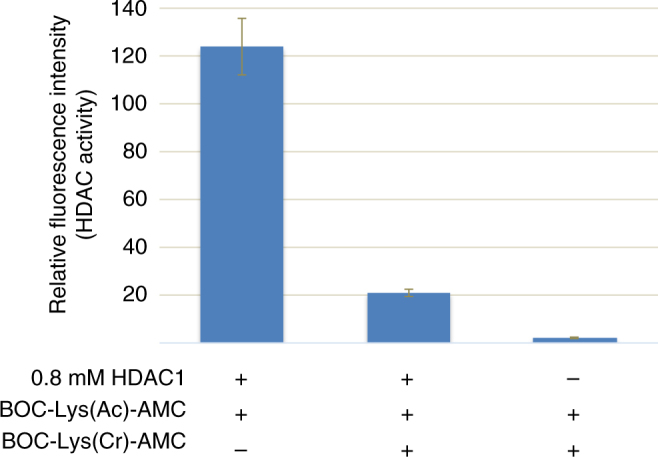
The recently discovered histone post-translational modification crotonylation connects cellular metabolism to gene regulation. Its regulation and tissue-specific functions are poorly understood. We characterize histone crotonylation in intestinal epithelia and find that histone H3 crotonylation at lysine 18 is a surprisingly abundant modification in the small intestine crypt and colon, and is linked to gene regulation. We show that this modification is highly dynamic and regulated during the cell cycle. We identify class I histone deacetylases, HDAC1, HDAC2, and HDAC3, as major executors of histone decrotonylation. We show that known HDAC inhibitors, including the gut microbiota-derived butyrate, affect histone decrotonylation. Consistent with this, we find that depletion of the gut microbiota leads to a global change in histone crotonylation in the colon. Our results suggest that histone crotonylation connects chromatin to the gut microbiota, at least in part, via short-chain fatty acids and HDACs.


Conflict of interest statement

The authors declare that they have no competing financial interests.

Figures

Fig. 1
Fig. 1
Histone crotonylation is found in the intestine. a Western blot analysis of whole cell extracts from several mouse tissues using indicated antibodies shows that histone crotonylation is particularly abundant in the brain and colon; the analysis of tissues from two mice is shown. b Relative abundance of H3K18cr in the intestinal epithelium cell fractions, n = 3, error bars are standard deviation. c, d Immunofluorescence microscopy with anti-pan crotonyl antibody (green, left panels) and DAPI counterstaining (cyan, right panels) of a mouse colon (c) and small intestinal (d) tissue sections, scale bars 40 μm
Fig. 2
Fig. 2
H3K18cr ChIP-seq from colon epithelium analysis. ChIP-sequencing on isolated colon epithelial cells from two mice. a Browser view of a segment from chromosome 1 showing a representative profile of the distribution of H3K18cr peaks with relationship to genes. Relative enrichment of the combined replicate sets of ChIP and input in linear scale are shown, probes are 500 bp, 250 bp overlap. b Average distribution of ChIP-seq normalized read counts with relation to genes shows that histone H3K18cr is highly enriched over transcription start sites (TSS) in colon epithelial cells. c Link between H3K4me3 and H3K18cr, using MACS peak quantification and an aligned probe plot. Probes were ranked according to H3K4me3 signal strength and span 5 kbp around MACS peaks. d Average distribution of reads in linear scale with relation to genes' TSS, showing enrichment over these sites. e Relationship between H3K18cr enrichment over TSS and mRNA levels of the corresponding genes from cells isolated from the mouse colon epithelium were quantified using mRNA-seq (three biological replicates) and the normalized read counts over genes were divided into percentile bins as indicated, from lowly expressed genes (0–25 percentile) to very highly expressed genes (99–100 percentile). H3K18cr over TSS ±0.5 kbp of genes belonging to the expression bins was quantified and is shown in box-whisker plots. f KEGG pathway terms and their adjusted p-values of significance of genes with the highest 10 percentile H3K18cr associated (MACS) peaks. Only results with –log10(p) > 6 are shown, see Supplementary Fig. 6 for all results. Cancer pathways are highlighted (red terms)
Fig. 3
Fig. 3
Microbiota depletion affects colonic histone crotonylation and HDAC2. Antibiotic treatment led to a decrease in luminal and serum SCFA levels in mice (n ≥ 3, from experiment 2). a Acetate, propionate, and butyrate concentrations were measured in the colon lumen and serum by gas chromatography. Unpaired t-tests were conducted, *p-value < 0.05 and ***p-value < 0.001. Values of zero were below detectable levels. b Quantifications of western blot analysis of colon extracts from untreated and treated mice, n ≥ 3. Experiments 1 and 2 are repeat experiments. Center values (small bar) are the average of the treatment group relative to the untreated group. Two-way ANOVA (two-tailed) was performed on quantified bands to compare the effect of treatment for both experiments together; * corresponds to a p-value of < 0.05 and *** corresponds to <0.001. The quantification showed a statistically significant decrease in H4 crotonylation as detected by the anti-Kcr antibody and in H4K8cr, H4K8ac, and H3K18cr levels upon antibiotics treatment. c Global changes in various colon histone crotonylation and acetylation marks and HDAC2 as seen in representative western blots of colon extracts, from experiment 1. d Two-way ANOVA was performed on quantified bands from western blotting analysis with anti-HDAC2. A statistically significant increase was observed (p-value < 0.05)
Fig. 4
Fig. 4
Butyrate and class I HDAC inhibition promote histone crotonylation. a Western blot analysis with indicated antibodies of whole cell extracts of small intestinal organoids treated for 48 h with indicated amounts of SCFAs. Representative western blot of two repeat experiments. b HCT116 cells were treated with MS275 or DMSO (vehicle) for 18 h, whole cell extracts collected, and analyzed by western blot using indicated antibodies; anti-Kcr: anti-crotonyl-lysine antibody, NT: not treated. c Increase in histone H3K18cr over promoters of indicated genes and repetitive, heterochromatic sites (alpha-satellite sequences, NBL2) upon MS275 treatment of HCT116 cells for 18 h. Summary of ChIP-qPCR data of three repeat experiments, error bars are SEM
Fig. 5
Fig. 5
H3K18cr and H3K18ac ChIP-seq on MS275-treated HCT116 cells. a Probe trendplot over TSS (±10 kbp) of reads from H3K18ac and H3K18cr ChIP-seq on HCT116 cells with and without MS275 treatment; b H3K18cr and H3K18ac ChIP-seq analysis shows a relative decrease in these marks over TSS upon MS275 treatment, error bars are SEM, n = 3, p < 0.05, paired t-test; c aligned probe plots over TSS (±5 kbp) of reads from H3K18ac and H3K18cr ChIP-seq with and without MS275 treatment, aligned probes were ranked according to read counts in the H3K18cr/MS275 ChIP-seq. d Scatterplot of read counts of H3K18ac versus H3K18cr MACS peaks of control (vehicle treated) cells and e of H3K18ac versus H3K18cr MACS peaks of MS275-treated cells. f Read counts in H3K18cr MACS peaks from control cells versus MS275-treated cells. MACS peaks close (+2 kbp) and within upregulated genes are in red. g Read counts in H3K18ac MACS peaks from control cells versus H3K18ac, MACS peaks of MS275-treated cells, MACS peaks close (+2 kbp) and within upregulated genes are in red. MACS peaks that show an increase in H3K18cr (f) or H3K18ac (g) on MS275 treatment are in blue. For both H3K18cr and H3K18ac, there is a disproportionate larger number of MACS peaks linked to MS275-upregulated genes that also show an increase in H3K18cr (f) or H3K18ac (g) on MS275 treatment compared to those that show a decrease in these modifications (p < 0.0001, χ2 test)
Fig. 6
Fig. 6
Histone crotonylation is cell cycle regulated by class I HDACs. Cell cycle block and release experiment on HCT116 cells using CDK4/6 inhibitor abemaciclib with and without MS275. Lanes 1 and 9: asynchronous cells, lane 2: G1 arrested cells, lanes 3–8: increase in histone crotonylation (Kcr), H3K18cr and H3K18ac upon release into S phase. Lanes 10–16: histone crotonylation, H3K18cr and H3K18ac are upregulated during a G1 arrest and S phase when class I HDACs are inhibited with MS275. For the experiments in lanes 9–16, cells were blocked in G1 using 15 nM abemaciclib in the presence of 5 μM MS275 and released into S phase in the presence of 1 μM MS275. Cell cycle profiles are shown at the top, western blots in the middle, and quantifications of those, as calculated relative to H3 and normalized to the DMSO (vehicle) sample, at the bottom. Representative of two experiments is shown
Fig. 7
Fig. 7
Class I HDACs are histone decrotonylases. a Histone H3 decrotonylation and deacetylation in vitro by HDAC1, HDAC2, or HDAC3/Ncor1 complex; 5.65 μM histones were crotonylated or acetylated in vitro and then subjected to removal of the modification by the indicated HDACs. HDAC1 was 0.25, 0.12, 0.06, and 0.03 μM. HDAC2 was 0.18, 0.09, 0.05, and 0.02 μM. HDAC3/Ncor1 complex was 0.45, 0.23, 0.11, and 0.06 μM. b Comparative kinetics of HDAC1 decrotonylation and deacetylation; 5.65 µM histones were crotonylated or acetylated and then subjected to removal of the modification by 0.03 µM HDAC1 for different lengths of time. Samples were analyzed by dot blotting and initial rates of reaction were determined by plotting substrate removal over time. Kinetic parameters Vmax, Km, and Kcat, error bars are SEM, n = 3. c Effect of HDAC inhibitors TSA, crotonate, and butyrate on deacetylation and decrotonylation by HDAC1 in vitro. Representative blots of two repeat experiments are shown. d Histone crotonylation by HDAC1 using crotonate in vitro. Incubation of crotonate, acetate, or butyrate with or without HDAC1 followed by western blotting analysis with anti-H3K18ac/bt/cr. Western blot of HDAC1 and crotonate assay is representative of two western blots
Fig. 8
Fig. 8
BOC-Lys(crotonyl)-AMC inhibits deacetylation by HDAC1. A fluorometric in vitro assay showing that HDAC1 efficiently deacetylates the BOC-Lys(acetyl)-AMC substrate alone, but not in the presence of same amounts of BOC-Lys(crotonyl)-AMC. Performed in triplicate, error bars are standard deviation

References

    1. Keating ST, El-Osta A. Epigenetics and metabolism. Circ. Res. 2015;116:715–736. doi: 10.1161/CIRCRESAHA.116.303936. - DOI - PubMed
    1. Tan M, et al. Identification of 67 histone marks and histone lysine crotonylation as a new type of histone modification. Cell. 2011;146:1016–1028. doi: 10.1016/j.cell.2011.08.008. - DOI - PMC - PubMed
    1. Chen Y, et al. Lysine propionylation and butyrylation are novel post-translational modifications in histones. Mol. Cell. Proteom. 2007;6:812–819. doi: 10.1074/mcp.M700021-MCP200. - DOI - PMC - PubMed
    1. Goudarzi A, et al. Dynamic competing histone H4 K5K8 acetylation and butyrylation are hallmarks of highly active gene promoters. Mol. Cell. 2016;62:169–180. doi: 10.1016/j.molcel.2016.03.014. - DOI - PMC - PubMed
    1. Xie Z, et al. Metabolic regulation of gene expression by histone lysine β-hydroxybutyrylation. Mol. Cell. 2016;62:194–206. doi: 10.1016/j.molcel.2016.03.036. - DOI - PMC - PubMed

Publication types