. 2017 Oct 19:8:1345.
doi: 10.3389/fimmu.2017.01345. eCollection 2017.

Clostridium butyricum CGMCC0313.1 Protects against Autoimmune Diabetes by Modulating Intestinal Immune Homeostasis and Inducing Pancreatic Regulatory T Cells

Affiliations

Clostridium butyricum CGMCC0313.1 Protects against Autoimmune Diabetes by Modulating Intestinal Immune Homeostasis and Inducing Pancreatic Regulatory T Cells

Lingling Jia et al. Front Immunol. .

Abstract

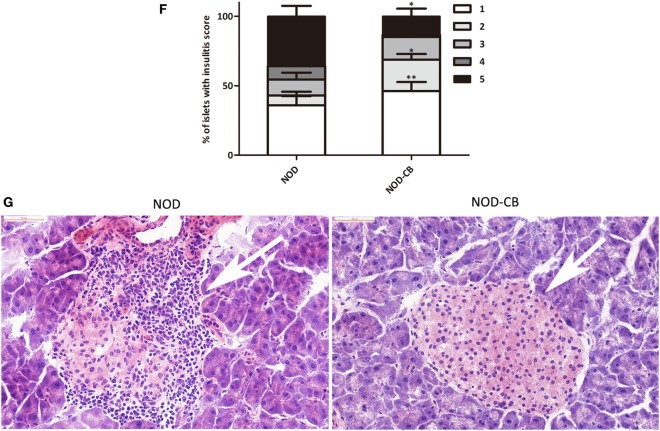
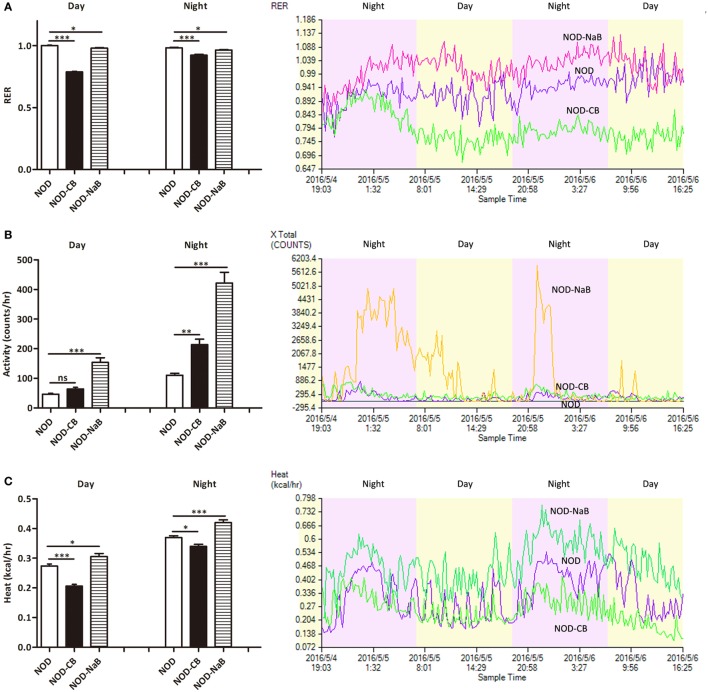
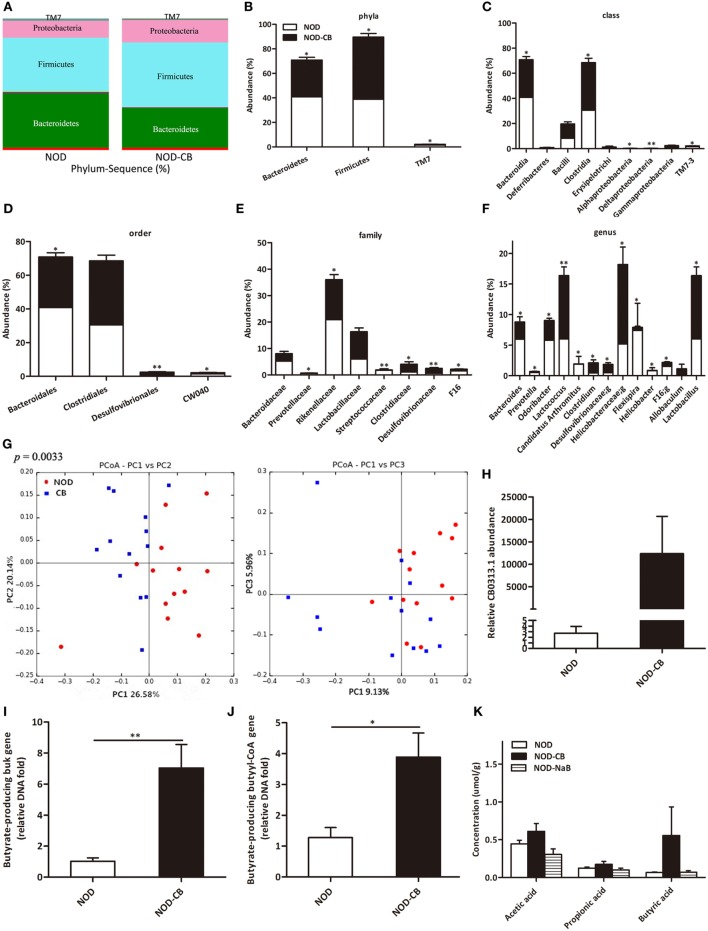
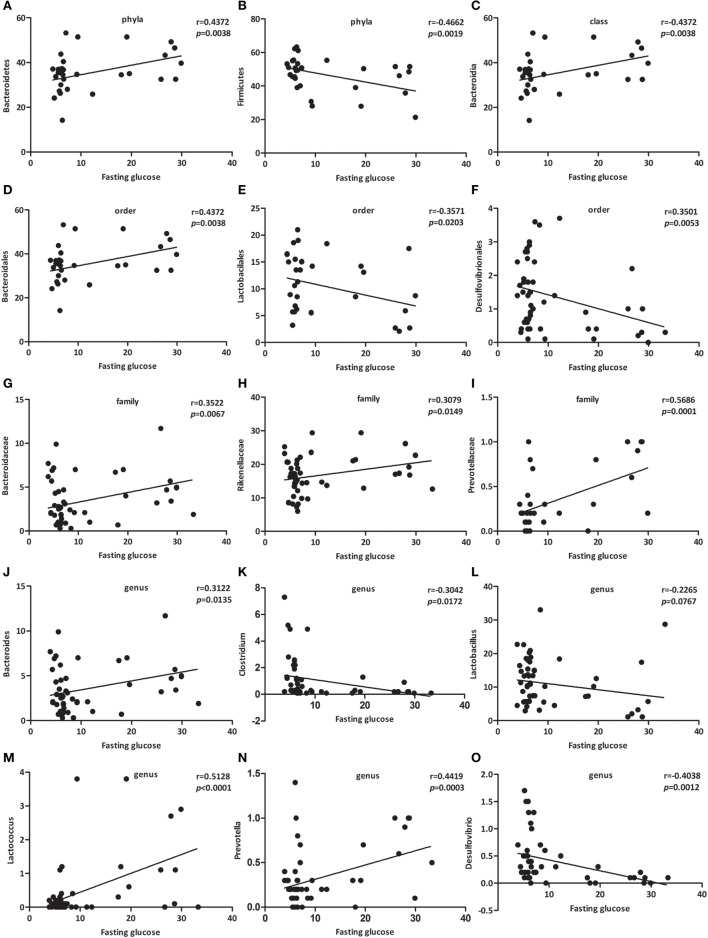
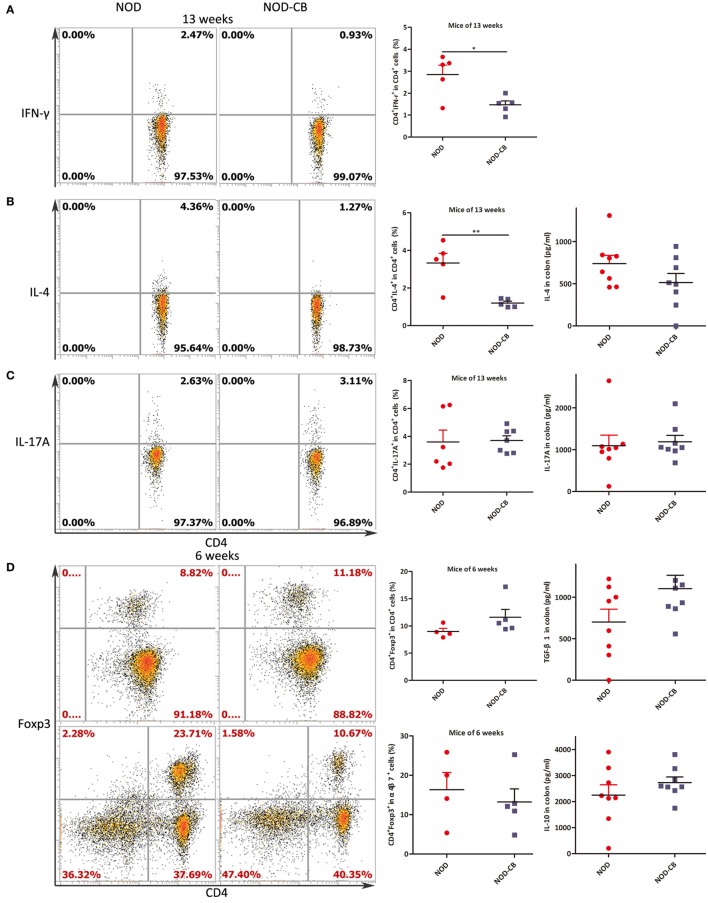
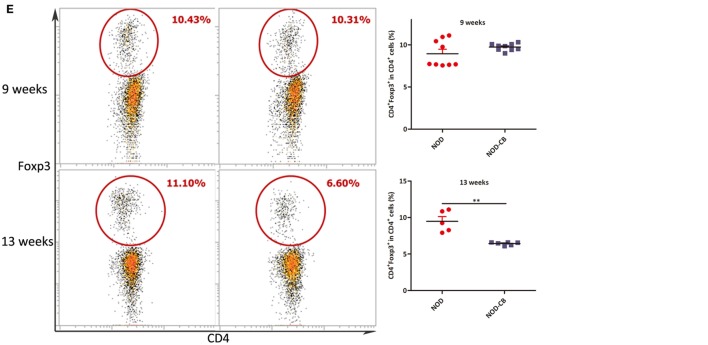
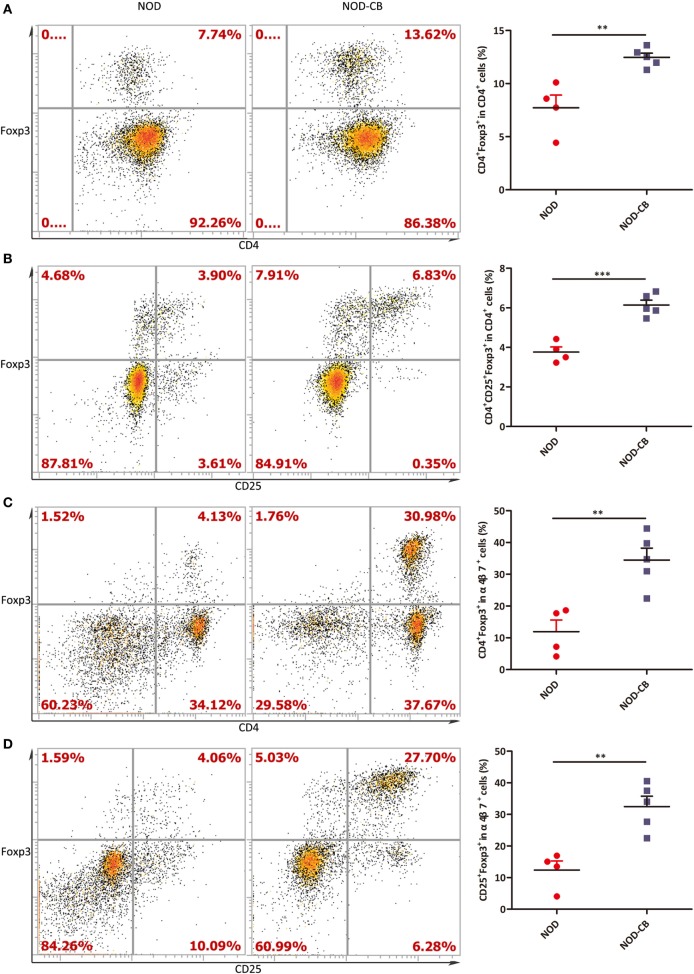
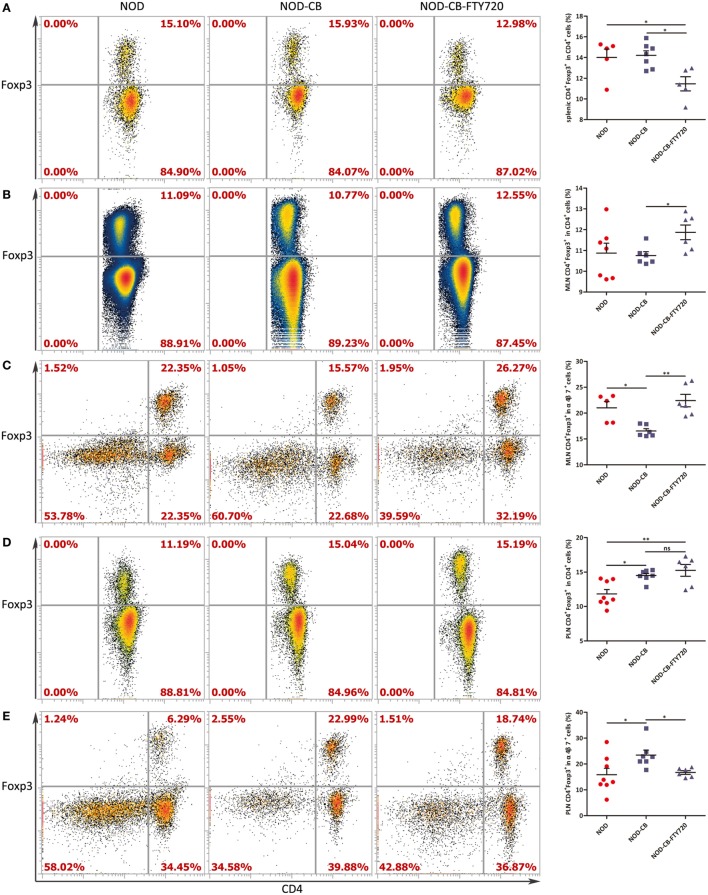
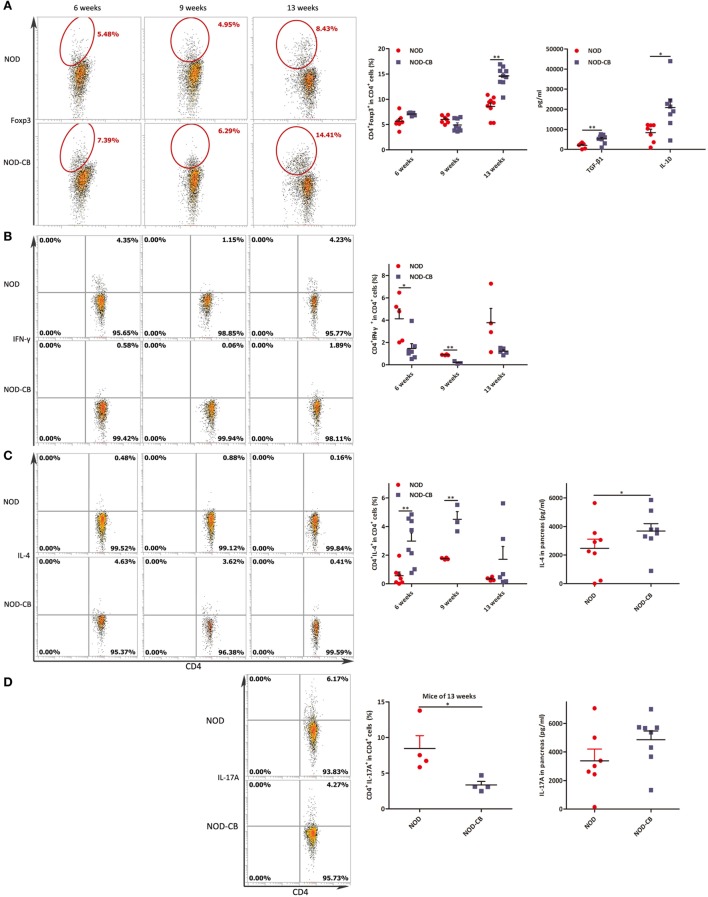
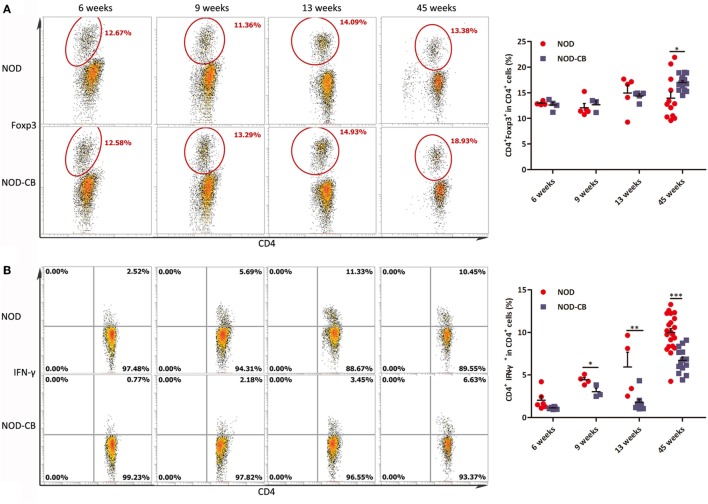
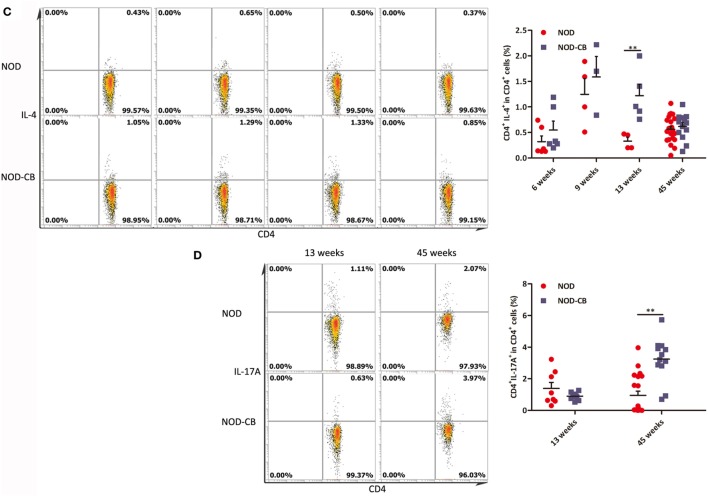
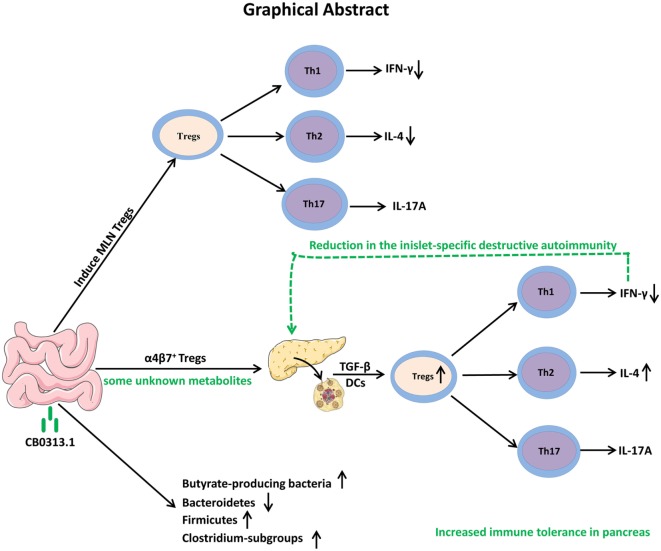
Recent evidence indicates that indigenous Clostridium species induce colonic regulatory T cells (Tregs), and gut lymphocytes are able to migrate to pancreatic islets in an inflammatory environment. Thus, we speculate that supplementation with the well-characterized probiotics Clostridium butyricum CGMCC0313.1 (CB0313.1) may induce pancreatic Tregs and consequently inhibit the diabetes incidence in non-obese diabetic (NOD) mice. CB0313.1 was administered daily to female NOD mice from 3 to 45 weeks of age. The control group received an equal volume of sterile water. Fasting glucose was measured twice a week. Pyrosequencing of the gut microbiota and flow cytometry of mesenteric lymph node (MLN), pancreatic lymph node (PLN), pancreatic and splenic immune cells were performed to investigate the effect of CB0313.1 treatment. Early oral administration of CB0313.1 mitigated insulitis, delayed the onset of diabetes, and improved energy metabolic dysfunction. Protection may involve increased Tregs, rebalanced Th1/Th2/Th17 cells and changes to a less proinflammatory immunological milieu in the gut, PLN, and pancreas. An increase of α4β7+ (the gut homing receptor) Tregs in the PLN suggests that the mechanism may involve increased migration of gut-primed Tregs to the pancreas. Furthermore, 16S rRNA gene sequencing revealed that CB0313.1 enhanced the Firmicutes/Bacteroidetes ratio, enriched Clostridium-subgroups and butyrate-producing bacteria subgroups. Our results provide the basis for future clinical investigations in preventing type 1 diabetes by oral CB0313.1 administration.

Keywords: butyrate-producing bacteria; gut microbiota; regulatory T cells; regulatory T cells migration; type 1 diabetes.


Figures

Figure 1
Figure 1
CB0313.1 delays the onset and reduces the incidence of diabetes. (A) To evaluate the effect of CB0313.1 on the onset of type 1 diabetes, NOD mice were randomly assigned to two groups to receive CB0313.1 or equal volumes of sterile water by gavage from 3 to 45 weeks of age. NaB was used as positive control. Mice were monitored for the appearance of clinical signs of diabetes and euthanized at disease occurrence for immune cell detection by flow cytometry. Experiment was carried up to 45 weeks of age and all remaining non-diabetic mice from all groups were euthanized for the detection of immune cells by flow cytometry. (B) Delayed onset and reduced incidence of diabetes in NOD-CB mice. Mice received CB0313.1, NaB, or sterile water treatment from 3 weeks of age with fasting glucose monitoring. Mice were diagnosed as diabetic and euthanized when blood glucose levels exceeded 11.1 mmol/L on 2 consecutive days along with polyuria. (C) Water intake. (D) Body weight. (E) Diet intake. (F) Insulitis score for NOD-CB and NOD control mice at 13 weeks of age. Percentage of islets with a given score at 13 weeks of age in NOD-CB (n = 23) and NOD control (n = 23) mice. 1 = white, no infiltration; 2 = light gray, few mononuclear cells infiltrated; 3 = gray, peri-insulitis; 4 = dark gray, <50% islet infiltration; 5 = black, >50% islet infiltration. (G) Histological examination of pancreatic islet infiltration by immune cells in female NOD mice at 13 weeks of age. Analysis of variance followed by the indicated post hoc test was performed to determine the significance among the three groups. t-test was used for two independent groups. *, **, *** p < 0.05, p < 0.01, p < 0.001 vs NOD control mice.
Figure 1
Figure 1
CB0313.1 delays the onset and reduces the incidence of diabetes. (A) To evaluate the effect of CB0313.1 on the onset of type 1 diabetes, NOD mice were randomly assigned to two groups to receive CB0313.1 or equal volumes of sterile water by gavage from 3 to 45 weeks of age. NaB was used as positive control. Mice were monitored for the appearance of clinical signs of diabetes and euthanized at disease occurrence for immune cell detection by flow cytometry. Experiment was carried up to 45 weeks of age and all remaining non-diabetic mice from all groups were euthanized for the detection of immune cells by flow cytometry. (B) Delayed onset and reduced incidence of diabetes in NOD-CB mice. Mice received CB0313.1, NaB, or sterile water treatment from 3 weeks of age with fasting glucose monitoring. Mice were diagnosed as diabetic and euthanized when blood glucose levels exceeded 11.1 mmol/L on 2 consecutive days along with polyuria. (C) Water intake. (D) Body weight. (E) Diet intake. (F) Insulitis score for NOD-CB and NOD control mice at 13 weeks of age. Percentage of islets with a given score at 13 weeks of age in NOD-CB (n = 23) and NOD control (n = 23) mice. 1 = white, no infiltration; 2 = light gray, few mononuclear cells infiltrated; 3 = gray, peri-insulitis; 4 = dark gray, <50% islet infiltration; 5 = black, >50% islet infiltration. (G) Histological examination of pancreatic islet infiltration by immune cells in female NOD mice at 13 weeks of age. Analysis of variance followed by the indicated post hoc test was performed to determine the significance among the three groups. t-test was used for two independent groups. *, **, *** p < 0.05, p < 0.01, p < 0.001 vs NOD control mice.
Figure 2
Figure 2
CB0313.1 but not butyrate improves energy metabolic dysfunction. Energy metabolism was examined using a metabolic chamber at 12 weeks of age. (A) Substrate utilization is expressed as the respiratory exchange ratio (RER), the ratio of O2 consumption to CO2 exhalation volume; (B) spontaneous physical activity; (C) heat production. Data are mean ± SEM (n = 4 mice per group). Analysis of variance followed by the indicated post hoc test was performed to determine the significance among the three groups. t-test was used for two independent groups. *, **, *** p < 0.05, p < 0.01, p < 0.001 vs NOD control mice.
Figure 3
Figure 3
CB0313.1 restores the diabetes-induced gut microbial dysbiosis. (A,B) Abundance of the most important phyla in each group. Abundance of the main altered classes (C), orders (D), families (E), and genera (F) in each group. (G) Principal coordinate analysis (PCoA) plot of weighted UniFrac distances, each dot representing a feces community; the percentage of variation explained by each principal coordinate is shown in parentheses. (H) Relative abundance of CB0313.1. Predominant butyrate producing genes: relative abundance of butyrate kinase (buk) and butyryl-CoA DNA in feces (I,J). (K) SCFA concentration in feces measured by GC-MS. Analysis of variance followed by the indicated post hoc test was performed to determine the significance among the three groups. Data are mean ± SEM (n = 8 mice per group). *, **, *** p < 0.05, p < 0.01, p < 0.001 vs NOD control mice by t-test.
Figure 4
Figure 4
Specific bacterial groups in the gut correlate with fasting glucose. Correlation analyses between fasting glucose and the relative abundance (%) of (A) Bacteroidetes, (B) Firmicutes, (C) Bacteroidia, (D) Bacteroidales, (E) Lactobacilales, (F) Desulfovibrionales, (G) Bacteroidaceae, (H) Rikenellaceae, (I) Prevotellaceae, (J) Bacteroides, (K) Clostridium, (L) Lactobacillus, (M) Lactococcus, (N) Prevotella, (O) Desulfovibrio. n = 42–62. *, **, *** p < 0.05, p < 0.01, p < 0.001 vs NOD control mice by t-test.
Figure 5
Figure 5
CB0313.1 changes cytokine profiles and induces Tregs in the MLN. (A) Percent IFN-γ+ in CD4+ cells in MLN as indicated at 13 weeks of age. (B) Percent IL-4+ in CD4+ cells in MLN as indicated at 13 weeks of age, and protein level of IL-4 determined by ELISA at 13 weeks of age. (C) Percent IL-17A+ in CD4+ cells in MLN as indicated at 13 weeks of age, and protein level of IL-17A determined by ELISA at 13 weeks of age. (D) Percent Foxp3+ in CD4+ cells, percent CD4+Foxp3+ in α4β7+ cells in MLN as indicated at 6 weeks of age, and protein levels of TGF-β, IL-10 determined by ELISA at 13 weeks of age. (E) Percent Foxp3+ in CD4+ cells in MLN as indicated at 9, 13 weeks of age. Data are mean ± SEM (n = 5–9 mice per group). *, **, *** p < 0.05, p < 0.01, p < 0.001 vs NOD control mice by t-test. For (A–C,E), the number of cells is 5,000; For (D), the number of cells is 10,000.
Figure 5
Figure 5
CB0313.1 changes cytokine profiles and induces Tregs in the MLN. (A) Percent IFN-γ+ in CD4+ cells in MLN as indicated at 13 weeks of age. (B) Percent IL-4+ in CD4+ cells in MLN as indicated at 13 weeks of age, and protein level of IL-4 determined by ELISA at 13 weeks of age. (C) Percent IL-17A+ in CD4+ cells in MLN as indicated at 13 weeks of age, and protein level of IL-17A determined by ELISA at 13 weeks of age. (D) Percent Foxp3+ in CD4+ cells, percent CD4+Foxp3+ in α4β7+ cells in MLN as indicated at 6 weeks of age, and protein levels of TGF-β, IL-10 determined by ELISA at 13 weeks of age. (E) Percent Foxp3+ in CD4+ cells in MLN as indicated at 9, 13 weeks of age. Data are mean ± SEM (n = 5–9 mice per group). *, **, *** p < 0.05, p < 0.01, p < 0.001 vs NOD control mice by t-test. For (A–C,E), the number of cells is 5,000; For (D), the number of cells is 10,000.
Figure 6
Figure 6
CB0313.1 promotes the migration of gut-primed Tregs to the PLN. (A) Percent CD4+ Foxp3+ cells in PLN. (B) Percent CD4+CD25+Foxp3+ cells in PLN. (C) Percent CD4+ Foxp3+ cells in α4β7+ cells in PLN. (D) Percent CD25+Foxp3+ cells in PLN. ***p < 0.05, p < 0.01, p < 0.001 vs NOD controls mice by t-test. The number of cells is 10,000.
Figure 7
Figure 7
FTY720 suppresses the accumulation of α4β7+ Tregs but not the total Tregs in the PLN. (A) Percent CD4+Foxp3+ in CD4+ spleen cells. (B) Percent CD4+ Foxp3+ in CD4+ MLN cells. (C) Percent CD4+Foxp3+ in α4β7+ MLN cells. (D) Percent CD4+Foxp3+ in CD4+ PLN cells. (E) Percent CD4+Foxp3+ in α4β7+ PLN cells. Data are mean ± SEM (n = 5–8 mice per group). *, **, *** p < 0.05, p < 0.01, p < 0.001 vs NOD control mice by t-test. The number of cells is 10,000–300,000.
Figure 8
Figure 8
CB0313.1 induces pancreatic Tregs and reduces pancreas inflammation. (A) Percent CD4+Foxp3+ cells in pancreas as indicated at 6, 9, and 13 weeks of age, and protein levels of TGF-β, IL-10 determined by ELISA at 13 weeks of age. (B) Percent CD4+IFN-γ+ cells in pancreas as indicated at 6, 9, and 13 weeks of age. (C) CD4+IL-4+ cells in pancreas as indicated at 6, 9, and 13 weeks of age, and protein level of IL-4 determined by ELISA at 13 weeks of age. (D) CD4+IL-17A+ in pancreas as indicated at 13 weeks of age, and protein level of IL-17A determined by ELISA at 13 weeks of age. Data are mean ± SEM (n = 4–15 mice per group). *, **, *** p < 0.05, p < 0.01, p < 0.001 vs NOD control mice by t-test. For (A), the number of cells is 5,000. For (B–D), the number of cells is 3,000–5,000.
Figure 9
Figure 9
CB0313.1 changes the splenic cytokine profiles. (A) Percent CD4+Foxp3+ cells in spleen as indicated at 6, 9, 13, and 45 weeks of age. Percent CD4+IFN-γ+ (B) CD4+IL-4+ (C) and CD4+IL-17A+ (D) cells in spleen as indicated. Data are mean ± SEM (n = 3–21 mice per group). *, **, *** p < 0.05, p < 0.01, p < 0.001 vs NOD control mice by t-test. The number of cells is 10,000.
Figure 9
Figure 9
CB0313.1 changes the splenic cytokine profiles. (A) Percent CD4+Foxp3+ cells in spleen as indicated at 6, 9, 13, and 45 weeks of age. Percent CD4+IFN-γ+ (B) CD4+IL-4+ (C) and CD4+IL-17A+ (D) cells in spleen as indicated. Data are mean ± SEM (n = 3–21 mice per group). *, **, *** p < 0.05, p < 0.01, p < 0.001 vs NOD control mice by t-test. The number of cells is 10,000.
Figure 10
Figure 10
Graphical abstract. Early oral CB0313.1 administration (starting at weaning in diabetes-prone NOD mice) induced Tregs in PLN and pancreas, balanced pancreatic Th1/Th2/Th17 cells, enhanced Firmicutes/Bacteroidetes, enriched Clostridium-subgroups and butyrate-producing bacteria subgroups, eventually preventing the onset and progression of type 1 diabetes.

References

    1. Resnick HE, Foster GL, Bardsley J, Ratner RE. Achievement of American Diabetes Association clinical practice recommendations among U.S. adults with diabetes, 1999-2002: the National Health and Nutrition Examination Survey. Diabetes Care (2006) 29:531–7. 10.2337/diacare.29.03.06.dc05-1254 - DOI - PubMed
    1. Akerblom HK, Vaarala O, Hyoty H, Ilonen J, Knip M. Environmental factors in the etiology of type 1 diabetes. Am J Med Genet (2002) 115:18–29. 10.1002/ajmg.10340 - DOI - PubMed
    1. Vaarala O, Atkinson MA, Neu J. The “perfect storm” for type 1 diabetes: the complex interplay between intestinal microbiota, gut permeability, and mucosal immunity. Diabetes (2008) 57:2555–62. 10.2337/db08-0331 - DOI - PMC - PubMed
    1. Antvorskov JC, Josefsen K, Engkilde K, Funda DP, Buschard K. Dietary gluten and the development of type 1 diabetes. Diabetologia (2014) 57:1770–80. 10.1007/s00125-014-3265-1 - DOI - PMC - PubMed
    1. Westerholm-Ormio M, Vaarala O, Pihkala P, Ilonen J, Savilahti E. Immunologic activity in the small intestinal mucosa of pediatric patients with type 1 diabetes. Diabetes (2003) 52:2287–95. 10.2337/diabetes.52.9.2287 - DOI - PubMed