. 2017 Sep 13;22(3):411-419.e4.
doi: 10.1016/j.chom.2017.08.010.

The Landscape of Type VI Secretion across Human Gut Microbiomes Reveals Its Role in Community Composition

Affiliations

The Landscape of Type VI Secretion across Human Gut Microbiomes Reveals Its Role in Community Composition

Adrian J Verster et al. Cell Host Microbe. .

Abstract

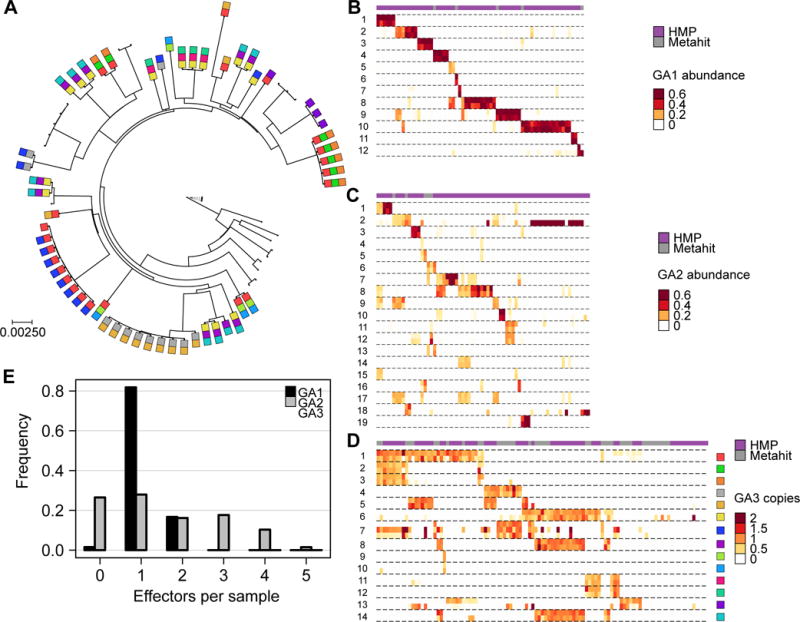
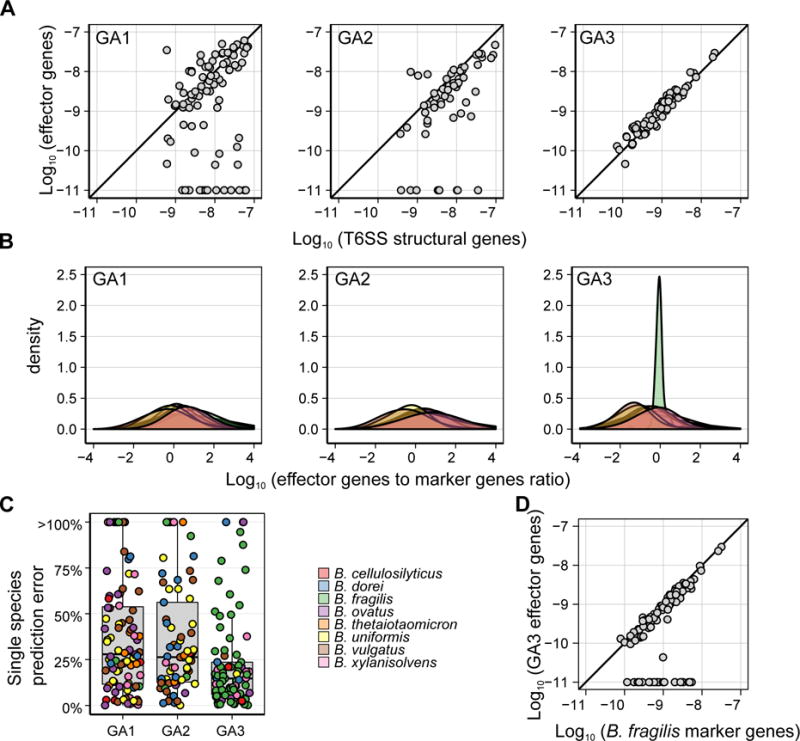
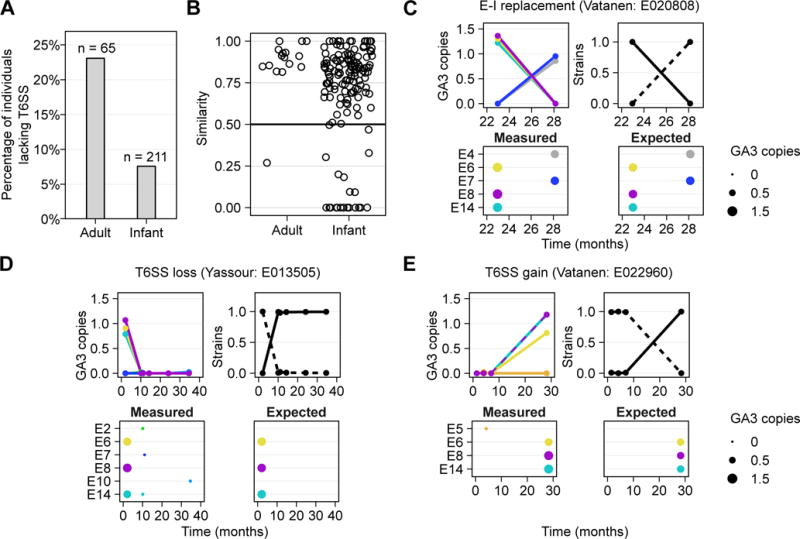
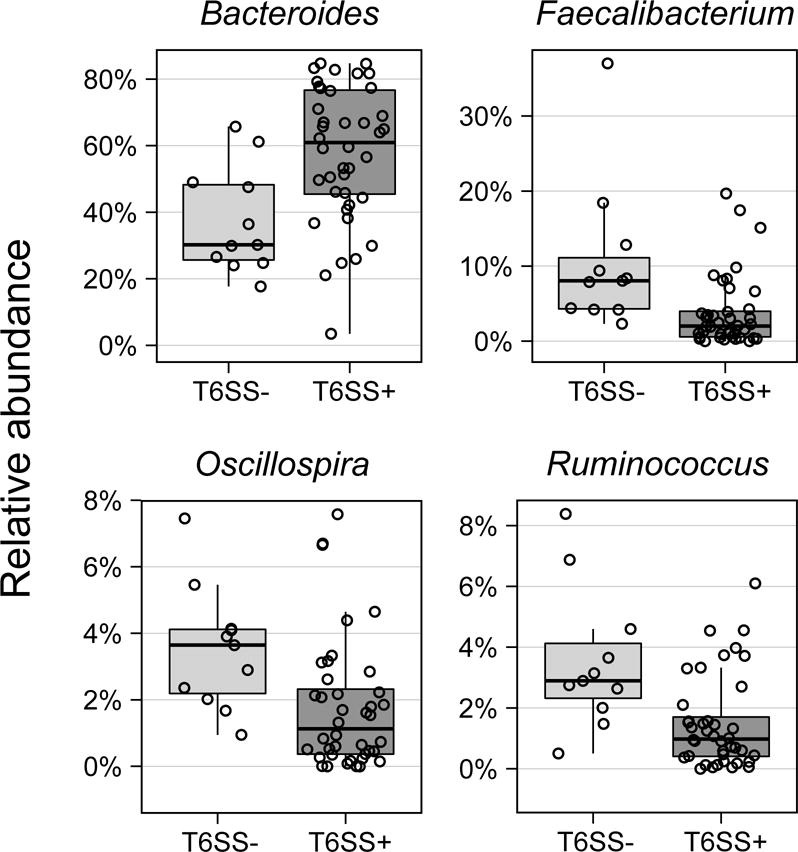
Although gut microbiome composition is well defined, the mechanisms underlying community assembly remain poorly understood. Bacteroidales possess three genetic architectures (GA1-3) of the type VI secretion system (T6SS), an effector delivery pathway that mediates interbacterial competition. Here we define the distribution and role of GA1-3 in the human gut using metagenomic analysis. We find that adult microbiomes harbor limited effector and cognate immunity genes, suggesting selection for compatibility at the species (GA1 and GA2) and strain (GA3) levels. Bacteroides fragilis GA3 is known to mediate potent inter-strain competition, and we observe GA3 enrichment among strains colonizing infant microbiomes, suggesting competition early in life. Additionally, GA3 is associated with increased Bacteroides abundance, indicating that this system confers an advantage in Bacteroides-rich ecosystems. Collectively, these analyses uncover the prevalence of T6SS-dependent competition and reveal its potential role in shaping human gut microbial composition.

Keywords: Bacteroidales; T6SS; human microbiome; infant microbiome; interbacterial competition; metagenomics; microbiome assembly; toxin; type VI secretion system.


Figures

Figure 1
Figure 1. Bacteroides T6SS E–I genes are abundant in human gut microbiome samples
(A) A maximum likelihood phylogeny of B. fragilis reference strains constructed from concatenated marker genes. Phylogenetic distance is measured as substitutions per site on the marker genes. GA3 effector genes are represented as colored squares (using the same color coding as in panel D). (B–D) Each heatmap illustrates the abundance of E–I genes for one of the T6SS subsystems. Each row corresponds to a different E–I pair (effector, top; immunity, bottom). Columns represent the samples analyzed (HMP, purple; MetaHIT, gray). For GA1 and GA2, only samples in which at least 100 reads mapped to the E–I genes of a given subsystem are included, and abundance is measured as fraction of the total abundance of E–I genes in a given sample. For GA3, only samples in which B. fragilis is present are included and E–I abundance is normalized by the abundance of B. fragilis-specific marker genes, hence measuring the average number of copies per B. fragilis genome. (E) Histograms showing the number of effector genes detected (at >10% of the most abundant effector gene) in each sample.
Figure 2
Figure 2. Differential associations between T6SS and Bacteroides spp
(A) Scatter plot of the average abundance of detected effector genes vs. the average abundance of T6SS structural genes for different subtypes. We have restricted our analysis to samples with at least 25 reads mapping to a given subtype. The strong correlation observed, and the very few samples in which structural genes but no effector genes can be found, testify to the completeness of our E–I pairs catalog. (B) Density plots showing the distribution across samples of the ratio between the average abundance of detected effector genes from each T6SS subsystem and the average abundance of species-specific marker genes for different Bacteroides spp. Only samples in which at least 100 reads mapped to the E–I genes of a given subsystem and only species for which at least 5 genomes were available (and therefore marker genes can be robustly inferred) are included. (C) A boxplot showing the minimal relative error in effector abundance assuming that the T6SS is encoded by a single species. The relative error is defined as the relative difference between the average abundance of detectable effector genes in a sample and the abundance of species with the closest abundance. The color of each point represents the species for which the minimal relative error was obtained. (D) Scatter plot of the average abundance of detected GA3 effector genes vs. the average abundance of B. fragilis-specific marker genes. Only samples in which B. fragilis is present are included. As in (A) each abundance was increased by 10−11. See also Figures S2 and S3.
Figure 3
Figure 3. E–I turnover and strain replacement in infant microbiomes
(A) The percentage of individuals of those harboring B. fragilis, that lack the GA3 T6SS across adult and infant datasets. (B) The minimal similarity (measured by the Jaccard similarity coefficient) in GA3 E–I gene content between the first time point and every subsequent time point in adults and infants. (C) Examples of E–I turnover events and corresponding strain replacement events are shown. The plots on the upper and bottom left in each panel illustrate the estimated abundance of GA3 effector genes (measured as copies per B. fragilis genome) over time, with the plot on the upper right illustrating the estimated frequency of inferred strains in these samples. Only samples in which B. fragilis is present are shown. The bottom right plot illustrates the expected abundance of the various effector genes based on the effector genes encoded by reference strains that are phylogenetically close to the inferred strains. See also Figure S4.
Figure 4
Figure 4. Differentially abundant genera between T6SS+ and T6SS− HMP samples
Abundances are based on a 16S rRNA survey and only genera whose abundances are significantly different in T6SS+ vs. T6SS− samples (at FDR < 0.05) are plotted. See also Table S1.

References

    1. Anderson MC, Vonaesch P, Saffarian A, Marteyn BS, Sansonetti PJ. Shigella sonnei Encodes a Functional T6SS Used for Interbacterial Competition and Niche Occupancy. Cell Host Microbe. 2017;21:769–776 e763. - PubMed
    1. Aoki SK, Diner EJ, de Roodenbeke CT, Burgess BR, Poole SJ, Braaten BA, Jones AM, Webb JS, Hayes CS, Cotter PA, et al. A widespread family of polymorphic contact-dependent toxin delivery systems in bacteria. Nature. 2010;468:439–442. - PMC - PubMed
    1. Backhed F, Roswall J, Peng Y, Feng Q, Jia H, Kovatcheva-Datchary P, Li Y, Xia Y, Xie H, Zhong H, et al. Dynamics and Stabilization of the Human Gut Microbiome during the First Year of Life. Cell Host Microbe. 2015;17:690–703. - PubMed
    1. Benz J, Meinhart A. Antibacterial effector/immunity systems: it’s just the tip of the iceberg. Curr Opin Microbiol. 2014;17:1–10. - PubMed
    1. Bulgarelli D, Garrido-Oter R, Munch PC, Weiman A, Droge J, Pan Y, McHardy AC, Schulze-Lefert P. Structure and function of the bacterial root microbiota in wild and domesticated barley. Cell Host Microbe. 2015;17:392–403. - PMC - PubMed

MeSH terms

Substances

LinkOut - more resources