Randomized Controlled Trial
. 2017 Oct;106(4):1052-1061.
doi: 10.3945/ajcn.117.155424. Epub 2017 Aug 16.

Fecal concentrations of bacterially derived vitamin K forms are associated with gut microbiota composition but not plasma or fecal cytokine concentrations in healthy adults

Affiliations
Randomized Controlled Trial

Fecal concentrations of bacterially derived vitamin K forms are associated with gut microbiota composition but not plasma or fecal cytokine concentrations in healthy adults

J Philip Karl et al. Am J Clin Nutr. 2017 Oct.

Abstract

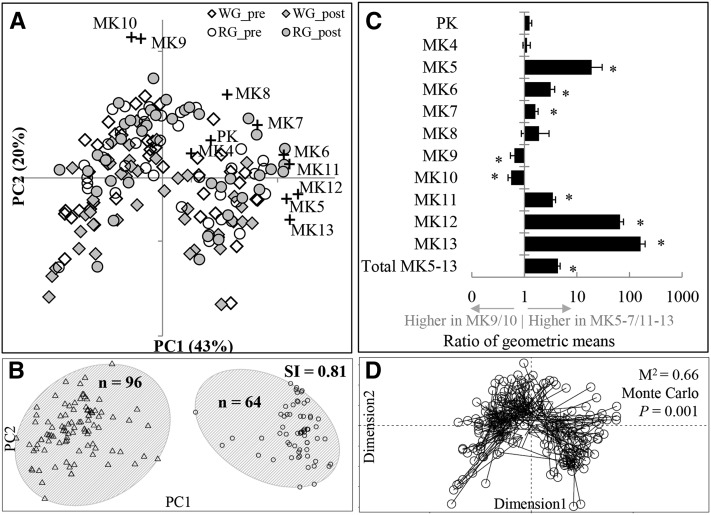
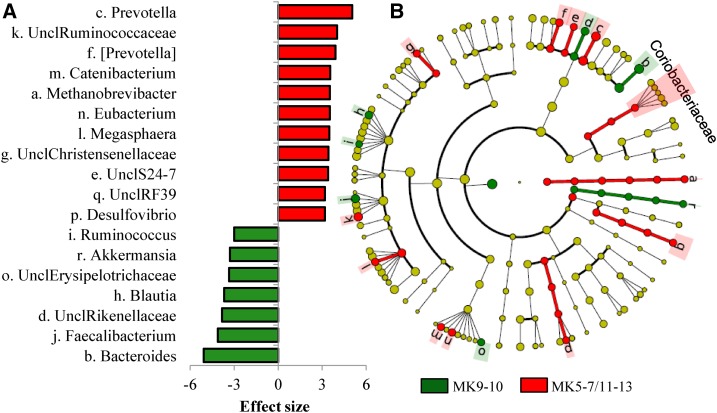
Background: Emerging evidence suggests novel roles for bacterially derived vitamin K forms known as menaquinones in health and disease, which may be attributable in part to anti-inflammatory effects. However, the relevance of menaquinones produced by gut bacteria to vitamin K requirements and inflammation is undetermined.Objective: This study aimed to quantify fecal menaquinone concentrations and identify associations between fecal menaquinone concentrations and serum vitamin K concentrations, gut microbiota composition, and inflammation.Design: Fecal and serum menaquinone concentrations, fecal microbiota composition, and plasma and fecal cytokine concentrations were measured in 80 men and postmenopausal women (48 men, 32 women, age 40-65 y) enrolled in a randomized, parallel-arm, provided-food trial. After consuming a run-in diet for 2 wk, participants were randomly assigned to consume a whole grain-rich (WG) or a refined grain-based (RG) diet for 6 wk. Outcomes were measured at weeks 2 and 8.Results: The median total daily excretion of menaquinones in feces was 850 nmol/d but was highly variable (range: 64-5358 nmol/d). The total median (IQR) fecal concentrations of menaquinones decreased in the WG diet compared with the RG diet [-6.8 nmol/g (13.0 nmol/g) dry weight for WG compared with 1.8 nmol/g (12.3 nmol/g) dry weight for RG; P < 0.01)]. However, interindividual variability in fecal menaquinone concentrations partitioned individuals into 2 distinct groups based on interindividual differences in concentrations of different menaquinone forms rather than the diet group or the time point. The relative abundances of several gut bacteria taxa, Bacteroides and Prevotella in particular, differed between these groups, and 42% of identified genera were associated with ≥1 menaquinone form. Menaquinones were not detected in serum, and neither fecal concentrations of individual menaquinones nor the menaquinone group was associated with any marker of inflammation.Conclusion: Menaquinone concentrations in the human gut appear highly variable and are associated with gut microbiota composition. However, the health implications remain unclear. This trial was registered at clinicaltrials.gov as NCT01902394.

Keywords: menaquinones; metabolomics; microbiome; phylloquinone; vitamin K; whole grain.


Figures

FIGURE 1
FIGURE 1
Covariance between fecal vitamin K vitamers partitions individuals into distinct clusters, or menaquinotypes, which are associated with gut microbiota composition. (A) PC analysis of fecal vitamin K vitamer concentrations measured before and after consuming a WG diet or an RG diet for 6 wk (n = 80). Data points (solid shapes) represent the fecal vitamin K vitamer composition of an individual. Spatial locations of the + symbols indicate the relative contribution of each vitamer to the variance explained by the first and second principal components, with greater distance from the (- and y-axes) origin, indicating a larger contribution of that vitamer to variance in fecal vitamin K content. (B) Partitioning around medoids analysis of fecal vitamin K vitamer concentrations (n = 80). Menaquinotypes are indicated by gray ellipses, triangles are MK9–MK10-enriched samples, and circles are MK5–MK7/MK11–MK13-enriched samples. Both pre- and postintervention samples from each individual are represented in the plot. (C) Differences in fecal vitamin K vitamer concentrations between menaquinotypes (n = 80). Bars are the ratio of geometric means ± SEs of the ratio calculated from the β (95% CI) obtained from linear mixed models, which included the log10-vitamer as the response variable, subject as a random factor, menaquinotype as the independent variable, and pre-intervention BMI, age, sex, and time as covariates. *Bonferroni-adjusted P ≤ 0.01. (D) Procrustes analysis of fecal vitamin K PC analysis (open circles) and principal coordinates analysis of fecal microbiota composition based on weighted UniFrac distances of operational taxonomic unit data (arrowheads) (n = 77). Procrustes rotation rotates ordinations to maximal similarity. Vectors connect microbiota composition with vitamer profiles of the same individual for each time point. Longer vectors indicate greater intraindividual dissimilarity. Monte Carlo P values represent 1000 permutations. MK, menaquinone; PC, principal component; PK, phylloquinone; post, postintervention; pre, pre-intervention; RG, refined-grain based; SI, Silhouette Index; WG, whole-grain rich.
FIGURE 2
FIGURE 2
Multiple taxa differentiate menaquinotypes. Linear discriminant analysis of effect size (48) for taxa differing in relative abundance between menaquinotypes before and after the diet intervention (n = 77). (A) Significantly different genera. Bars are effect sizes. Rings within the cladogram (B) correspond to different taxonomic ranks from phyla (innermost ring) to genus (outermost ring). Colored circles represent individual taxa and are sized in proportion to relative abundance. (A and B) Green shading and negative effect sizes represent higher abundance in the MK9–MK 10-enriched menaquinotype, and red shading and positive effect sizes represent the higher abundance in the MK5–MK7/MK11–MK13-enriched menaquinotype (effect size ≥3.0, P ≤ 0.01, Q < 0.05). Lowercase letters in the cladogram are genera that are differentially abundant between menaquinotypes (see panel A for legend). For clarity, discriminant features at higher levels of taxonomy (family to kingdom) are not listed but are indicated by the green and red circles. Both yellow coloring and no shading indicate no difference in relative abundance. Brackets around taxa indicate predicted taxonomy. MK, menaquinone; Uncl, unable to classify to genus level.

References

    1. Beulens JW, Booth SL, van den Heuvel EG, Stoecklin E, Baka A, Vermeer C. The role of menaquinones (vitamin K2) in human health. Br J Nutr 2013;110:1357–68. - PubMed
    1. Booth SL. Roles for vitamin K beyond coagulation. Annu Rev Nutr 2009;29:89–110. - PubMed
    1. Booth SL, Centi A, Smith SR, Gundberg C. The role of osteocalcin in human glucose metabolism: marker or mediator? Nat Rev Endocrinol 2013;9:43–55. - PMC - PubMed
    1. Ferland G. Vitamin K, an emerging nutrient in brain function. Biofactors 2012;38:151–7. - PubMed
    1. Harshman SG, Shea MK. The role of vitamin K in chronic aging diseases: inflammation, cardiovascular disease, and osteoarthritis. Curr Nutr Rep 2016;5:90–8. - PMC - PubMed

Publication types

MeSH terms

Associated data