

Trends in Alcohol Consumption Among Older Americans: National Health Interview Surveys, 1997 to 2014
- PMID: 28340502
- PMCID: PMC5439499
- DOI: 10.1111/acer.13365
Trends in Alcohol Consumption Among Older Americans: National Health Interview Surveys, 1997 to 2014
Abstract
Background: The majority of U.S. older adults consume alcoholic beverages. The older population is projected to almost double by 2050. Substantially more drinkers are likely.
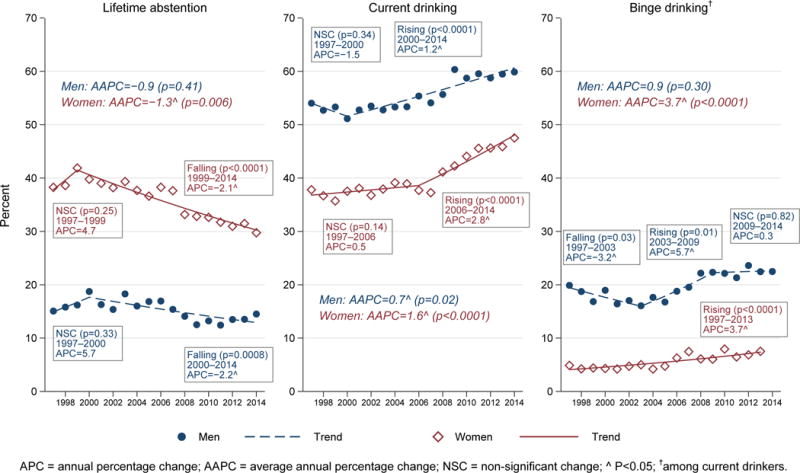
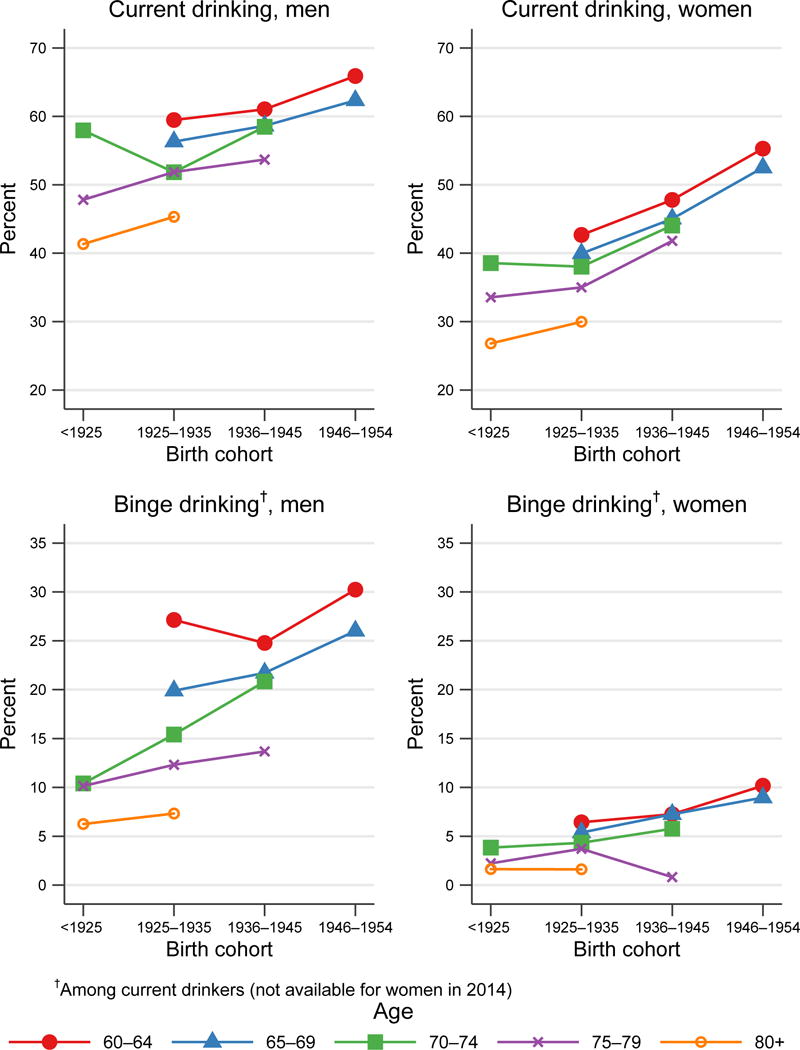
Purpose: To describe gender-specific trends (1997 to 2014) in prevalence of drinking status (lifetime abstention, former drinking, current drinking [including average volume], and binge drinking) among U.S. adults ages 60+ by age group and birth cohort.
Methods: In the 1997 to 2014 National Health Interview Surveys, 65,303 respondents ages 60+ (31,803 men, 33,500 women) were current drinkers; 6,570 men and 1,737 women were binge drinkers. Prevalence estimates and standard errors were computed by age group (60+, 60 to 64, 65 to 69, 70 to 74, 75 to 79, 80+) and birth cohort (<1925, 1925 to 1935, 1936 to 1945, 1946 to 1954). Trends were examined using joinpoint regression and described as average annual percent change (AAPC; overall change 1997 to 2014) and annual percent change (APC; in-between infection points). Primary analyses were unadjusted. All analyses (unadjusted and adjusted for demographics/lifestyle) were weighted to produce nationally representative estimates. Statistical procedures accounted for the complex survey design.
Results: Among men ages 60+, unadjusted prevalence of current drinking trended upward, on average, 0.7% per year (AAPC, p = 0.02); average volume and prevalence of binge drinking remained stable. Adjusted results were similar. Among women age 60+, unadjusted prevalence of current drinking trended upward, on average, 1.6% per year (AAPC, p < 0.0001), but average volume remained stable; prevalence of binge drinking increased, on average, 3.7% per year (AAPC, p < 0.0001). Adjusted results were similar. Trends varied by age group and birth cohort. Among men born 1946 to 1954, unadjusted prevalence of current drinking trended upward, on average, 2.4% per year (AAPC, p = 0.02); adjusted results were nonsignificant.
Conclusions: Our finding of upward trends in drinking among adults ages 60+, particularly women, suggests the importance of public health planning to meet future needs for alcohol-related programs.
Keywords: Aged; Alcohol Consumption; Binge Drinking; Health Surveys; Trends.
Copyright © 2017 by the Research Society on Alcoholism.
Conflict of interest statement
Figures
References
-
- Botman SL, Moore TF, Moriarity CL, Parsons VL. Vital Health Stat. 130. Vol. 2. NCHS; Hyattsville, MD: 2000. Design and estimation for the National Health Interview Survey, 1995–2004. Available at: https://www.cdc.gov/nchs/data/series/sr_02/sr02_130.pdf. Accessed January 19, 2017.
-
- Center for Behavioral Health Statistics and Quality. National Survey on Drug Use and Health: Detailed Tables. Table 2.15B–Alcohol Use in Lifetime, Past Year, and Past Month, by Detailed Age Category: Percentages, 2013 and 2014. Rockville, MD: Substance Abuse and Mental Health Services Administration; 2015. Available at: http://www.samhsa.gov/data/sites/default/files/NSDUH-DetTabs2014/NSDUH-D.... Accessed May 16, 2016.
MeSH terms
Grants and funding
LinkOut - more resources
Full Text Sources
Other Literature Sources
Medical
