. 2017 Jan 13;292(2):417-434.
doi: 10.1074/jbc.M116.767582. Epub 2016 Nov 21.

A Monoclonal Antibody to Cryptococcus neoformans Glucuronoxylomannan Manifests Hydrolytic Activity for Both Peptides and Polysaccharides

Affiliations

A Monoclonal Antibody to Cryptococcus neoformans Glucuronoxylomannan Manifests Hydrolytic Activity for Both Peptides and Polysaccharides

Anthony Bowen et al. J Biol Chem. .

Abstract

Studies in the 1980s first showed that some natural antibodies were "catalytic" and able to hydrolyze peptide or phosphodiester bonds in antigens. Many naturally occurring catalytic antibodies have since been isolated from human sera and associated with positive and negative outcomes in autoimmune disease and infection. The function and prevalence of these antibodies, however, remain unclear. A previous study suggested that the 18B7 monoclonal antibody against glucuronoxylomannan (GXM), the major component of the Cryptococcus neoformans polysaccharide capsule, hydrolyzed a peptide antigen mimetic. Using mass spectrometry and Förster resonance energy transfer techniques, we confirm and characterize the hydrolytic activity of 18B7 against peptide mimetics and show that 18B7 is able to hydrolyze an oligosaccharide substrate, providing the first example of a naturally occurring catalytic antibody for polysaccharides. Additionally, we show that the catalytic 18B7 antibody increases release of capsular polysaccharide from fungal cells. A serine protease inhibitor blocked peptide and oligosaccharide hydrolysis by 18B7, and a putative serine protease-like active site was identified in the light chain variable region of the antibody. An algorithm was developed to detect similar sites present in unique antibody structures in the Protein Data Bank. The putative site was found in 14 of 63 (22.2%) catalytic antibody structures and 119 of 1602 (7.4%) antibodies with no annotation of catalytic activity. The ability of many antibodies to cleave antigen, albeit slowly, supports the notion that this activity is an important immunoglobulin function in host defense. The discovery of GXM hydrolytic activity suggests new therapeutic possibilities for polysaccharide-binding antibodies.

Keywords: Cryptococcus neoformans; antibody; catalytic antibody; computational biology; enzyme kinetics; monoclonal antibody; protein motif; serine protease; structural motif.


Figures

FIGURE 1.
FIGURE 1.
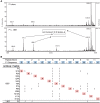
mAb 18B7 hydrolysis of the P1 peptide differs from that of the related 3E5 mAb. A, MALDI-TOF mass spectra of the P1 peptide alone and in the presence of mAb 18B7 following incubation at 37 °C. Fragmentation of P1 is evident at positions 5 and 6 following incubation with 18B7. B, 18B7 was incubated with P1 and 12 P1 derivatives with an alanine substituted at each position. Each row represents a different peptide incubated with 18B7. Locations of alanine substitutions are indicated in red, and vertical bars indicate the locations that each peptide was hydrolyzed. *, sites of P1 hydrolysis by mAb 3E5 were previously determined and are shown for reference (28).
FIGURE 2.
FIGURE 2.
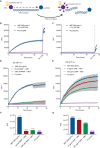
mAb 18B7 catalytic activity is inhibited by serine protease inhibitors and cryptococcal polysaccharide. A, schematic illustrates the FRET system used to assay catalytic activity against peptide substrates. Increased fluorescence at 405 nm indicates peptide hydrolysis. B, P1q was incubated either alone or with 18B7 for 64 h. Proteinase K (100 μg/ml) was added at 64 h. C, 1Fq was incubated either alone or with 18B7 for 64 h, with 100 μg/ml proteinase K added at 64 h. D, P1q was incubated with mAb 18B7 alone or after preincubation with either 50 or 1000 μm PMSF. E, P1q was incubated with 18B7 alone or after preincubation with 10 or 100 μg/ml purified cryptococcal polysaccharide as a competitive inhibitor. F, AUC was calculated for each PMSF inhibition curve in D. G, AUC was calculated for each GXM inhibition curve in E. All AUC measurements were compared by ordinary one-way ANOVA and the post hoc Tukey test for multiple comparisons (****, p < 0.0001).
FIGURE 3.
FIGURE 3.
P1q hydrolysis by the 18B7 mAb follows Michaelis-Menten kinetics. A, P1q was incubated at varying concentrations with several different 18B7 concentrations. The initial velocity of each reaction was determined and plotted as a function of peptide substrate concentration. For each antibody concentration, these data were fit to the Michaelis-Menten equation for a single-step bimolecular reaction using nonlinear regression. B, Michaelis-Menten models from A are shown in a Lineweaver-Burk plot. C, kinetic parameters Km, Vmax, and Kcat were calculated for each antibody concentration.
FIGURE 4.
FIGURE 4.
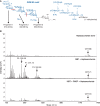
mAb 18B7 hydrolyzes a heptasaccharide containing the GXM M2 motif. A, structure of a synthetic heptasaccharide containing the M2 GXM motif (blue) is shown. Fragments of the heptasaccharide observed via MS are indicated by arrows. Hydrolyzed bonds indicated by these fragments are shown in red. B, MALDI-TOF mass spectra show the heptasaccharide alone (top), the heptasaccharide with mAb 18B7 (middle), and the heptasaccharide with 18B7 following preincubation with the PMSF inhibitor (bottom). All samples were incubated for 22 h at 37 °C.
FIGURE 5.
FIGURE 5.
mAb 18B7 hydrolyzes the cryptococcal capsule resulting in increased release of polysaccharide into the supernatant. A, release of cryptococcal polysaccharide into the supernatant was measured over time by capture ELISA. The inset diagram shows the ELISA configuration used. B, statistical significance of ELISA results was determined by ordinary two-way ANOVA (p < 0.0001) with antibody condition and time as independent factors. Post hoc analysis was performed by comparing each sample to the no antibody condition at each time point using Dunnett's multiple comparisons test. Results from the multiple comparisons test that are significantly higher or (lower) than the no antibody control are shown in the table. (*, p < 0.05; **, p < 0.01; ****, p < 0.0001.) C, representative images of heat-killed fungal cells under each antibody condition at both day 0 and day 14 are shown with India ink stain. The scale bar length in the images is equal to 10 μm.
FIGURE 6.
FIGURE 6.
mAb 18B7 modifies the capsule resulting in more 18B7 reactivity. A, flow cytometry gating strategy for Uvitex2b-positive cells, >99% (left plot), used to construct histograms of 18B7-Alexa-568 reactivity cryptococcal capsules following 39 days of incubation with 0 (control), 1, 10, or 50 μg/ml mAb 18B7 (unlabeled) and 50 μg/ml MOPC-31C IgG1 control. Histograms shown are from one representative experiment. B, micrograph representations of samples analyzed in A, showing cell wall and capsule stainings. India ink counterstain was used to visualized the capsule under bright field. Scale bar, 10 μm.
FIGURE 7.
FIGURE 7.
DLS measurements indicate that incubation of heat-killed cells with mAb 18B7 results in decreased particle size of GXM in solution. A, autocorrelation function C(t) is shown for a concentrated sample of GXM from each condition. B, mean ED over 10 independent measurements of each sample is shown. Error bars represent standard deviation. Significance was determined by a one-way ANOVA (p < 0.0001) with Tukey's multiple comparisons test used for post hoc analysis. (*, p < 0.05.) C, log normal particle size distributions are shown for each sample based on the combined data from all measurements and each sample's polydispersity. D, multimodal size distribution was calculated for each sample and normalized by particle number.
FIGURE 8.
FIGURE 8.
IgMotif structural template algorithm identifies the putative 3E5 motif in other antibody structures. A, schematic of the structural template algorithm illustrates the process of generating a seed template and mean template for a given three-residue motif. The mean template is then used to query target structures for matching sites. B, for each antibody motif template, the minimum of the r.m.s.d. and d.r.m.s. versus the mean 3E5 template was calculated. The frequency distribution of these measures is shown with matches ≤1 Å colored blue. C, frequency distribution of RMS measures for all hydrolase templates versus the mean 3E5 template is shown. B and C, charts on the left show the full range of r.m.s. measurements, while charts are the right show the same data in the 0–2 Å r.m.s. range.
FIGURE 9.
FIGURE 9.
VL residue conservation in catalytic antibodies. A, normalized conservation scores are shown for each VL residue in 61 aligned catalytic antibody sequences. B, conservation scores are shown for a random sample of 61 VL sequences. A and B, consensus sequence is shown below the charts, and residues corresponding to the putative 3E5 motif are colored red. C, frequencies of the putative 3E5 motif residues in aligned sequences from A and B are shown. The frequencies of Asp-1, Ser-26, and His-99 were compared between the two groups of sequences using a χ2 two-sample test for equality of proportions (*, p < 0.01; **, p < 0.0001).
FIGURE 10.
FIGURE 10.
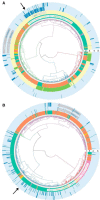
Phylogenetic clustering of VL sequences with the putative 3E5 motif suggests a germ line origin for a subset of catalytic antibodies. Dendrograms were constructed showing the edit distance between all VL (A) and VH (B) antibody sequences from analyzed PDB structures. Outer circular tracks are numbered 1–5, and show the following: 1, germ line gene allele of closest V gene; 2, species of origin inferred from closest germ line gene; 3, family of VL region inferred by closest germ line gene; 4, matching antibodies containing the 3E5 putative catalytic motif; 5, known catalytic antibodies identified in the PDB. The position of the arrow in each panel indicates the location of the 3E5 VL and VH sequences.
FIGURE 11.
FIGURE 11.
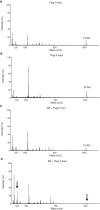
MALDI-TOF mass spectra indicate that the M2 antibody hydrolyzes the FLAG peptide. A, mass spectrum of the FLAG peptide alone at time 0. B, mass spectrum of the FLAG peptide alone after a 5-day incubation at 37 °C. C, mass spectrum of the FLAG peptide in the presence of the M2 antibody at time 0. D, mass spectrum of the FLAG peptide incubated with the M2 antibody for 5 days at 37 °C.

References

    1. Raso V., and Stollar B. D. (1975) The antibody-enzyme analogy. Comparison of enzymes and antibodies specific for phosphopyridoxyltyrosine. Biochemistry 14, 591–599 - PubMed
    1. Jencks W. P. (1969) Catalysis in Chemistry and Enzymology, p. 288, McGraw-Hill, New York
    1. Paul S., Volle D. J., Beach C. M., Johnson D. R., Powell M. J., and Massey R. J. (1989) Catalytic hydrolysis of vasoactive intestinal peptide by human autoantibody. Science 244, 1158–1162 - PubMed
    1. Shuster A. M., Gololobov G. V., Kvashuk O. A., Bogomolova A. E., Smirnov I. V., and Gabibov A. G. (1992) DNA hydrolyzing autoantibodies. Science 256, 665–667 - PubMed
    1. Li L., Paul S., Tyutyulkova S., Kazatchkine M. D., and Kaveri S. (1995) Catalytic activity of anti-thyroglobulin antibodies. J. Immunol. 154, 3328–3332 - PubMed

Associated data

LinkOut - more resources