. 2016 Aug;24(8):1741-51.
doi: 10.1002/oby.21561. Epub 2016 Jul 5.

miR-34a(-/-) mice are susceptible to diet-induced obesity

Affiliations

miR-34a(-/-) mice are susceptible to diet-induced obesity

Christopher A Lavery et al. Obesity (Silver Spring). 2016 Aug.

Abstract

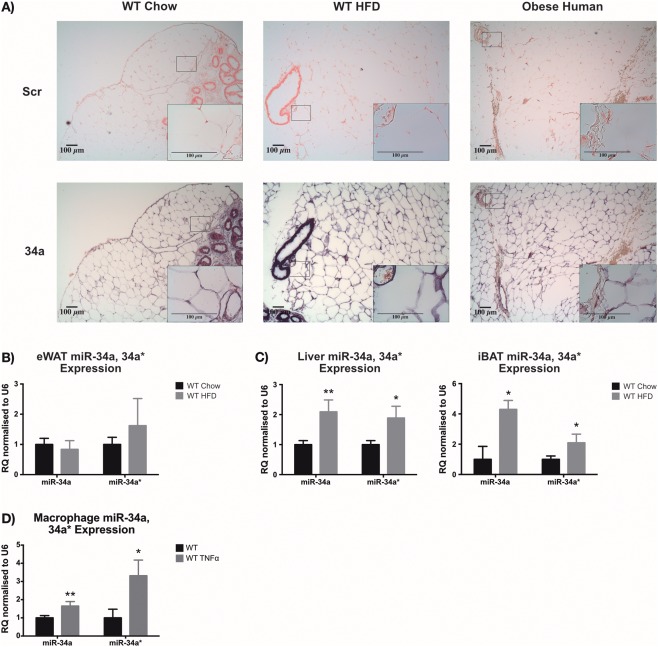
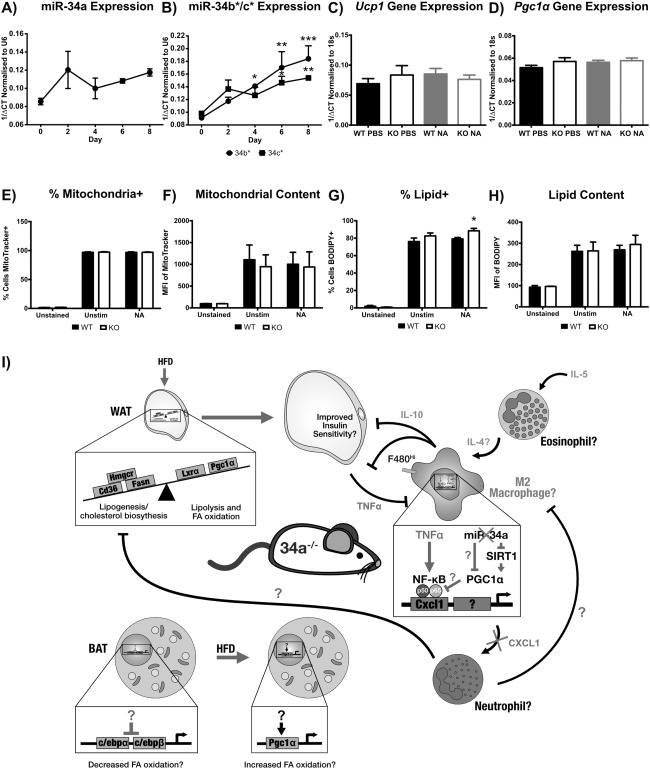
Objective: MicroRNA (miR)-34a regulates inflammatory pathways, and increased transcripts have been observed in serum and subcutaneous adipose of subjects who have obesity and type 2 diabetes. Therefore, the role of miR-34a in adipose tissue inflammation and lipid metabolism in murine diet-induced obesity was investigated.

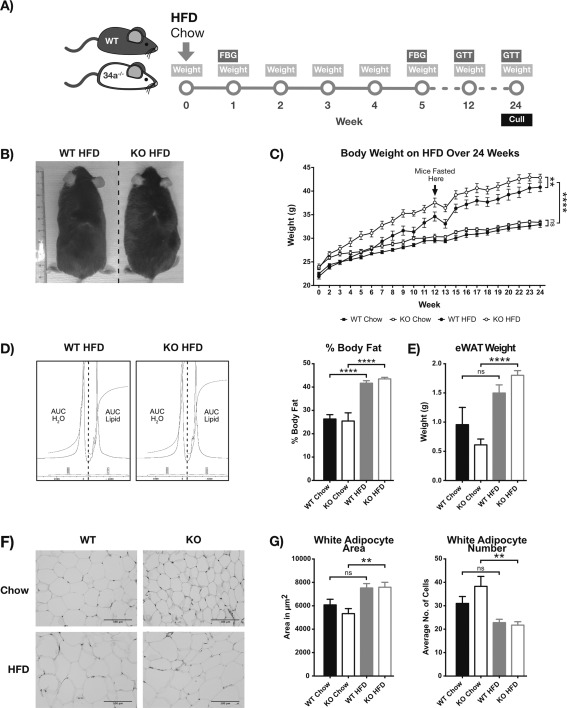
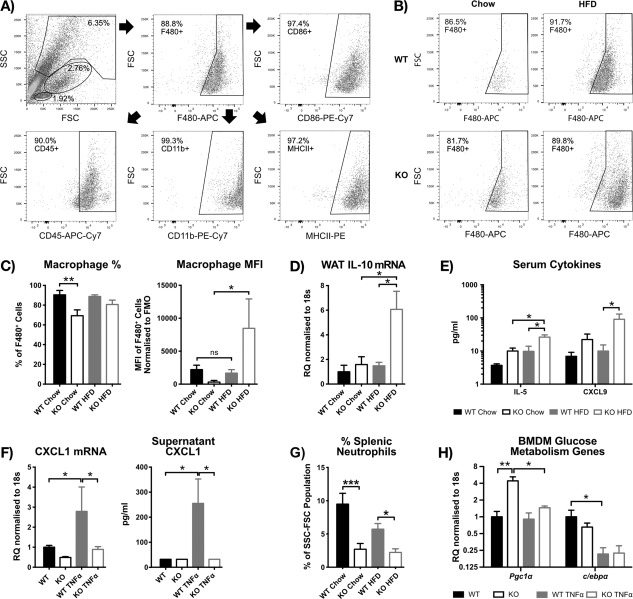
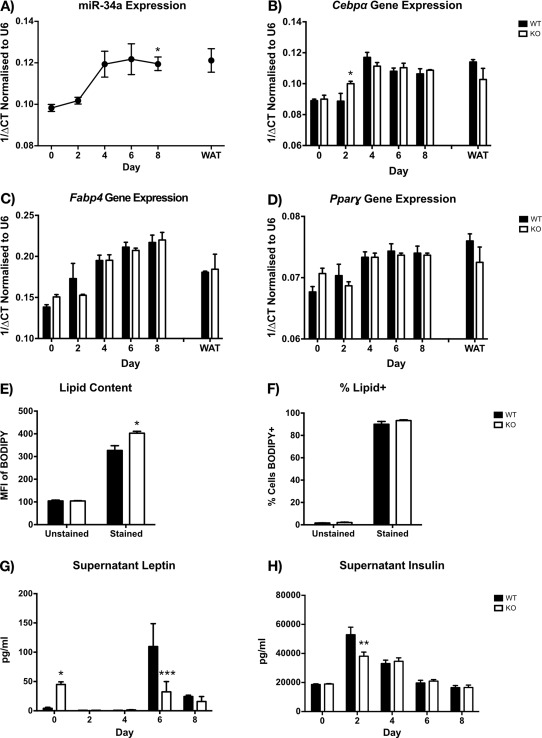
Methods: Wild-type (WT) and miR-34a(-/-) mice were fed chow or high-fat diet (HFD) for 24 weeks. WT and miR-34a(-/-) bone marrow-derived macrophages were cultured in vitro with macrophage colony-stimulating factor (M-CSF). Brown and white preadipocytes were cultured from the stromal vascular fraction (SVF) of intrascapular brown and epididymal white adipose tissue (eWAT), with rosiglitazone.

Results: HFD-fed miR-34a(-/-) mice were significantly heavier with a greater increase in eWAT weight than WT. miR-34a(-/-) eWAT had a smaller adipocyte area, which significantly increased with HFD. miR-34a(-/-) eWAT showed basal increases in Cd36, Hmgcr, Lxrα, Pgc1α, and Fasn. miR-34a(-/-) intrascapular brown adipose tissue had basal reductions in c/ebpα and c/ebpβ, with in vitro miR-34a(-/-) white adipocytes showing increased lipid content. An F4/80(high) macrophage population was present in HFD miR-34a(-/-) eWAT, with increased IL-10 transcripts and serum IL-5 protein. Finally, miR-34a(-/-) bone marrow-derived macrophages showed an ablated CXCL1 response to tumor necrosis factor-α.

Conclusions: These findings suggest a multifactorial role of miR-34a in controlling susceptibility to obesity, by regulating inflammatory and metabolic pathways.


Figures

Figure 1
Figure 1
Expression of miR‐34a in adipose tissue. (A) In situ hybridization (ISH) images of miR‐34a expression (purple) compared with a Scramble (Scr; red) negative control in epididymal (e)WAT from WT mice fed chow or high‐fat diet (HFD) for 24 weeks and omental adipose from patients with obesity undergoing bariatric surgery. RT‐qPCR data showing expression of miR‐34a and 34a* in (B) eWAT and (C) liver and intrascapular (i)BAT collected from WT mice 24 weeks after commencing a chow vs. HFD. (D) RT‐qPCR quantification of miR‐34a and 34a* transcripts in WT in vitro bone marrow‐derived macrophages (BMDM) ± 45.45 ng/mL tumor necrosis factor (TNF)‐α for 24 h. Data represented as relative quantification (RQ) with RQmin − RQmax values, normalized to RNU6; n = 3–4 for eWAT, n = 5–6 for liver, n = 6 for iBAT, and n = 3 for BMDMs. *P < 0.05, **P < 0.01, unpaired Student's t‐test.
Figure 2
Figure 2
miR‐34a−/− mice are susceptible to diet‐induced obesity. (A) Diagrammatic representation of the 24‐week in vivo study structure: high‐fat diet (HFD), fasting blood glucose (FBG), and glucose tolerance test (GTT). Data in panels BF are from WT and miR‐34a−/− (KO) mice on chow vs. HFD over 24 weeks of diet. (B) Representative image of HFD‐fed WT and KO mice at week 24 of study. (C) Body weight measurements over 24 weeks; n = 10 for KO chow and WT HFD and n = 9 for WT chow and KO HFD groups. (D) MRS analysis of mouse percentage body fat at week 24, calculated from integration ratios for lipid (AUClipid) to water (AUCH2O) peaks; n = 6 for WT chow and HFD, n = 4 for KO HFD, and n = 3 for chow HFD groups. (E) Weight of excised epididymal (e)WAT at week 24 of study; n = 10 for KO chow and WT HFD and n = 9 for WT chow and KO HFD groups. (F) Representative H&E staining of eWAT excised in panel E. (G) Quantification of adipocyte area and number in panel F, with averages taken from ≥5 fields per section of n = 10 for KO chow and WT HFD and n = 8 for WT chow and KO HFD groups. Area measurements were converted from pixels to square centimeters using the image scale. All graphs represent mean values with SEM. **P < 0.01, ****P < 0.0001, one‐way ANOVA, with Bonferroni's multiple comparisons post‐test.
Figure 3
Figure 3
Altered expression of metabolic genes in epididymal (e)WAT and intrascapular (i)BAT of miR‐34a−/− mice. (A,B) RT‐qPCR data of metabolic gene expression in eWAT and iBAT from WT and miR‐34a−/− (KO) mice after 24 weeks on chow vs. high‐fat diet (HFD), normalized to 18s rRNA; n = 6 for all groups, except n = 5 for KO HFD. All graphs represented as relative quantification (RQ) with RQmin − RQmax values. *P < 0.05, **P < 0.01, ***P < 0.001, ****P < 0.0001, one‐way ANOVA, with Bonferroni's multiple comparisons post‐test.
Figure 4
Figure 4
High‐fat diet (HFD) ‐fed miR‐34a−/− mice show an F4/80high phenotype, with increased type 2 cytokines and a reduction in splenic neutrophils. (A) Representative dot‐plots showing the gating strategy used to identify macrophages in the SVF from murine epididymal (e)WAT at week 24 in WT and miR‐34a−/− (KO) mice on chow vs. HFD. (B) Representative dot‐plots showing the F4/80high macrophage phenotype in KO eWAT after HFD feeding, from the same study as panel A. (C) Quantification of panel B, showing median fluorescence intensity (MFI) values representing surface expression and percentage F4/80+ cells in the macrophage FSC‐SSC gate; n = 9 for all groups, except n = 10 for KO chow. (D) RT‐qPCR data of interleukin (IL)‐10 gene expression in eWAT from same study as panel A, normalized to 18s rRNA; n = 6 for all groups, except n = 5 for KO HFD and WT chow. (E) Significant changes from cytokine Luminex data of serum from mice fasted for 16 to 18 h from the same study as panel A; n = 6 for KO chow and WT HFD groups and n = 5 for WT chow and KO HFD groups. (F) RT‐qPCR gene expression and supernatant, cytokine Luminex protein data for CXCL1, from WT and KO in vitro bone marrow‐derived macrophages (BMDM) ± 45.45 ng/mL tumor necrosis factor (TNF)‐α for 24 h; n = 3. RT‐qPCR data normalized to 18s rRNA. (G) FACS quantification of the percentage of neutrophils (CD45+ CD11b+ F4/80 CD11cLy6c‐Ly6g+) in the FSC‐SSC population from spleens of mice in the same study as panel A. Gating strategy is shown in Supporting Information Figure S4D; n = 8 for all groups, except n = 4 for WT chow and n = 6 for WT HFD. (H) RT‐qPCR quantification of peroxisome proliferator‐activated receptor‐y coactivator (PGC)‐1α and c/ebpα transcripts in the same samples as panel F; n = 3. All graphs represent mean values with SEM, except for RT‐qPCR, represented as relative quantification (RQ) with RQmin − RQmax values. *P < 0.05, **P < 0.01, ***P < 0.001, one‐way ANOVA, with Bonferroni's multiple comparisons post‐test.
Figure 5
Figure 5
miR‐34a increases over in vitro white adipocyte differentiation, and miR‐34a−/− white adipocytes show increased lipid content at day 8. (A) RT‐qPCR quantification of miR‐34a transcripts over in vitro differentiation of SVF white preadipocytes (day 0–8) from WT murine epididymal (e)WAT, with mature adipocyte fraction (WAT) as a positive control, normalized to RNU6B; three mice were pooled together for each replicate of n = 3. (BD) RT‐qPCR gene expression over in vitro differentiation of SVF white preadipocytes (day 0–8) from miR‐34a−/− (KO) and WT murine eWAT, with mature adipocyte fraction (WAT) as a positive control, normalized to 18s rRNA; three mice were pooled together for each replicate of n = 3. (E,F) Quantification of lipid in day 8 in vitro adipocytes by FACS and BODIPY, represented as geometric mean fluorescence intensity (MFI) values representing content, and percentage positive cells; n = 3. (G,H) Adipokine Luminex measurements of leptin and insulin from supernatants of cultures in panels B‐D; n = 3. All graphs represent mean values with SEM, except for RT‐qPCR, represented as 1/ΔCt. Statistics were calculated using a two‐way ANOVA, with Bonferroni's multiple comparisons post‐test, or an unpaired Student's t‐test for FACS lipid measurements. A one‐way ANOVA and Dunnett's multiple comparisons post‐test was used to calculate statistics for panel A, compared with day 0. *P < 0.05, **P < 0.01, ***P < 0.001.
Figure 6
Figure 6
In vitro miR‐34a−/− brown adipocytes show an increase in percentage lipid+ cells but no change in mitochondrial markers. (A,B) RT‐qPCR quantification of miR‐34a, 34b*, and 34c* over in vitro WT brown adipocyte differentiation (day 0–8) from intrascapular (i)BAT SVF precursors, normalized to RNU6B; three mice were pooled together for each replicate, n = 3–4. (C,D) RT‐qPCR gene expression at day 8 of in vitro differentiation of SVF brown preadipocytes from miR‐34a−/− (KO) and WT murine iBAT, after a 4‐h stimulation with 0.1 µM noradrenaline (NA) or PBS control, normalized to 18s rRNA; three mice were pooled together for each replicate, n = 4. (E,F) Quantification of mitochondria in day 8 in vitro brown adipocytes stimulated with 0.1 µM NA or PBS for 4 h, by FACS and MitroTracker Deep Red, shown as geometric mean fluorescence intensity (MFI) values representing content, and percentage positive cells; n = 3. (G,H) Quantification of lipid in day 8 in vitro brown adipocytes stimulated with 0.1 µM NA or PBS for 20 h, by FACS and BODIPY, shown as geometric MFI values representing content, and percentage positive cells; n = 3. All graphs represent mean values with SEM, except for RT‐qPCR, represented as 1/ΔCt. Statistics were calculated using a one‐way ANOVA, with Bonferroni's multiple comparisons post‐test, or an unpaired Student's t‐test for FACS measurements. *P < 0.05, **P < 0.01, ***P < 0.001. (I) A diagrammatic representation of the theoretical mechanism in miR‐34a−/− (KO) mice, predisposing them to diet‐induced obesity. The imbalance in WAT metabolic genes caused by chronic overexpression of peroxisome proliferator‐activated receptor‐y coactivator (PGC)‐1α and mitochondrial dysfunction promotes lipid uptake/storage and weight gain when stressed with a high‐fat diet (HFD). As the tissue increases in size there is an increase in inflammatory cytokines, such as tumor necrosis factor (TNF)‐α, which polarize macrophages to an M1 phenotype. However, the KO macrophages are unresponsive to TNF‐α induction of CXCL1 and possibly other pro‐M1 genes, through overexpression of PGC1α inhibiting the NF‐κB subunit p65, suggesting an M2 phenotype. This inhibits the recruitment of neutrophils which could promote an M1 phenotype and inhibit lipogenic processes. The M2 phenotype is further promoted by interleukin (IL)‐5, which can induce eosinophils to produce pro‐M2 IL‐4. IL‐10 likely produced by macrophages can then stimulate adipocytes to be more insulin sensitive and dampen inflammatory processes, reducing pro‐obesity processes. Inhibition of key thermogenic genes in BAT predisposes the mice to obesity development, with overcompensation by the induction of PGC1α during HFD feeding.

References

    1. Gregor M. Inflammatory mechanisms in obesity. Annu Rev Immunol 2011;29:415. - PubMed
    1. Berg AH, Scherer PE. Adipose tissue, inflammation, and cardiovascular disease. Circ Res 2005;96:939–949. - PubMed
    1. Shoelson SE, Lee J, Goldfine AB. Inflammation and insulin resistance. J Clin Invest 2006;116:1793–1801. - PMC - PubMed
    1. Cannon B, Nedergaard J. Brown adipose tissue: function and physiological significance. Physiol Rev 2004;84:277–359. - PubMed
    1. van Rooij E, Olson EN. MicroRNA therapeutics for cardiovascular disease: opportunities and obstacles. Nat Rev Drug Discov 2012;11:860–872. - PMC - PubMed