. 2016 Apr 29;352(6285):608-12.
doi: 10.1126/science.aaf3229. Epub 2016 Apr 14.

Helminth infection promotes colonization resistance via type 2 immunity

Affiliations

Helminth infection promotes colonization resistance via type 2 immunity

Deepshika Ramanan et al. Science. .

Abstract

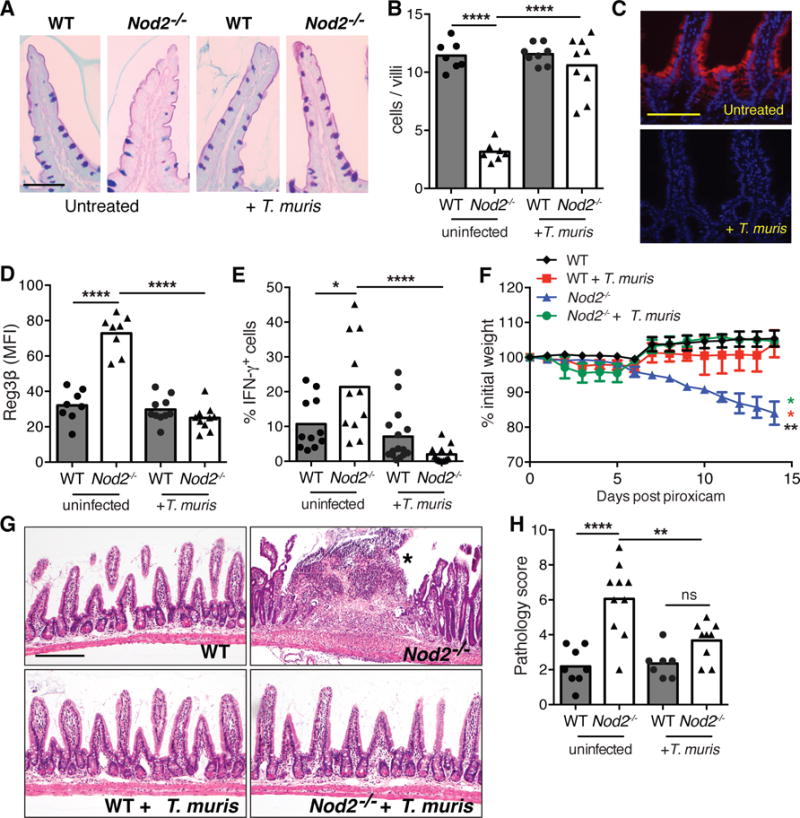
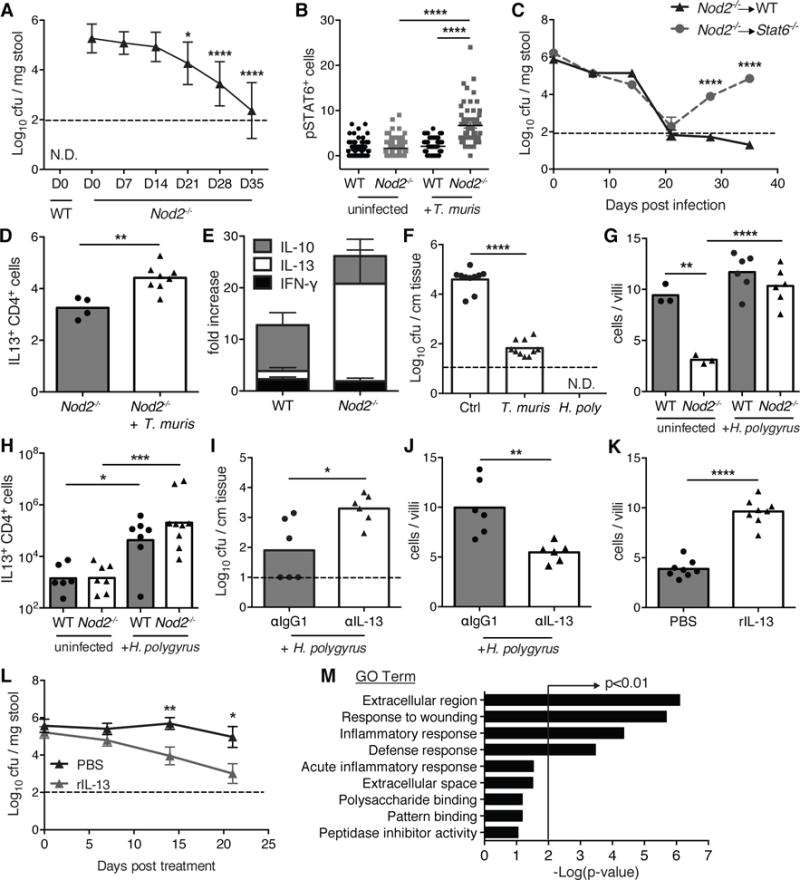
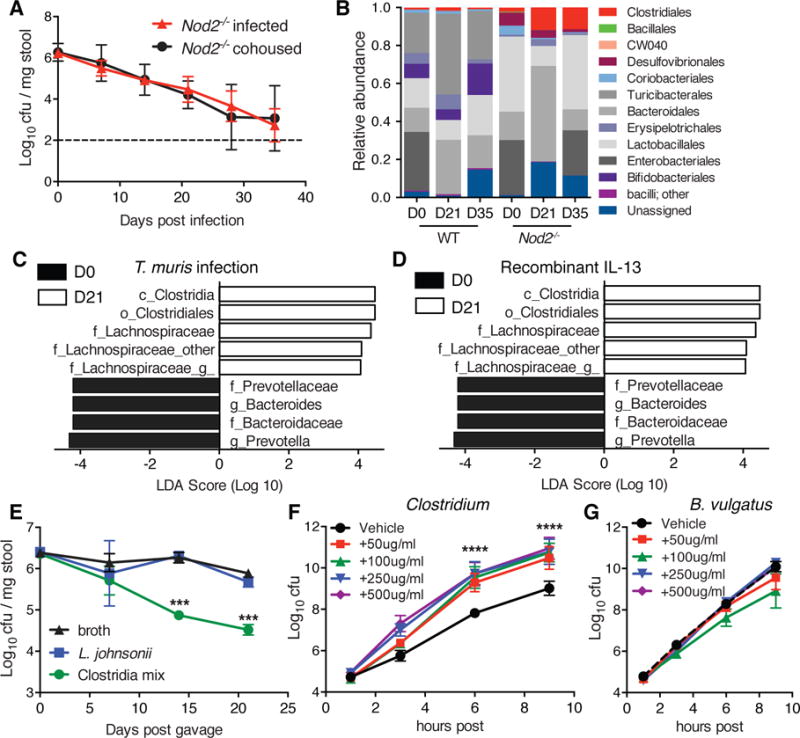
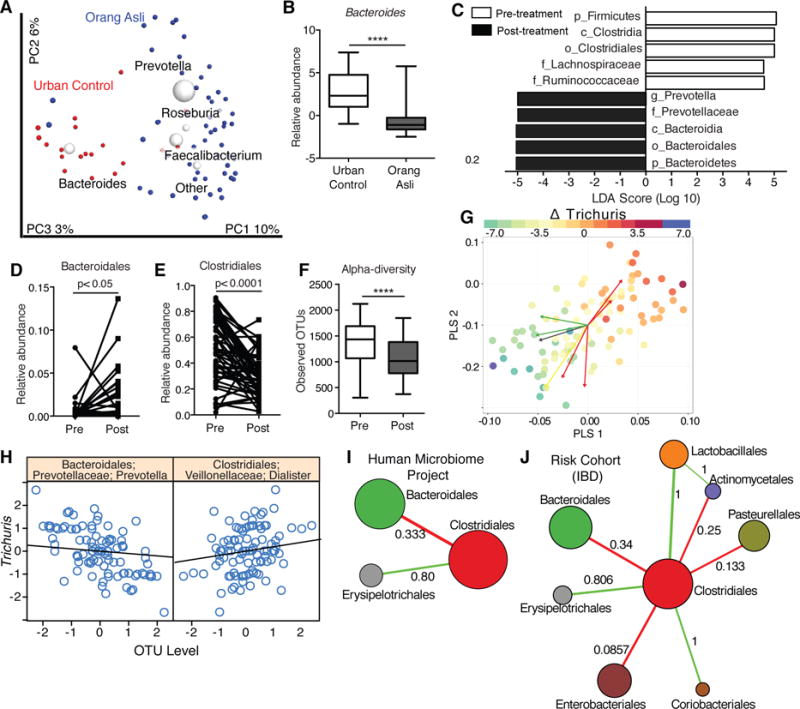
Increasing incidence of inflammatory bowel diseases, such as Crohn's disease, in developed nations is associated with changes to the microbial environment, such as decreased prevalence of helminth colonization and alterations to the gut microbiota. We find that helminth infection protects mice deficient in the Crohn's disease susceptibility gene Nod2 from intestinal abnormalities by inhibiting colonization by an inflammatory Bacteroides species. Resistance to Bacteroides colonization was dependent on type 2 immunity, which promoted the establishment of a protective microbiota enriched in Clostridiales. Additionally, we show that individuals from helminth-endemic regions harbor a similar protective microbiota and that deworming treatment reduced levels of Clostridiales and increased Bacteroidales. These results support a model of the hygiene hypothesis in which certain individuals are genetically susceptible to the consequences of a changing microbial environment.


Figures

Figure 1
Figure 1. Trichuris muris infection reverses intestinal abnormalities in Nod2−/− mice
(A–B) PAS-Alcian blue stained small intestinal sections (A) and quantification of the number of goblet cells displaying normal morphology per villi (B) from uninfected and T. muris infected WT and Nod2−/− mice (n≥7 per genotype). (C–D) Immunofluorescence (IF) analysis of Reg3β in small intestine (C) and quantification of the mean fluorescence intensity (MFI) (D) of above mice (n≥8 per genotype). (E) Quantification of the proportion of CD8+ intra-epithelial lymphocytes (IELs) expressing IFN-γ by flow cytometry (n≥11 per genotype). (F–H) Quantification of weight loss (F), H&E-stained small intestinal sections (G), and quantification of pathology (48) (H), following piroxicam treatment of uninfected and T. muris infected WT and Nod2−/− mice. Asterisk denotes an abscess in (G). (n≥7 per genotype). *p<0.05, **p<0.01, and ****p<0.0001 by ANOVA with Holm-Sidak multiple comparisons test for (B), (D), (E), (F), and (H). Scale bar represents 50 μm in (A), 100 μm in (C) and (G). Data are represented as mean ± SEM in (F), each data point represents an individual mouse and bar denotes mean in (B), (D), (E), and (H), from at least two independent experiments.
Figure 2
Figure 2. Helminth infection inhibits Bacteroides vulgatus colonization through a type-2 immune response
(A) Quantification of B. vulgatus colony forming units (cfu) in stool from T. muris infected WT and Nod2−/− mice (n≥10 per genotype). (B) Quantification of pSTAT6 staining in the small intestine of T. muris infected WT and Nod2−/− mice (n≥3 per genotype). (C) Quantification of B. vulgatus in stool from T. muris infected WT (Nod2−/− → WT) and Stat6−/− (Nod2−/−Stat6−/−) mice reconstituted with Nod2−/− bone marrow (BM). Both WT and Stat6−/− chimeric mice were gavaged with B. vulgatus to ensure equal colonization before T. muris infection (n≥5 per genotype). (D) Quantification of the total number of small intestinal lamina propria CD4+ T cells expressing IL-13 in uninfected and T. muris infected Nod2−/− mice (n≥4 per genotype). (E) Fold-increase in the number CD4+ T cells producing IFN-γ, IL-13, or IL-10 in the small intestinal lamina propria of T. muris infected WT and Nod2−/− mice, normalized to uninfected mice (n≥4 per genotype). (F) Quantification of B. vulgatus associated with small intestinal tissue of uninfected, T. muris infected, and H. polygyrus infected Nod2−/− mice (n≥10 per genotype). (G–H) Quantification of goblet cells displaying normal morphology per villi (G) and total number of small intestinal lamina propria CD4+ T cells expressing IL-13 (H) in uninfected and H. polygyrus infected WT and Nod2−/− mice (n≥3 per genotype). (I–J) Quantification of B. vulgatus in small intestinal tissue (I), and goblet cells displaying normal morphology (J) in H. polygyrus infected Nod2−/− mice treated with antibody to IL-13 or isotype control (n=6 per genotype). (K–L) Quantification of goblet cells displaying normal morphology (K) and B. vulgatus in stool (L) in Nod2−/− mice treated with recombinant IL-13 or PBS (n=8 per genotype). (M) Pathway analysis based on GO terms of genes upregulated in Nod2−/− mice treated with recombinant IL-13 compared to PBS controls. *p<0.05, **p<0.01, ***p<0.001, and ****p<0.0001 by ANOVA with Holm-Sidak multiple comparisons test for (A), (B), (G) and (H), and unpaired t-test for (C), (D), (F), and (I)−(L). Data are represented as mean ± SEM in (A), (B), (C), (E), and (L), each data point represents an individual mouse and bar denotes mean in (D), and (F)–(K), from at least two independent experiments.
Figure 3
Figure 3. Inhibition of Bacteroides vulgatus is associated with expansion of Clostridiales following helminth infection
(A) Quantification of B. vulgatus in stool harvested from uninfected and T. muris infected Nod2−/− mice co-housed for the duration of the experiment (n≥4). (B) Relative abundance of taxonomic groups in response to T. muris infection in the stool of WT and Nod2−/− mice as determined by 16S sequencing (n≥5 per genotype). (C) Supervised analysis of 16S sequencing data with LDA effect size (LEfSe) comparing Nod2−/− mice at D0 and D21 post infection with T. muris using an LDA threshold score of 4 (n≥5). (D) LEfSE analysis to determine alterations to the stool microbiota after recombinant IL-13 treatment of Nod2−/− mice using an LDA threshold score of 4 (n≥5). (E) Quantification of B. vulgatus in stool harvested from Nod2−/− mice gavaged with sterile broth, L. johnsonii, or a mix of 17 Clostridiales and Erysipelotrichales strains (n≥3). (F–G) Quantification of Clostridium species (Clostridiales #28) (F) or B. vulgatus (G) in the presence of varying concentrations of pig intestinal mucin or vehicle in the culture media. ***p<0.001, ****p<0.0001 by ANOVA with Holm-Sidak multiple comparisons test for (E), and (F). Data are represented as mean ± SEM from at least two independent experiments.
Figure 4
Figure 4. Helminth colonization in humans is associated with a decrease in Bacteroidales and an increase in Clostridiales
(A) Beta diversity plots of gut microbiota from urban controls in Kuala Lumpur (red dots) or the Orang Asli (blue dots). (B) Relative abundance of a dominant Bacteroides OTU in the Orang Asli and urban controls. (C–F) Supervised LEfSE analysis (C), relative abundance of Bacteroidales (D) and Clostridiales (E), and alpha diversity as Observed OTUs (F) of the Orang Asli stool microbiota pre and post treatment with Albendazole. (n= 19 for urban controls and 55 Orang Asli. n = 53 for deworming experiments). (G) Partial Least Squares regression biplots examining within subject variances with repeated measures design to identify bacterial taxa associated with Trichuris trichiura worm burden (intensity of spots). Red arrows are Clostridiales taxa and green arrows are Bacteroidales taxa. (H) Specific OTUs identified to be positively (Dialister) or negatively (Prevotella) associated with changes to T. trichiura egg burdens. (I–J) Microbial network inference demonstrating an antagonistic relationship between Clostridiales and Bacteroidales communities from the Human Microbiome Project (I) and the pediatric IBD RISK cohort (J). The node diameter is proportional to the geometric mean of the OTU’s relative abundance. Numerical values on the edges represent the fraction of edges that are either majority positive (Green) or majority negative (Red). Also see Figure S10. ****p<0.0001 by unpaired t-test in (B), and paired t-test in (D)–(F).

Comment in

References

    1. Belkaid Y, Hand TW. Role of the microbiota in immunity and inflammation. Cell. 2014;157:121–141. - PMC - PubMed
    1. Weinstock JV, Elliott DE. Helminths and the IBD hygiene hypothesis. Inflamm Bowel Dis. 2009;15:128–133. - PubMed
    1. Kamada N, Nunez G. Regulation of the immune system by the resident intestinal bacteria. Gastroenterology. 2014;146:1477–1488. - PMC - PubMed
    1. Jaenike J, Unckless R, Cockburn SN, Boelio LM, Perlman SJ. Adaptation via symbiosis: recent spread of a Drosophila defensive symbiont. Science. 2010;329:212–215. - PubMed
    1. Buffie CG, et al. Precision microbiome reconstitution restores bile acid mediated resistance to Clostridium difficile. Nature. 2015;517:205–208. - PMC - PubMed

Publication types

Substances