. 2016 Sep;10(9):2235-45.
doi: 10.1038/ismej.2016.13. Epub 2016 Mar 8.

Ecological robustness of the gut microbiota in response to ingestion of transient food-borne microbes

Affiliations

Ecological robustness of the gut microbiota in response to ingestion of transient food-borne microbes

Chenhong Zhang et al. ISME J. 2016 Sep.

Abstract

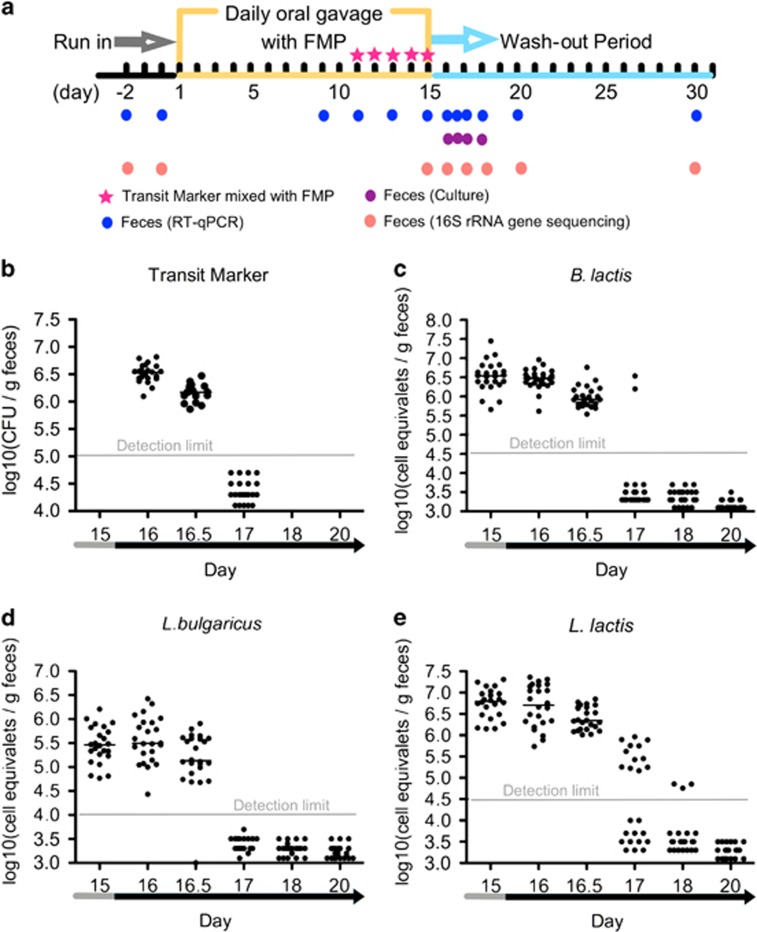
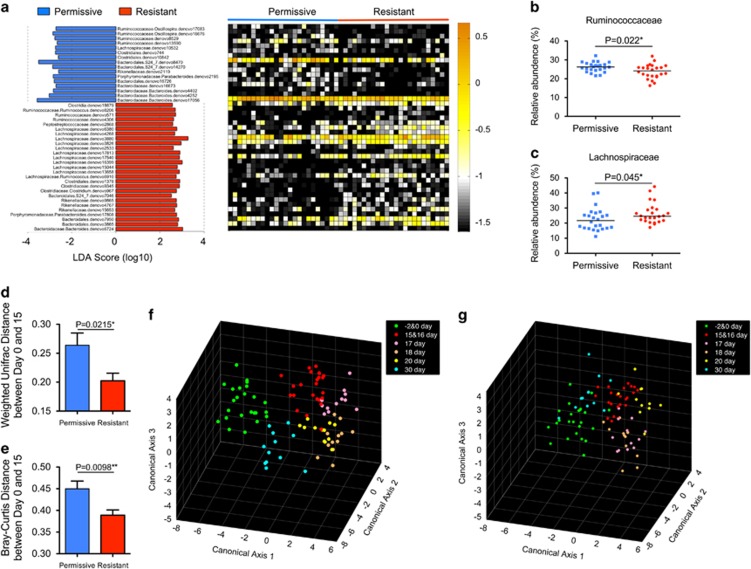
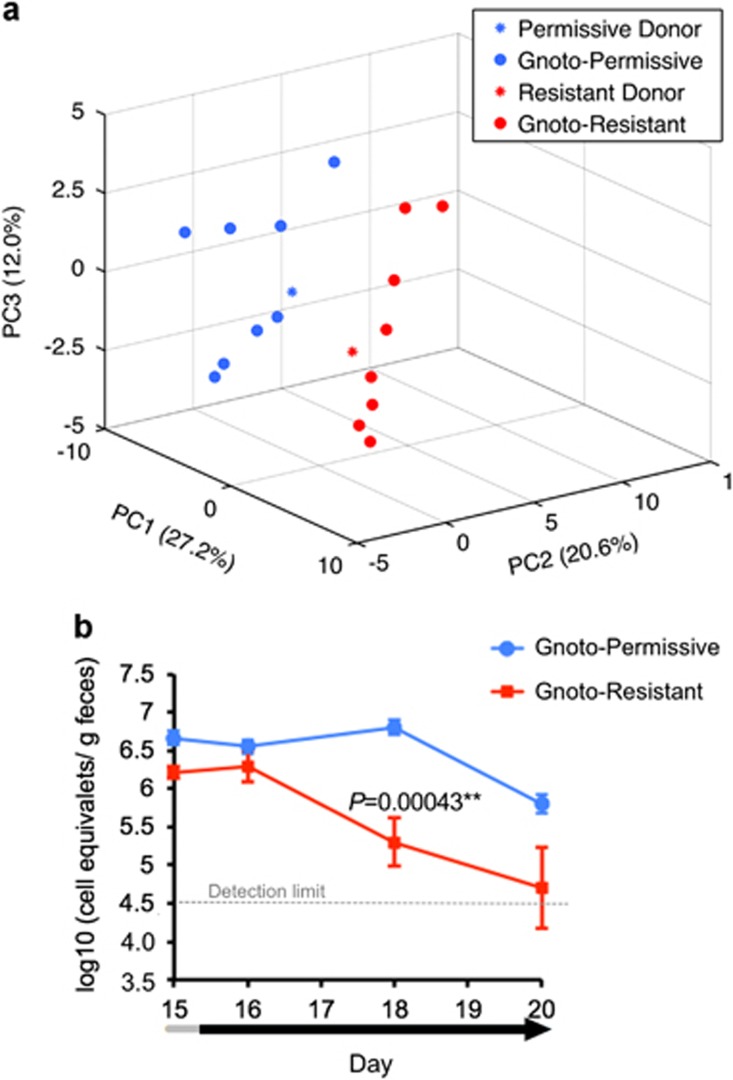
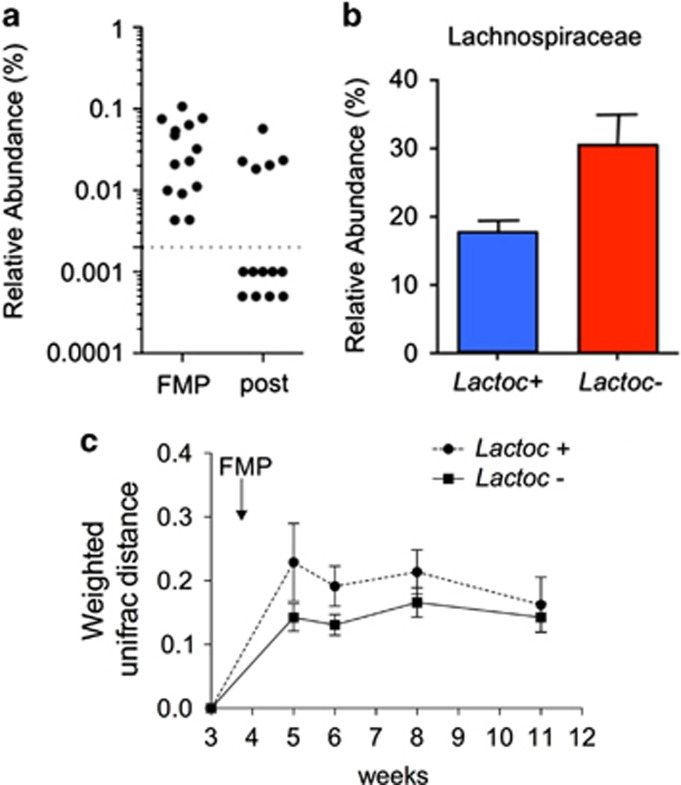
Resident gut microbes co-exist with transient bacteria to form the gut microbiota. Despite increasing evidence suggesting a role for transient microbes on gut microbiota function, the interplay between resident and transient members of this microbial community is poorly defined. We aimed to determine the extent to which a host's autochthonous gut microbiota influences niche permissivity to transient bacteria using a fermented milk product (FMP) as a vehicle for five food-borne bacterial strains. Using conventional and gnotobiotic rats and gut microbiome analyses (16S rRNA genes pyrosequencing and reverse transcription qPCR), we demonstrated that the clearance kinetics of one FMP bacterium, Lactococcus lactis CNCM I-1631, were dependent on the structure of the resident gut microbiota. Susceptibility of the resident gut microbiota to modulation by FMP intervention correlated with increased persistence of L. lactis. We also observed gut microbiome configurations that were associated with altered stability upon exposure to transient bacteria. Our study supports the concept that allochthonous bacteria have transient and subject-specific effects on the gut microbiome that can be leveraged to re-engineer the gut microbiome and improve dysbiosis-related diseases.


Figures

Figure 1
Figure 1
Experimental design and fecal abundance of L. lactis, B. lactis, L. bulgaricus and G. stearothermophilus spores in conventional rat. (a) Experimental design. (b) Fecal abundance of Geobacillus stearothermophilus spores. Each symbol represents a sample from an individual rat (n=24). RT-qPCR quantification of (c) L. lactis, (d) B. lactis and (e) L. bulgaricus. Each symbol represents a sample from a given individual. Data expressed as log10 (equivalent cells gm−1 feces). Medians are reported.
Figure 2
Figure 2
Permissive and resistant rats differ in their gut microbiota and in the amplitude of ecological changes induced by the FMP. (a) LDA scores computed for taxa differentially abundant between permissive and resistant rats at baseline (Day –2 and 0). The heat map shows the relative abundance (log10 transformation) of OTUs in each sample. Abundance of (b) Ruminococcaceae and (c) Lachnospiraceae. Each symbol represents a sample from an individual rat. Data are expressed as relative abundance (%). The median of the data is shown. **P<0.01 and *P<0.05 by Kruskal–Wallis (KW) sum-rank test. The distance between Day 0 and 15 of each rat was calculated using the (d) UniFrac and (e) Bray–Curtis distances, mean±s.e.m. **P<0.01 and *P<0.05 by Student's t-test. Canonical analysis of principal coordinates (CAP) of the gut microbiota in (f) permissive (n=12) and (g) resistant (n=12) rats prior to (Day −2 and 0), during (Day 15 and 16) and after FMP administration period (Day 17, 18, 20 and 30).
Figure 3
Figure 3
Transplantation of fecal microbiota from permissive and resistant donors into germ-free rats. (a) Principal component analysis (PCA) of the fecal bacterial communities of permissive or resistant donors and their recipients. (b) Abundance of L. lactis in gnotobiotic rats inoculated with a permissive microbiota (Gnoto-permissive; n=8) or a resistant microbiota (Gnoto-resistant; n=8). Fecal samples were collected after 15 days of daily FMP administration and during the wash-out period. Data are expressed as log10 (equivalent cells gm−1 feces) and mean±se.m. for each group. **P<0.01 by Student's t-test.
Figure 4
Figure 4
Evidence of permissive and resistant phenotypes in human (a) Distribution of Lactococcus carriers (Lactoc+) and non-carriers (Lactoc–) during and after the FMP administration. (b) Relative abundance of Lachnospiraceae in Lactococcus carriers and non-carriers. (c) Kinetics of weighted UniFrac distances of Lactoc+ and Lactoc– subjects expressed as mean±s.e.m. A linear mixed model showed a difference (P=0.086) between groups across the intervention. x axis label (weeks) were numbered as per the Mc Nulty et al. study.

References

    1. Anderson MJ, Willis TJ. (2003). Canonical analysis of principal coordinates: a useful method of constrained ordination for ecology. Ecology 84: 511–525.
    1. Arumugam M, Raes J, Pelletier E, Le Paslier D, Yamada T, Mende DR et al. (2011). Enterotypes of the human gut microbiome. Nature 473: 174–180. - PMC - PubMed
    1. Atarashi K, Tanoue T, Oshima K, Suda W, Nagano Y, Nishikawa H et al. (2013). Treg induction by a rationally selected mixture of Clostridia strains from the human microbiota. Nature 500: 232–236. - PubMed
    1. Bachmann H, Starrenburg MJ, Molenaar D, Kleerebezem M, van Hylckama Vlieg JE. (2012). Microbial domestication signatures of Lactococcus lactis can be reproduced by experimental evolution. Genome Res 22: 115–124. - PMC - PubMed
    1. Caporaso JG, Kuczynski J, Stombaugh J, Bittinger K, Bushman FD, Costello EK et al. (2010). QIIME allows analysis of high-throughput community sequencing data. Nat Methods 7: 335–336. - PMC - PubMed