. 2016 Mar 4:6:22785.
doi: 10.1038/srep22785.

Virus infection mediates the effects of elevated CO2 on plants and vectors

Affiliations

Virus infection mediates the effects of elevated CO2 on plants and vectors

Piotr Trębicki et al. Sci Rep. .

Abstract

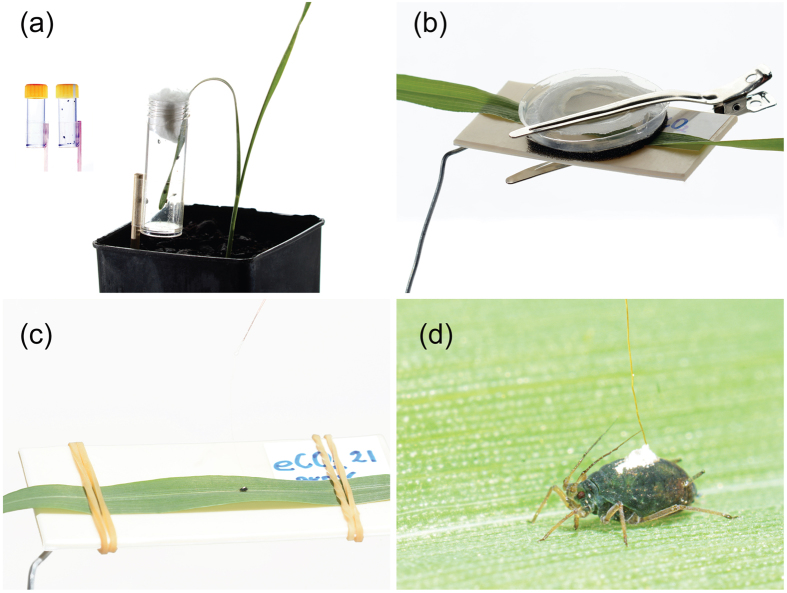
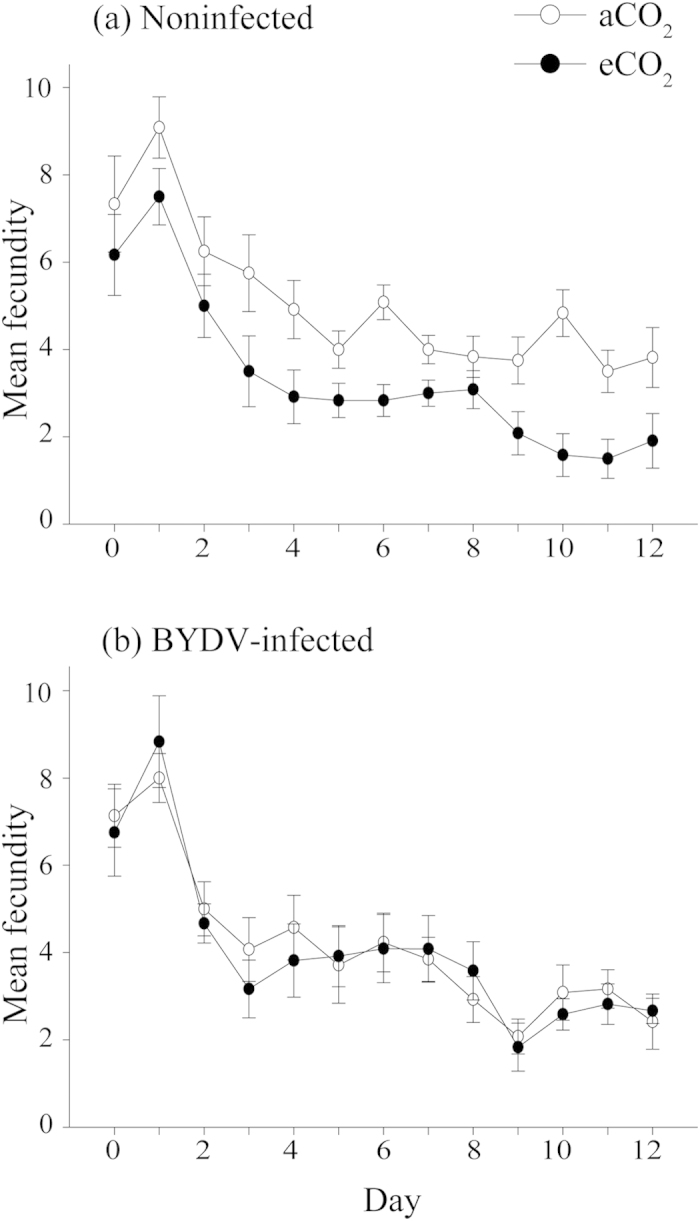
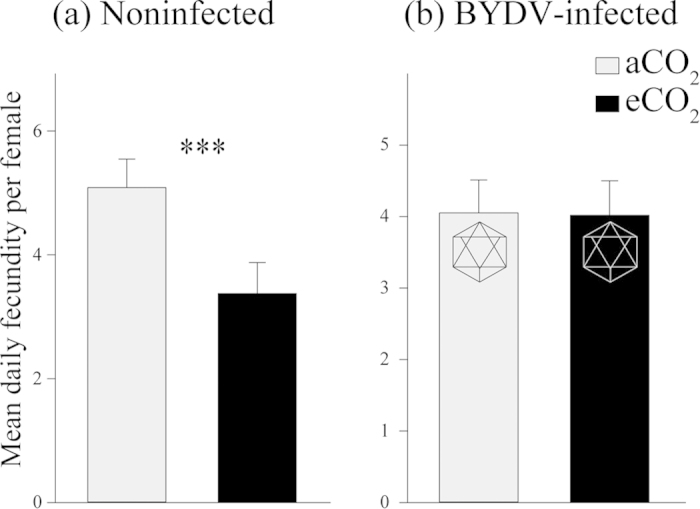
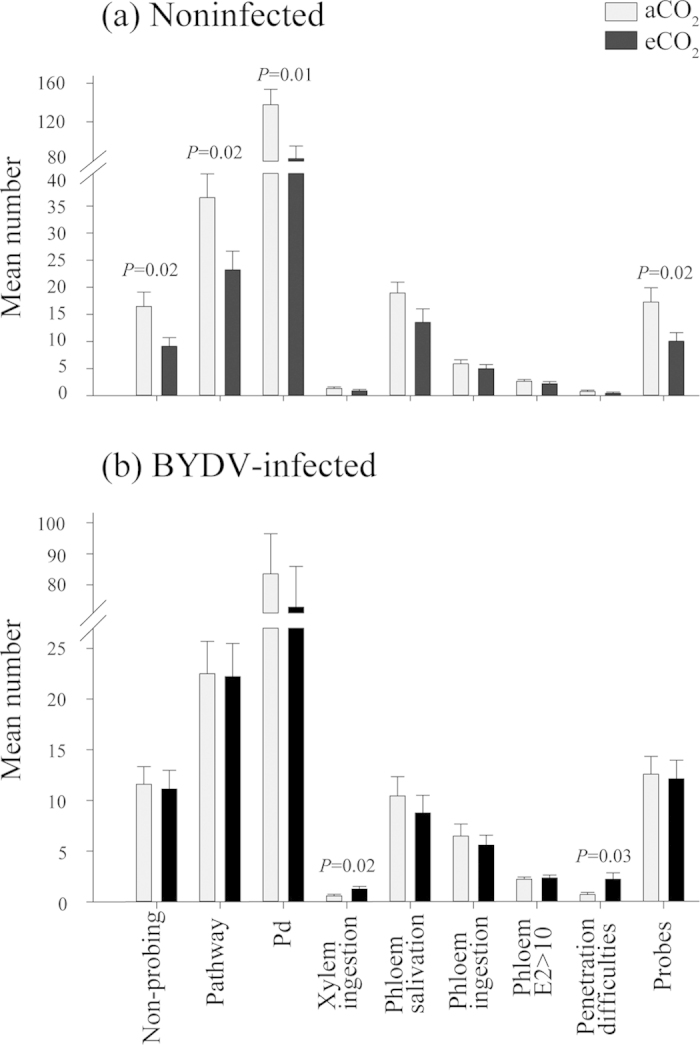
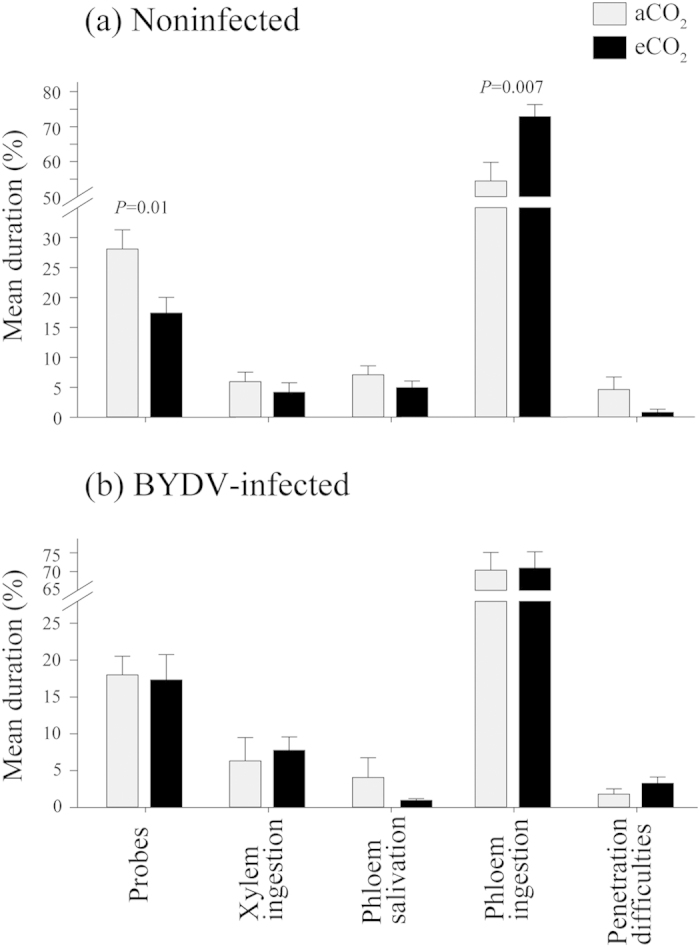
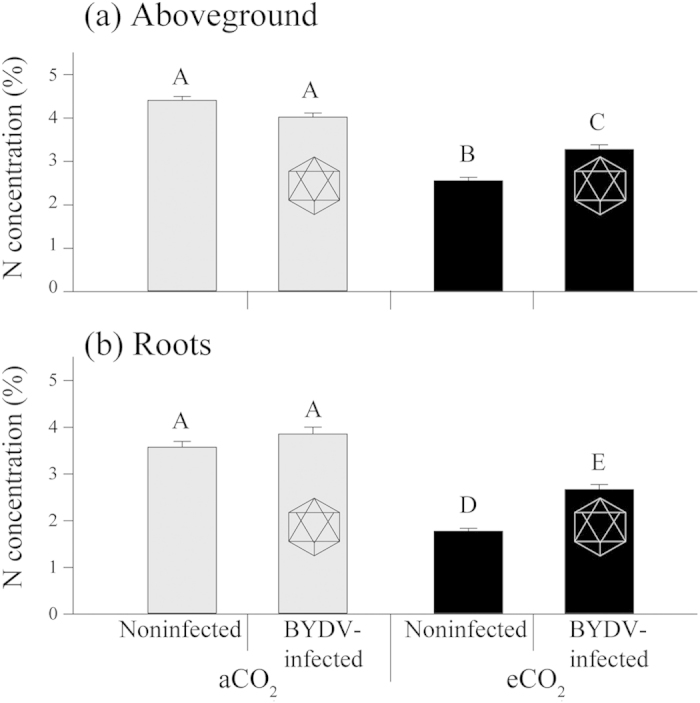
Atmospheric carbon dioxide (CO2) concentration has increased significantly and is projected to double by 2100. To increase current food production levels, understanding how pests and diseases respond to future climate driven by increasing CO2 is imperative. We investigated the effects of elevated CO2 (eCO2) on the interactions among wheat (cv. Yitpi), Barley yellow dwarf virus and an important pest and virus vector, the bird cherry-oat aphid (Rhopalosiphum padi), by examining aphid life history, feeding behavior and plant physiology and biochemistry. Our results showed for the first time that virus infection can mediate effects of eCO2 on plants and pathogen vectors. Changes in plant N concentration influenced aphid life history and behavior, and N concentration was affected by virus infection under eCO2. We observed a reduction in aphid population size and increased feeding damage on noninfected plants under eCO2 but no changes to population and feeding on virus-infected plants irrespective of CO2 treatment. We expect potentially lower future aphid populations on noninfected plants but no change or increased aphid populations on virus-infected plants therefore subsequent virus spread. Our findings underscore the complexity of interactions between plants, insects and viruses under future climate with implications for plant disease epidemiology and crop production.


Figures

Figure 1
Figure 1
Illustration of (a) wheat inoculation with Barley yellow dwarf virus, where the tip of a leaf is inserted into a small tube containing 10 viruliferous adult R. padi and secured at the top with cotton wool to prevent aphid escape. All BYDV inoculations were performed using this method. (b) Clip cage used to study R. padi development and fecundity on noninfected and BYDV-infected plants under two CO2 levels. (c) During EPG, a leaf was placed on the support and secured with rubber bands to prevent plant movement. (d) Close up of R. padi probing on wheat, connected via silver glue and gold wire to the EPG insect electrode to record feeding behavior.
Figure 2
Figure 2
R. padi fecundity on (a) noninfected and (b) BYDV-infected wheat plants grown under ambient (aCO2; 385 μmol mol−1) or elevated CO2 (eCO2; 650 μmol mol−1). Measured by the daily count of newly emerged nymphs, where day 0 indicates the point when aphids first reached maturity. Error bars represent standard error (SEM). N = 17.
Figure 3
Figure 3
Mean daily fecundity per female recorded on wheat (a) noninfected and (b) BYDV-infected plants grown at ambient (385 μmol mol−1) or elevated (650 μmol mol−1) CO2 concentrations; * * * indicates significant difference at P < 0.001. Error bars represent standard error (SEM). Hexagon symbol indicates virus presence. N = 17.
Figure 4
Figure 4
Number of R. padi probing activities on (a) noninfected plants and (b) BYDV-infected plants grown at ambient (385 μmol mol−1) or elevated (650 μmol mol−1) CO2 concentrations. Potential drop (Pd or intracellular penetration) indicates plant cell puncture, and Phloem E2 > 10 sustained phloem ingestion refers to phloem ingestion of ≥10 min. Where statistically significant, P values for each pair (aCO2, eCO2 treatments) are noted above the bars. Error bars represent standard error (SEM). Noninfected wheat N = 18, BYDV-infected wheat N = 22.
Figure 5
Figure 5
Percentage duration (time) of R. padi probing activities on (a) noninfected and (b) BYDV-infected wheat plants grown at ambient (385 μmol mol−1) or elevated (650 μmol mol−1) CO2 concentrations. Where statistically significant, P values for each pair (aCO2, eCO2 treatments) are noted above the bars. Error bars represent standard error (SEM). Noninfected wheat N = 18, BYDV-infected wheat N = 22.
Figure 6
Figure 6
Nitrogen (N) concentration (%) of (a) aboveground plant parts and (b) roots of noninfected and BYDV-infected wheat plants grown under ambient (aCO2; 385 μmol mol−1) or elevated CO2 (eCO2; 650 μmol mol−1). Error bars represent standard error (SEM); different uppercase letters indicate significant differences between plant parts (aboveground and roots) and treatments (Tukey’s multiple range test, P < 0.05). Hexagon symbol indicates virus presence.

References

    1. IPCC. Climate Change 2013: The Physical Science Basis. Contribution of Working Group I to the Fifth Assessment Report of the Intergovernmental Panel on Climate Change (Cambridge University Press, 2013).
    1. Ainsworth E. A. & Long S. P. What have we learned from 15 years of free-air CO2 enrichment (FACE)? A meta-analytic review of the responses of photosynthesis, canopy properties and plant production to rising CO2. New Phytol. 165, 351–372, doi: 10.1111/j.1469-8137.2004.01224.x (2005). - DOI - PubMed
    1. Kimball B. A., Kobayashi K. & Bindi M. In Advances in Agronomy Vol. 77 (ed Donald L. Sparks) 293–368 (Academic Press, 2002).
    1. Drake B. G., Gonzàlez-Meler M. A. & Long S. P. More efficient plants: a consequence of rising atmospheric CO2? Annu. Rev. Plant Biol. 48, 609–639 (1997). - PubMed
    1. Dáder B., Fereres A., Moreno A. & Trębicki P. Elevated CO2 impacts bell pepper growth with consequences to Myzus persicae life history, feeding behaviour and virus transmission ability. Sci. Rep. 6, 19120; doi: 10.1038/srep19120 (2016). - DOI - PMC - PubMed

Publication types

LinkOut - more resources