. 2015 Sep 28:5:14472.
doi: 10.1038/srep14472.

Metabolomics insights into chronic kidney disease and modulatory effect of rhubarb against tubulointerstitial fibrosis

Affiliations

Metabolomics insights into chronic kidney disease and modulatory effect of rhubarb against tubulointerstitial fibrosis

Zhi-Hao Zhang et al. Sci Rep. .

Abstract

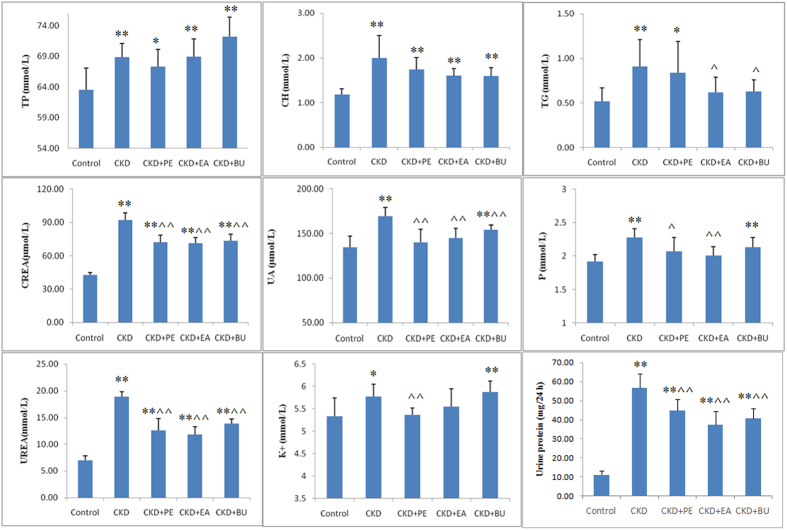
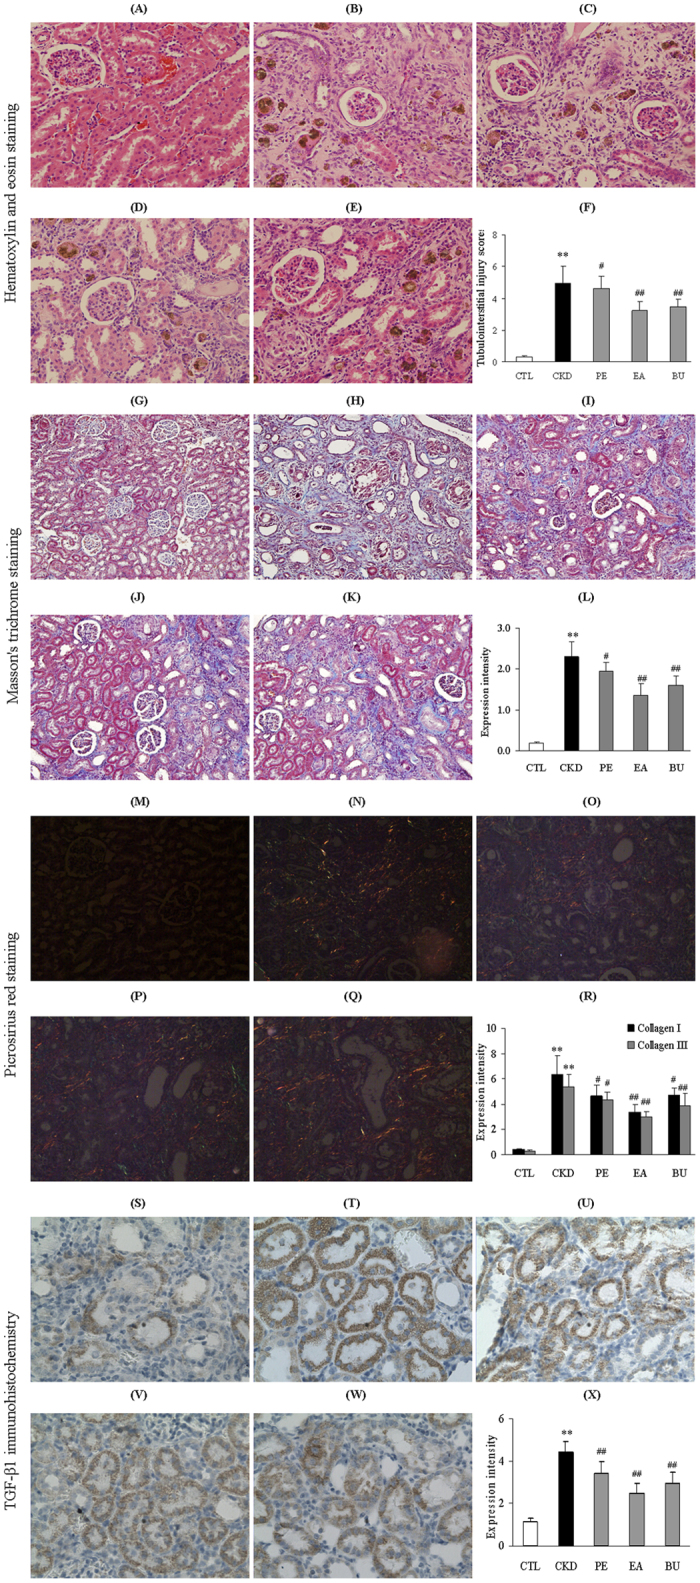
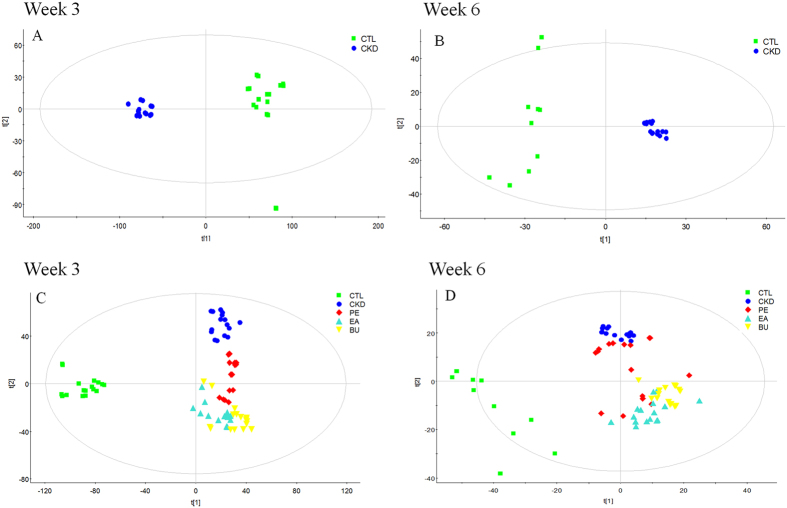
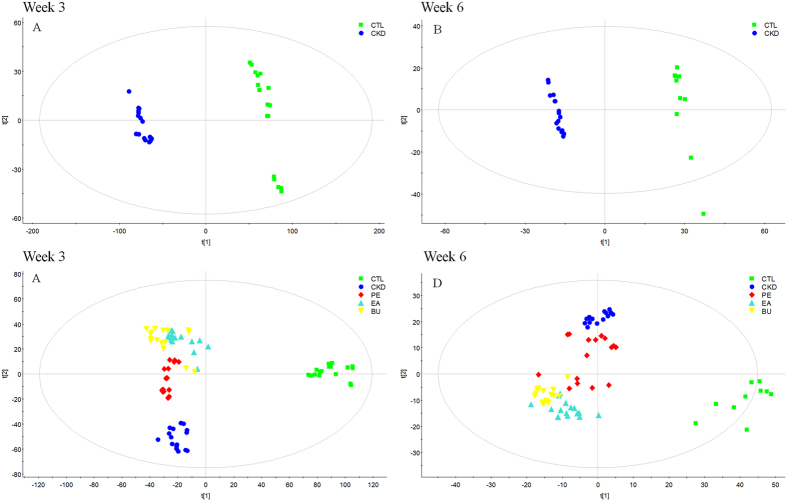
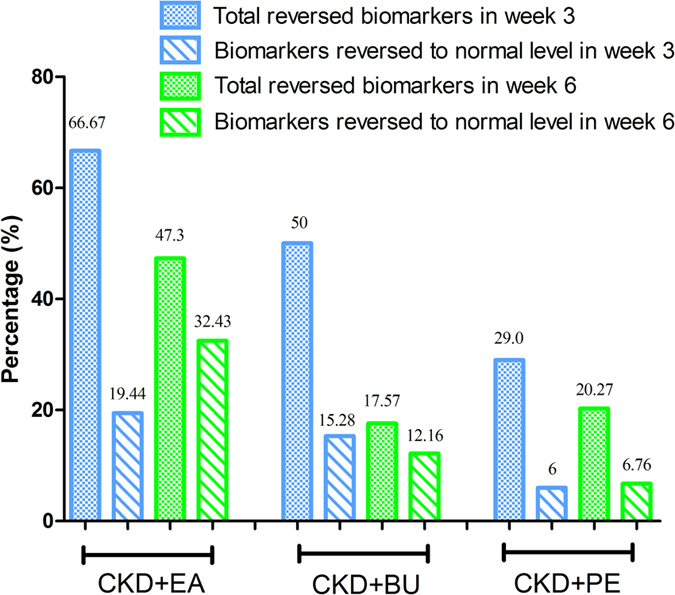
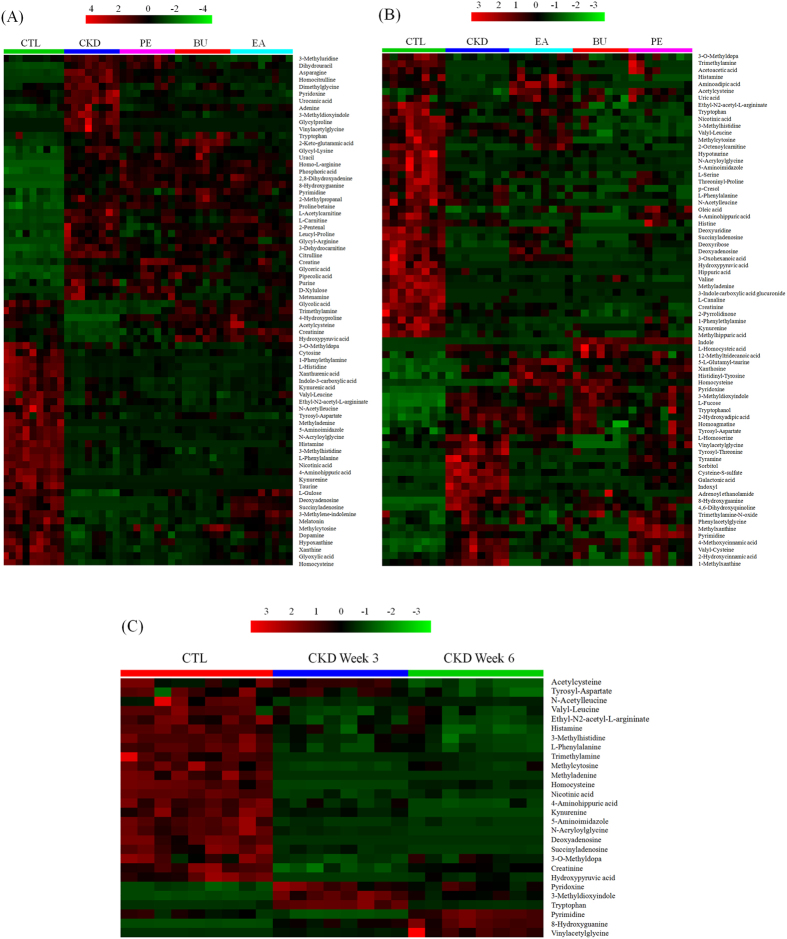
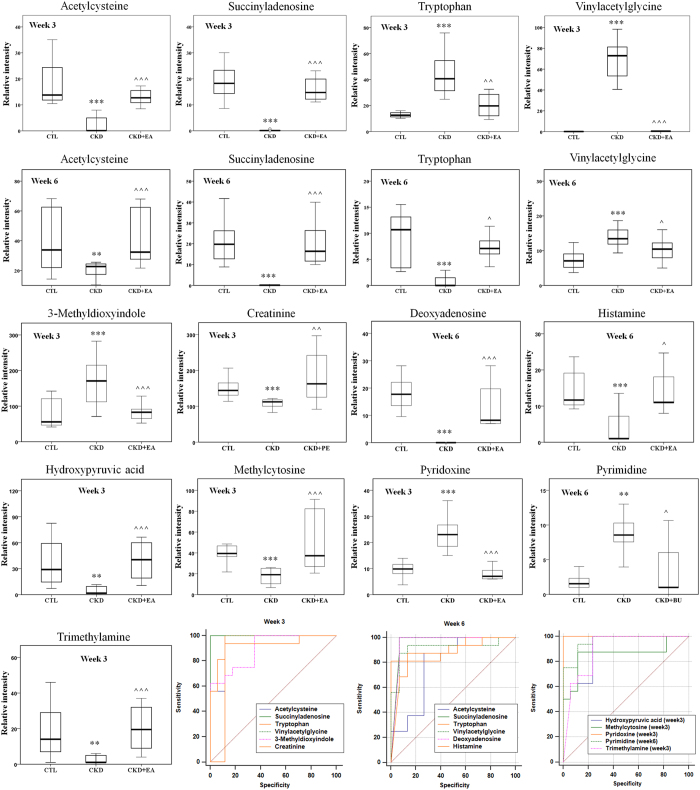
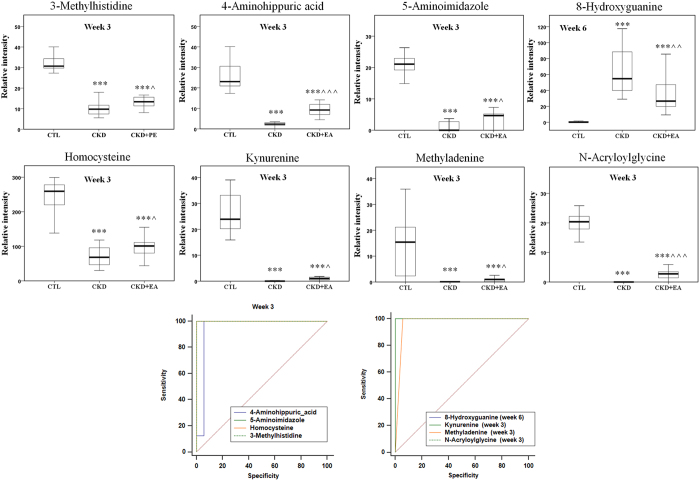
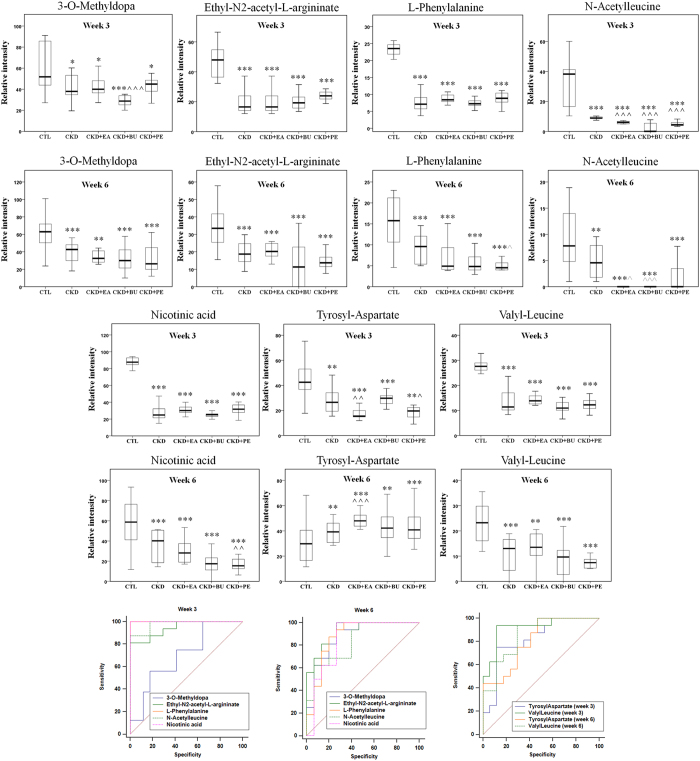
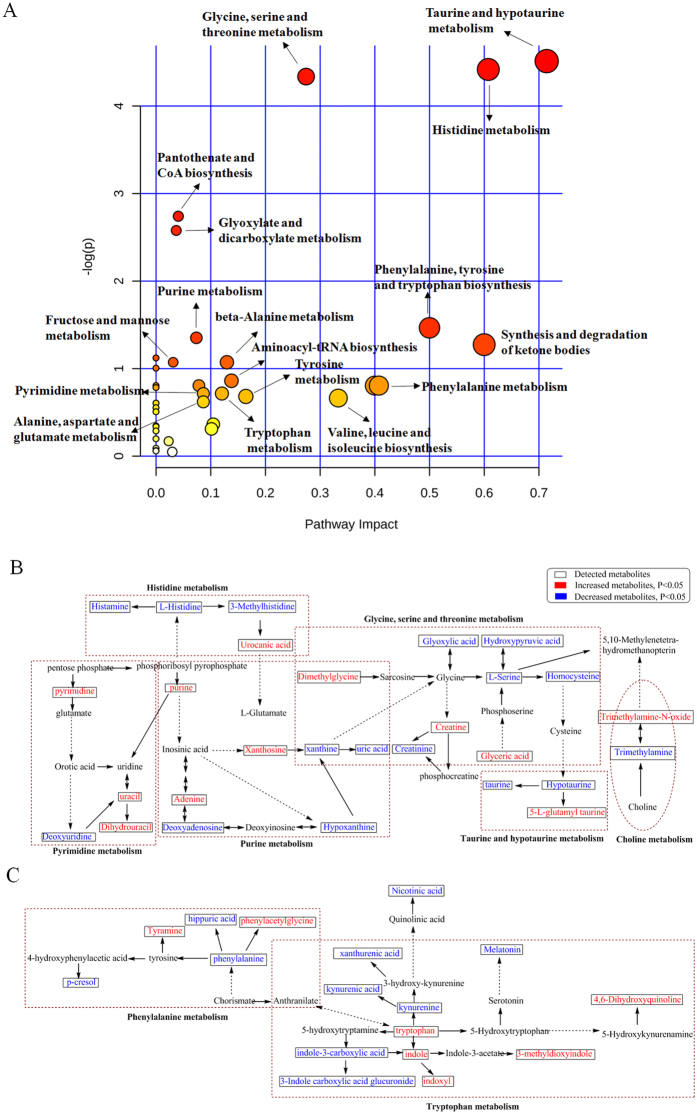
Chronic kidney disease (CKD) is a major public health problem worldwide. Rhubarb has been shown to have nephroprotective and anti-fibrotic activities in patients with CKD. However, bioactive fractions and biochemical mechanism of anti-fibrotic properties of rhubarb remain unclear. Here we applied ultra-performance liquid chromatography-quadrupole time-of-flight mass spectrometry together with univariate and multivariate statistical analyses to investigate the urinary metabolite profile in rats with adenine-induced CKD treated with the petroleum ether (PE)-, ethyl acetate (EA)- and n-butanol (BU)- extracts of rhubarb. Significant differences in renal function, kidney histopathology as well as metabolic profiles were observed between CKD and control rats. Changes in these parameters reflected characteristic phenotypes of CKD rats. We further identified a series of differential urinary metabolites for CKD rats, suggesting metabolic dysfunction in pathway of amino acid, purine, taurine, and choline metabolisms. Treatment with EA, BU and PE extracts of rhubarb improved renal function and histopathological abnormalities including interstitial fibrosis and inflammation, and either fully or partially reversed the abnormalities of the urinary metabolites. Among them, the nephroprotective effect of EA extract was stronger than BU and PE extracts. This work provides important mechanistic insights into the CKD and nephroprotective effects of different rhubarb extract against tubulo-interstitial fibrosis.


Figures

Figure 1
Figure 1. Biochemical parameters in the normal control, CKD+PE, CKD+EA and CKD+BU groups.
Serum total protein (TP), cholesterol (CH), triglyceride (TG), creatinine (CREA), urea, uric acid (UA), phosphorus (P), potassium (K+) and urine protein in the control, untreated CKD, EA-treated CKD (CKD+EA), BU-treated CKD (CKD+BU) and PE-treated CKD (CKD+PE) groups. *p < 0.05, **p < 0.01 compared to control group; ^p < 0.05, ^^p < 0.01 compared to CKD group to control group; ^p < 0.05, ^^p < 0.01 compared to CKD group.
Figure 2
Figure 2. Representative photomicrographs of the H&E staining, Masson’s trichrome staining, Picrosirius red staining and TGF-β1 immunohistochemistry from kidney sections in normal control rat, CKD rat, CKD+PE rat, CKD+EA rat and CKD+BU rat at week 6.
The kidney tissue in the CKD animals exhibited significant tubulointerstitial injury, increased collagen I, collagen III and fibrosis and heavy inflammatory cell infiltration which were significantly improved with PE, EA and BU extracts of rhubarb. Bar graphs depicting tubulointerstitial injury scores (F) and expression intensity of Masson’s staining (L), picrosirius red staining (R) and TGF-β1 immunohistochemistry intensity (X) in the study groups. (A,G,M,S) control rat; (B,H,N,T) CKD rat; (C,I,O,U) CKD+PE rat; (D,J,P,V) CKD+EA rat; (E,K,Q,W) CKD+BU rat. *p < 0.05, **p < 0.01 compared to control rat; #p < 0.05, ##p < 0.01 compared to CKD rat.
Figure 3
Figure 3
PCA scores plot of comparing control group and CKD group at week 3 (A) and week 6 (B); PCA scores plot of comparing control, CKD, CKD+PE, CKD+EA and CKD+BU groups at week 3 (C) and week 6 (D).
Figure 4
Figure 4
OPLS-DA score plots generated from the OPLS-DA of the QTOF/HDMS data from control group and CKD group at week 3 (A) and week 6 (B); PLS-DA score plots from control, CKD, CKD+PE, CKD+EA and CKD+BU groups at week 3 (C) and week 6 (D). (A) R2X = 0.515, R2Y = 0.996, Q2 = 0.993; (B) R2X = 0.356, R2Y = 0.996, Q2 = 0.955; and (C) R2X = 0.618, R2Y = 0.983, Q2 = 0.938. (D) R2X = 0.416, R2Y = 0.982, Q2 = 0.840.
Figure 5
Figure 5. Percentage of the reversed biomarkers in the total biomarkers at week 3 and 6; Percentage of the biomarkers that reversed to normal level in the total biomarkers at weeks 3 and 6.
This figure reflected the therapeutic effect of EA, BU and PE treatments on CKD rats.
Figure 6
Figure 6
Heat maps for urinary metabolites at weeks 3 (A) and 6 (B) and the biomarkers appeared at both weeks 3 and 6 (C). The color of each section is proportional to the significance of change of metabolites (red, upregulated; green, downregulated). Rows: metabolites; Columns: samples.
Figure 7
Figure 7. Therapeutic effect of EA, BU and PE extracts on CKD rats and receiver operating characteristic (ROC) curve of 28 biomarkers.
Box plots showing relative abundance of 13 identified biomarkers that were completely reversed to normal level by treatment with EA, BU or PE extracts in week 3 or week 6 and their ROC curve. *p < 0.05, **p < 0.01, ***p < 0.001 significant difference compared to the control group; ^p < 0.05, ^^p < 0.01, ^^^p < 0.001 significant difference compared to the CKD group.
Figure 8
Figure 8. Therapeutic effect of EA, BU and PE extracts on CKD rats and receiver operating characteristic (ROC) curve of 28 biomarkers.
Box plots showing relative abundance of 8 identified biomarkers that were reversed by treatment with EA, BU or PE extracts in week 3 or week 6 and their ROC curve. *p < 0.05, **p < 0.01, ***p < 0.001 significant difference compared to the control group; ^p < 0.05, ^^p < 0.01, ^^^p < 0.001 significant difference compared to the CKD group.
Figure 9
Figure 9. Therapeutic effect of EA, BU and PE extracts on CKD rats and receiver operating characteristic (ROC) curve of 28 biomarkers.
Box plots showing relative abundance of 7 identified biomarkers that can’t be reversed by treatment with EA, BU or PE extracts in week 3 or week 6 and their ROC curve. *p < 0.05, **p < 0.01, ***p < 0.001 significant difference compared to the control group; ^p < 0.05, ^^p < 0.01, ^^^p < 0.001 significant difference compared to the CKD group.
Figure 10
Figure 10. Pathway analysis of identified metabolites in the different groups.
(A) On the basis of all differential metabolites (Table S1 and S2 in the Supporting Information), global metabolic disorders of the most relevant pathways induced by adenine were revealed using the MetaboAnalyst; small p value and big pathway impact factor indicate that the pathway is greatly influenced. (B) Histidine metabolism, glycine, serine and threonine metabolism, taurine and hypotaurine metabolism, purine metabolism, pyrimidine metabolism and choline metabolism. (C) Phenylalanine metabolism and tryptophan metabolism. Red color represents increased metabolites in CKD rats; Blue color represents decreased metabolites in CKD rats. Dotted arrow indicates multiple processes. Solid arrow indicates single process.

References

    1. Lameire N., Jager K., Van Biesen W., de Bacquer D. & Vanholder R. Chronic kidney disease: a European perspective. Kidney Int. 68, S30–38 (2005). - PubMed
    1. Levey A. S. et al. Chronic kidney disease as a global public health problem: approaches and initiatives - a position statement from Kidney Disease Improving Global Outcomes. Kidney Int. 72, 247–59 (2007). - PubMed
    1. Zeisberg M. & Neilson E. G. Mechanisms of tubulointerstitial fibrosis. J. Am. Soc. Nephrol. 21, 1819–34 (2010). - PubMed
    1. Agarwal S. K., Singh S. S., Lakshmi V., Verma S. & Kumar S. Chemistry and pharmacology of rhubarb (Rheum species)—a review. J. Sci. Ind. Res. 60, 1–9 (2001).
    1. Kashiwada Y., Nonaka G. I. & Nishioka I. Studies on Rhubarb (Rhei Rhizoma). XV: Simultaneous determination of phenolic constituents by high-performance liquid chromatography. Cheml. Pharm. Bull. 37, 999–1004 (1989).

Publication types

MeSH terms