. 2015 May 7;521(7550):90-93.
doi: 10.1038/nature14139. Epub 2015 Feb 16.

Vertically transmitted faecal IgA levels determine extra-chromosomal phenotypic variation

Affiliations

Vertically transmitted faecal IgA levels determine extra-chromosomal phenotypic variation

Clara Moon et al. Nature. .

Abstract

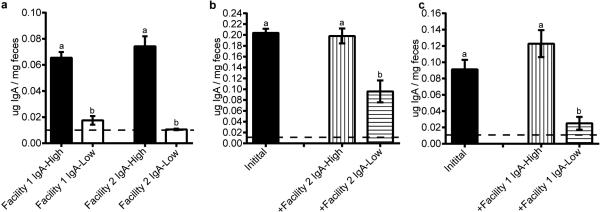
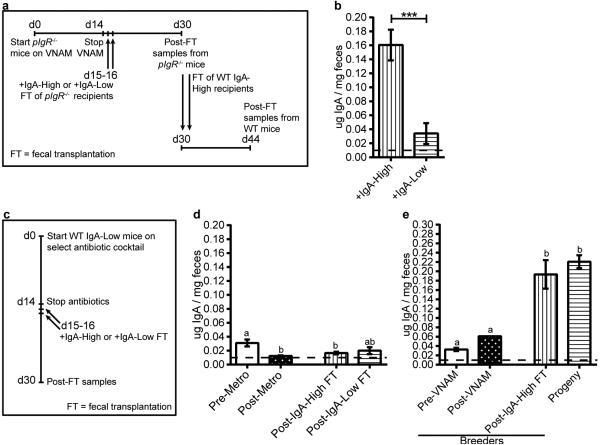
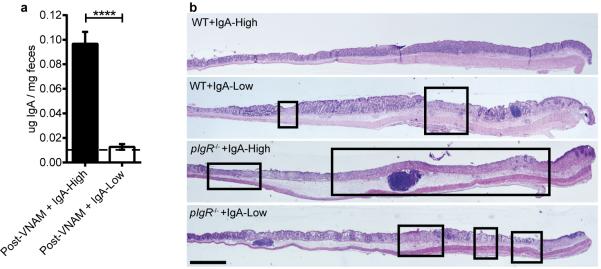
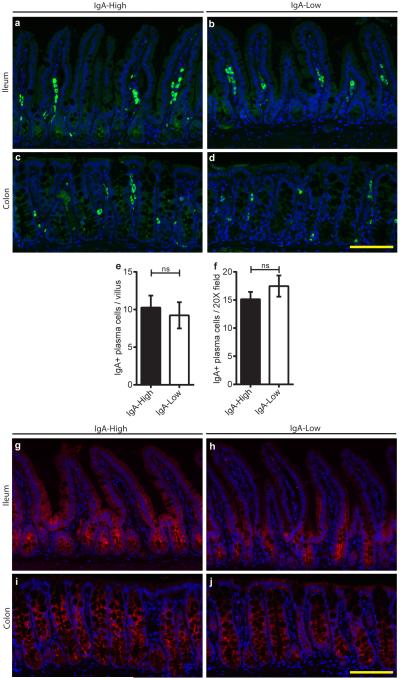
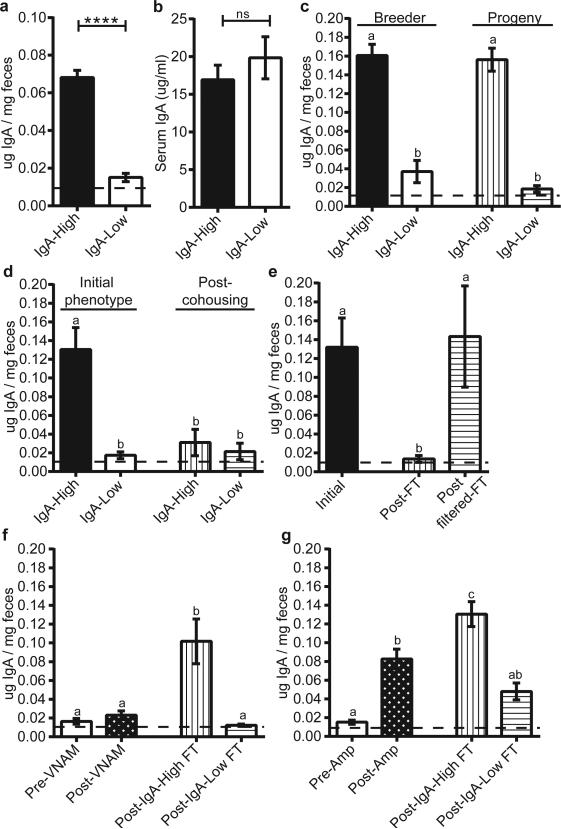
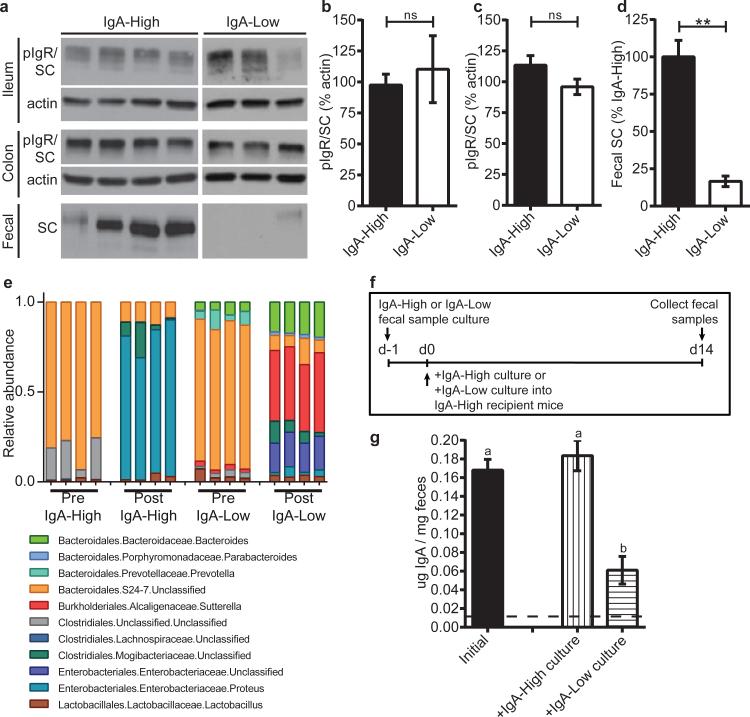
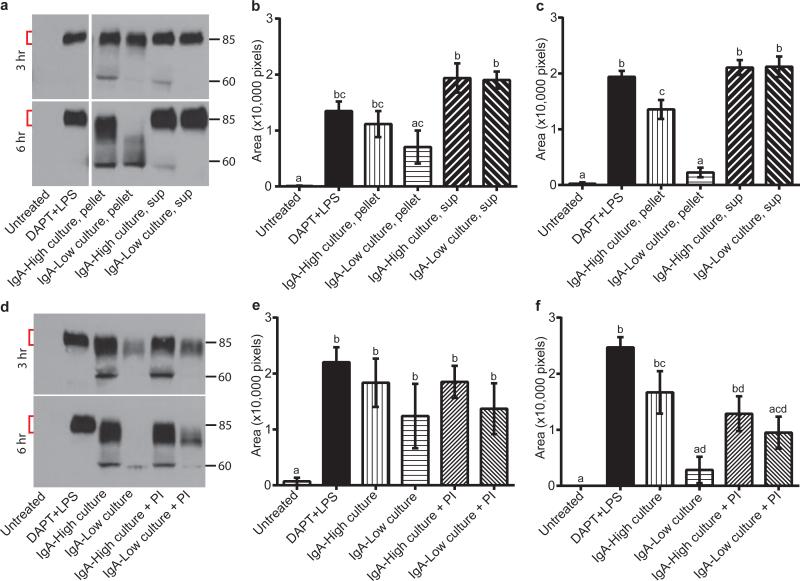
The proliferation of genetically modified mouse models has exposed phenotypic variation between investigators and institutions that has been challenging to control. In many cases, the microbiota is the presumed cause of the variation. Current solutions to account for phenotypic variability include littermate and maternal controls or defined microbial consortia in gnotobiotic mice. In conventionally raised mice, the microbiome is transmitted from the dam. Here we show that microbially driven dichotomous faecal immunoglobulin-A (IgA) levels in wild-type mice within the same facility mimic the effects of chromosomal mutations. We observe in multiple facilities that vertically transmissible bacteria in IgA-low mice dominantly lower faecal IgA levels in IgA-high mice after co-housing or faecal transplantation. In response to injury, IgA-low mice show increased damage that is transferable by faecal transplantation and driven by faecal IgA differences. We find that bacteria from IgA-low mice degrade the secretory component of secretory IgA as well as IgA itself. These data indicate that phenotypic comparisons between mice must take into account the non-chromosomal hereditary variation between different breeders. We propose faecal IgA as one marker of microbial variability and conclude that co-housing and/or faecal transplantation enables analysis of progeny from different dams.


Figures

Extended Data Figure 1
Extended Data Figure 1. WT mice within two independent facilities exhibit binary fecal IgA levels, and the IgA-Low phenotype is transferable between these facilities
a, Fecal IgA (normalized to fecal weight) from mice housed in either Facility 1 (n=28 IgA-High and n=22 IgA-Low mice) or Facility 2 (n=12 mice/group) was detected by anti-mouse IgA ELISA. b-c, WT IgA-High mice from one mouse facility were transplanted with homogenized fecal material from WT IgA-High or IgA-Low mice from the other mouse facility, and fecal IgA was measured 14 days later by anti-mouse IgA ELISA. b, Facility 1 mice pre- (n=18 mice) and post-fecal transplantation with Facility 2 fecal samples (n=8 Post-IgA-High and n=10 Post-IgA-Low mice). c, Facility 2 mice pre- (n=10 mice) and post-fecal transplantation with Facility 1 fecal samples (n=4 Post-IgA-High and n=6 Post-IgA-Low mice). The dotted lines represent the limit of detection by ELISA. All values are indicated as mean±s.e.m. One-way ANOVA: (a) F=44.59, P<0.0001. (b) F=20.93, P<0.0001. (c) F=12.92, P=0.0004. Means with different letters are significantly different by Tukey's multiple comparison test.
Extended Data Figure 2
Extended Data Figure 2. IgA-High and IgA-Low-associated microbes can be stably passaged through pIgR−/− recipients, and are vertically transmissible after recolonization
a, Schematic for repopulation of pIgR−/− microbiota with WT IgA-High/IgA-Low samples, followed by fecal transplantation (FT) of pIgR−/− IgA-High or IgA-Low samples to WT IgA-High mice. b, Fecal IgA on day 44 depicted in (a). Mann-Whitney test: P=0.0006, n=8 mice/group. c, Experimental schematic of antibiotic treatment and transplant protocol for (d) and Figure 1f-g. d, Fecal IgA of post-FT mice on day 30 pre-treated with metronidazole (Metro). One-way ANOVA: F=6.525, P=0.0012, n=13(Pre-Metro), n=15(Post-Metro), n=8(Post-IgA-High FT), and n=5(Post-IgA-Low FT). All values are indicated as mean±s.e.m. e, IgA-Low mice converted to IgA-High from Figure 1f were mated, and fecal IgA of their adult progeny were measured. One-way ANOVA: F=18.29, P=0.0002, n=2 breeders, n=10 progeny from 4 litters. Different letters indicate significant differences by Tukey's multiple comparison test. Dotted lines: limit of detection.
Extended Data Figure 3
Extended Data Figure 3. DSS effects on pIgR−/− mice are dependent on IgA and not microbes
a, Fecal IgA levels were measured in WT mice from Figure 2d-e after vancomycin, neomycin, ampicillin, and metronidazole (VNAM) treatment and IgA-High/IgA-Low fecal transplantation (FT), prior to the start of DSS treatment. Statistical analysis by Mann-Whitney test: P=0.0006, n=7 mice per group. b, Representative H&E-stained histologic sections of WT and pIgR−/− mice from Figure 2d-e after 14 day VNAM treatment +IgA-High/IgA-Low FT. Representative of n=3(WT+IgA-High), n=6(WT+IgA-Low), n=8(pIgR−/−+IgA-High), and n=10(pIgR−/−+IgA-Low) mice. All values indicated as mean±s.e.m. Means with different letters are significantly different by Tukey's multiple comparison test. Dotted lines: limit of detection.
Extended Data Figure 4
Extended Data Figure 4. Plasma cell numbers and pIgR expression are unchanged in the ileum and colon between IgA-High and IgA-Low mice
a-d, Ileal and colonic sections from IgA-High and IgA-Low mice were stained with anti-IgA (green) and bis-benzamide dye (blue); representative 20X images are shown of n=10 (a,b,c) or n=9 mice (d). Bars = 100 μm. e, f, Quantification of ileal plasma cells per villus (e) and colonic plasma cells per 20X field (area = 1.5 × 105 μm2) (f) based on IgA staining. All values are indicated as mean±s.e.m. Statistical analysis by Mann-Whitney test: (e) P=0.5191, n=10 mice per group, and (f) P=0.3117, n=10 IgA-High and n=9 IgA-Low mice. g-j, Ileal and colonic sections from IgA-High and IgA-Low mice were stained with anti-pIgR/SC (red) and bis-benzamide dye (blue); representative images are shown (n=10 mice per group). Bars = 100 μm.
Extended Data Figure 5
Extended Data Figure 5. 16S rDNA sequencing identifies biomarkers for IgA-Low and IgA-High samples
a, b, LEfSe analysis of 16S rDNA sequencing of IgA-Low and IgA-High fecal samples from Facilities 1 and 2 identified statistically significant bacterial taxa biomarkers for (a) IgA-Low and (b) IgA-High samples. Biomarkers for Facility 1 and Biomarkers for Facility 2 alone were identified by comparison of IgA-High and IgA-Low samples within each facility. Biomarkers for Facilities 1&2 were identified by comparison of all IgA-High and IgALow samples from both facilities. No IgA-High biomarkers were identified when comparing all IgA-High and IgA-Low samples from both facilities. Biomarkers for the indicated groups are plotted as taxonomic trees with GraPhlAn (http://huttenhower.sph.harvard.edu/graphlan).n=13(Facility 1 IgA-High), n=14(Facility 1 IgA-Low), n=73(Facility 2 IgA-High), and n=68(Facility 2 IgA-Low) samples. Statistical analysis is shown in Extended Data Table 1.
Extended Data Figure 6
Extended Data Figure 6. Sutterella is more abundant in IgA-Low samples than IgA-High samples in both facilities
a-c, Relative abundance of sequences assigned by QIIME to the bacterial genus Sutterella from 16S rDNA analysis in (a) Facility 1 and (b) Facility 2. These results are summarized in (c). One-way ANOVA: F=12.85, P<0.0001. n=13(Facility 1 IgA- High), n=14(Facility 1 IgA-Low), n=73(Facility 2 IgA-High), and n=68(Facility 2 IgA-Low) samples. Values in (c) are indicated as mean±s.e.m. Means with different letters are significantly different by Tukey's multiple comparison test.
Extended Data Figure 7
Extended Data Figure 7. IgA-Low cultured bacteria can degrade free SC in the absence of IgA, and SC-degrading properties of these bacteria are active after freeze/thaw
Primary intestinal epithelial Transwell monolayers were pre-treated with 10 μM DAPT + 1μg ml−1 LPS on days 1 and 2 post-seeding to induce differentiation and pIgR expression. Some wells were left untreated as negative controls. On day 3 post-seeding, either 3 μg of normal mouse dimeric IgA or media alone was added to the lower compartment of the Transwells. Different subsets of the DAPT+LPS-treated Transwells were also treated with one of the following conditions in the apical compartment: IgA-High/IgA-Low bacterial cultures (pelleted bacterial or supernatant fraction), live or freeze/thawed (F/T) IgA-High/IgA-Low bacterial cultures (pelleted bacterial fraction). Apical Transwell supernatants were collected at 3h and 6h, and the amount of SC was measured by anti-SC immunoblot. a, Representative anti-pIgR/SC and anti-actin immunoblots of intestinal epithelial monolayers at 6h (one of three experiments). b-d, SC degradation in the absence of IgA. (b) Representative anti-SC immunoblot and quantification of undegraded SC (denoted by the red brackets) at 3 hours (c) and 6 hours (d) over 4 independent experiments by ImageJ. e-g, SC degradation by F/T bacterial cultures. (e) Representative anti-SC immunoblot and quantification of undegraded SC at 3 hours (f) and 6 hours (g) over 5 independent experiments by ImageJ. All values are indicated as mean±s.e.m. One-way ANOVA: (c) F=1.834, P=0.1831, n=4 independent experiments with DAPT+LPS, no IgA repeated 2 times; (d) F=23.96, P=0.0002, n=4 independent experiments with DAPT+LPS, no IgA repeated 2 times; (f) F=7.444, P=0.0045, n=5 independent experiments with Untreated and DAPT+LPS repeated 3 times; (g) F=31.53, P<0.0001, n=5 independent experiments with Untreated and DAPT+LPS repeated 3 times. Means with different letters are significantly different by Tukey's multiple comparison test.
Extended Data Figure 8
Extended Data Figure 8. IgA-Low cultured bacteria can degrade IgA
Primary intestinal epithelial cell monolayers were pre-treated with 10 μM DAPT + 1μg ml−1 LPS on days 1 and 2 post-seeding to induce differentiation and pIgR expression. Some wells were left untreated as negative controls. On day 3 post-seeding, 3 μg of normal mouse IgA was added to the lower compartment of the Transwells. Different subsets of the DAPT+LPS-treated Transwells were also treated with combinations of the following in the apical compartment: live IgA-Low bacterial cultures (either the pelleted bacterial or supernatant fraction), freeze/thawed (F/T) IgALow bacterial cultures, and a 1X protease inhibitor (PI) cocktail. Apical Transwell supernatants were collected at 3 hours (a) and 6 hours (b), and the amount of IgA was measured by anti-mouse IgA ELISA. The dotted lines represent the limit of detection by ELISA. All values are indicated as mean±s.e.m. One-way ANOVA: (a) F=26.32, P<0.0001, n=8(Untreated), n=8(DAPT+LPS), n=6(IgA-Low culture, pellet), n=3(IgA-Low culture, sup), n=4(IgA-Low culture, F/T), and n=4(IgA-Low culture, +PI); (b) F=35.57, P<0.0001, n=8(Untreated), n=8(DAPT+LPS), n=6(IgA-Low culture, pellet), n=3(IgA-Low culture, sup), n=3(IgA-Low culture, F/T), and n=4(IgA-Low culture, +PI). Means with different letters are significantly different by Tukey's multiple comparison test; ND, not detected.
Figure 1
Figure 1. Low fecal IgA in WT mice is a vertically and horizontally transferable, dominant phenotype driven by ampicillin-sensitive bacteria
a, b, Fecal (a) and serum IgA (b) by ELISA. Mann-Whitney test: (a) P<0.0001, n=40(IgA-High), n=34(IgA-Low) mice; (b) P=0.4704, n=12/group. c, Fecal IgA from IgA-High(n=10) and IgA-Low(n=11) breeders and their adult progeny [IgA-High(n=12), IgA-Low(n=9)]. d, Fecal IgA pre-[(IgA-High(n=9), IgA Low(n=11)] and post-cohousing [IgA-High(n=8), IgA-Low(n=10)]. One-way ANOVA: (c) F=45.95, P<0.0001; (d) F=15.56, P<0.0001. e, Fecal IgA from IgA-High mice pre-(n=18) and post-fecal transplant (FT) with unfiltered (Post-FT, n=13) or 0.45μm-filtered fecal material (Post-filter FT, n=5) from IgA-Low mice. f, g, Fecal IgA of post-FT mice pre-treated with (f) VNAM or (g) ampicillin (Amp). One-way ANOVA: (e) F=5.685, P=0.0076; (f) F=16.15, P<0.0001, n=16(Pre-VNAM), n=18(Post-VNAM), n=9(Post-IgA-High FT), n=8(Post-IgA-Low FT); (g) F=22.96, P<0.0001, n=22(Pre-Amp), n=28(Post-Amp), n=12(Post-IgA-High FT), n=12(Post-IgA-Low FT). All values=mean±s.e.m. Different letters indicate significant differences, Tukey's multiple comparison test. Dotted lines=limit of detection.
Figure 2
Figure 2. The IgA-Low phenotype alters susceptibility to DSS in an IgA-dependent manner
a-c, DSS treatment of IgA-High/IgA-Low mice; (a) percent initial weight, (b) percentage of ulcerated distal colon, (c) representative H&E-stained histologic sections of IgA-High(n=10) and IgA-Low(n=11) mice. d, e, DSS treatment of WT and pIgR−/− mice after VNAM treatment +IgA-High/IgA-Low fecal transplant; (d) percent initial weight, (e) percentage of ulcerated distal colon. Two-way repeated measures ANOVA: (a) column factor P=0.0285; P<0.001, Sidak's multiple comparisons test, final timepoint, IgA-High(n=10) and IgALow(n=11) mice; (d) column factor P<0.0001, n=15(WT+IgA-High), n=18(WT+IgA-Low), n=20(pIgR−/−+IgA-High), n=21(pIgR−/−+IgA-Low); Tukey's multiple comparison test, final timepoint. Unpaired t-test: (b) P=0.0385, IgA-High(n=10), IgA-Low(n=11) mice. One-way ANOVA: (e) F=8.272, P=0.0007, n=3(WT+IgA-High), n=6(WT+IgA-Low), n=8(pIgR−/−+IgA- High), n=10(pIgR−/−+IgA-Low). All values=mean±s.e.m. Different letters indicate significant differences, Tukey's multiple comparison test. Bars=1 mm; boxeg=mlcerated areas.
Figure 3
Figure 3. The IgA-Low phenotype correlates with an absence of fecal SC and the presence of specific microbial taxa in vivo, which can be anaerobically cultured in vitro
a, Representative anti-pIgR/SC immunoblots (of n=3 replicates) of intestinal tissue/fecal samples from IgA-High/IgA-Low mice. b-d, Quantification of immunoblots for (b) ileal, (c) colonic, and (d) fecal pIgR/SC. Mann-Whitney test: (b) P=0.7424, n=7(IgA-High), n=5(IgA-Low) mice; (c) P=0.1285, n=10(IgA-High), n=15(IgA-Low) mice; (d) P=0.0025, n=7(IgA-High), n=5(IgALow) mice. e, Relative abundance of Order/Family/Genus 16S rDNA sequence assignments of culture inoculate from IgA-High/IgA-Low samples (Pre) or overnight cultures of these inoculates (Post); n=4 samples/group. Statistical analysis: Extended Data Table 2. f, Schematic of culturing/administration experiments. g, Fecal IgA measured in IgA-High mice pre-(n=18) and post-cultured microbe administration [+IgA-High culture(n=10), +IgA-Low culture(n=9)] depicted in (f). One-way ANOVA: F=18.60, P<0.0001. All values=mean±s.e.m. Different letters indicate significant differences, Tukey's multiple comparison test. Dotted lines=limit of detection.
Figure 4
Figure 4. Culturable anaerobic bacteria present in IgA-Low samples degrade SC
a-c, IgA transcytosis assay with primary intestinal epithelial Transwell monolayers apically treated with pelleted/supernatant fraction of IgA-High/IgA-Low cultures. SC in apical supernatants was measured by anti-SC immunoblots. Representative anti-SC immunoblot (a) and quantification of undegraded SC (red brackets) at 3h (b) and 6h (c). d-f, Transwell monolayers treated as in (a-c), with protease inhibitor (PI) cocktail added to IgA-High/IgA-Low cultures (pelleted bacterial fraction). Representative anti-SC immunoblot (d) and quantification of undegraded SC at 3h (e) and 6h (f). One-way ANOVA: (b) F=11.11, P<0.0001, n=5 experiments, 3 containing “sup” samples; (c) F=54.83, P<0.0001, n=5; (e) F=3.830, P=0.0263, n=3; (f) F=12.07, P=0.0002, n=3. All values=mean±s.e.m. Different letters indicate significant differences, Tukey's multiple comparison test.

References

    1. Hao LY, Liu X, Franchi L. Inflammasomes in inflammatory bowel disease pathogenesis. Current opinion in gastroenterology. 2013;29:363–369. doi:10.1097/MOG.0b013e32836157a4. - PubMed
    1. Ubeda C, et al. Familial transmission rather than defective innate immunity shapes the distinct intestinal microbiota of TLR-deficient mice. J Exp Med. 2012;209:1445–1456. doi:10.1084/jem.20120504. - PMC - PubMed
    1. Letran SE, et al. TLR5-deficient mice lack basal inflammatory and metabolic defects but exhibit impaired CD4 T cell responses to a flagellated pathogen. Journal of immunology. 2011;186:5406–5412. doi:10.4049/jimmunol.1003576. - PMC - PubMed
    1. Ivanov, et al. Induction of intestinal Th17 cells by segmented filamentous bacteria. Cell. 2009;139:485–498. doi:10.1016/j.cell.2009.09.033. - PMC - PubMed
    1. Cadwell K, et al. Virus-plus-susceptibility gene interaction determines Crohn's disease gene Atg16L1 phenotypes in intestine. Cell. 2010;141:1135–1145. doi:10.1016/j.cell.2010.05.009. - PMC - PubMed

Publication types

MeSH terms