. 2014 Dec 5:5:5648.
doi: 10.1038/ncomms6648.

Intestinal epithelial MyD88 is a sensor switching host metabolism towards obesity according to nutritional status

Affiliations

Intestinal epithelial MyD88 is a sensor switching host metabolism towards obesity according to nutritional status

Amandine Everard et al. Nat Commun. .

Abstract

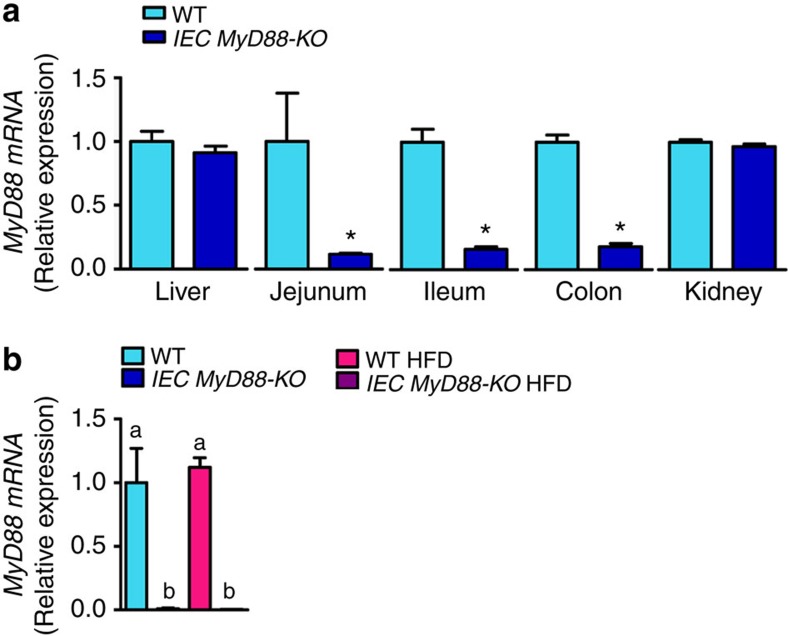
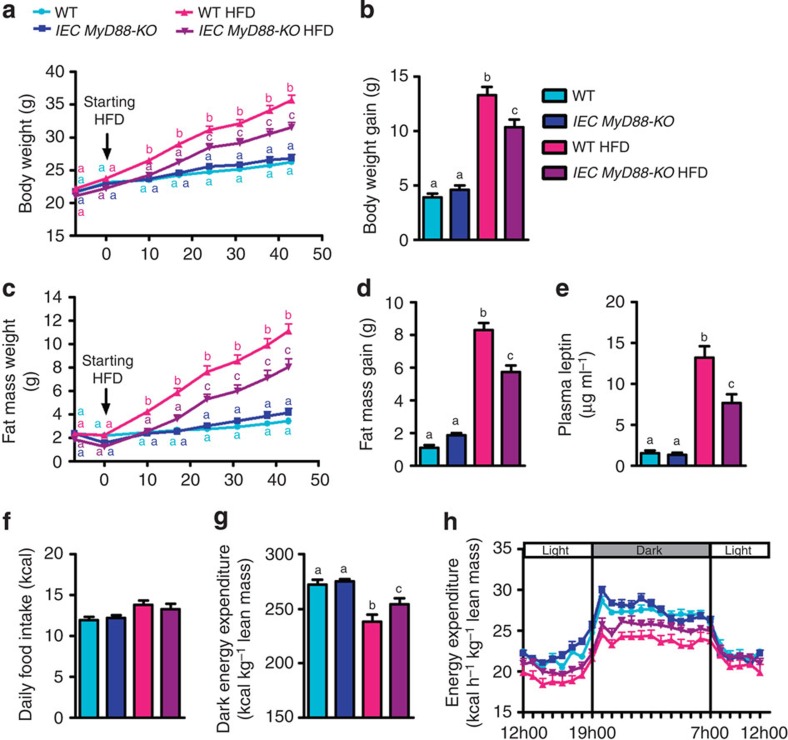
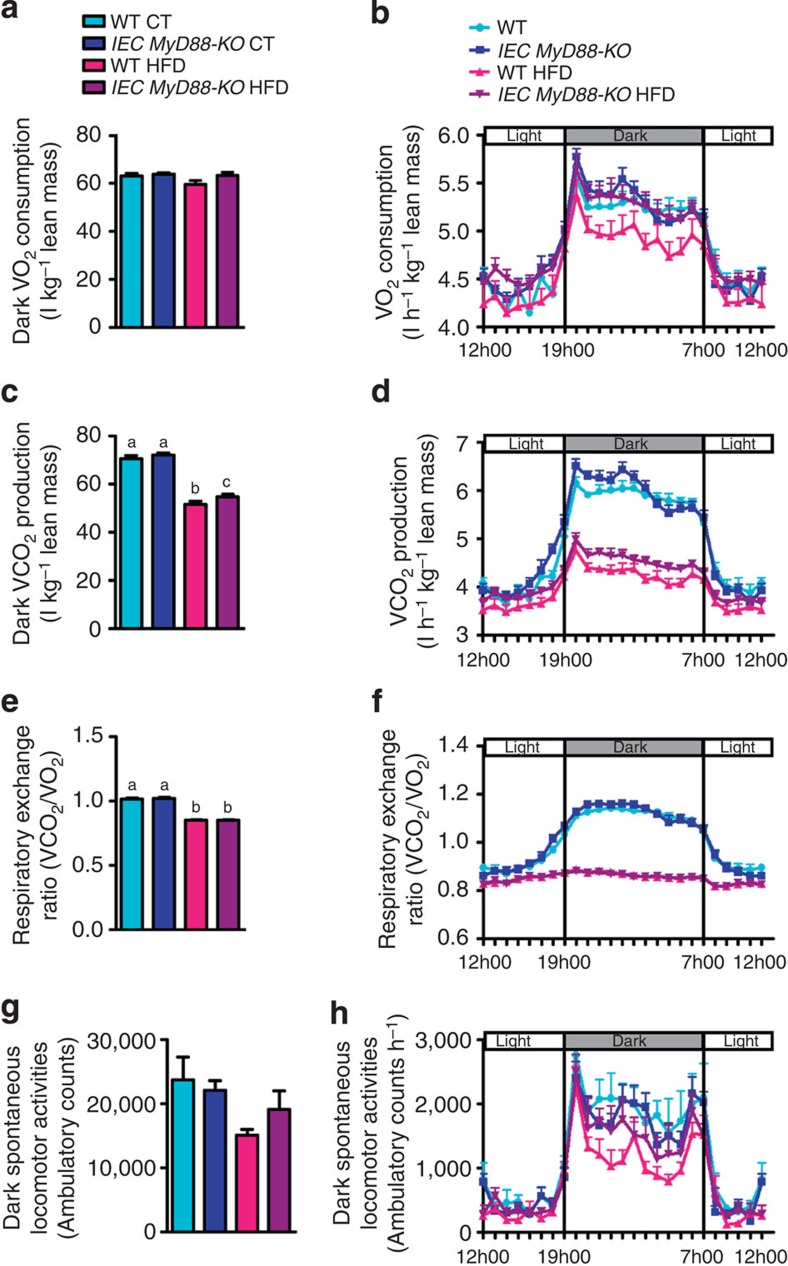
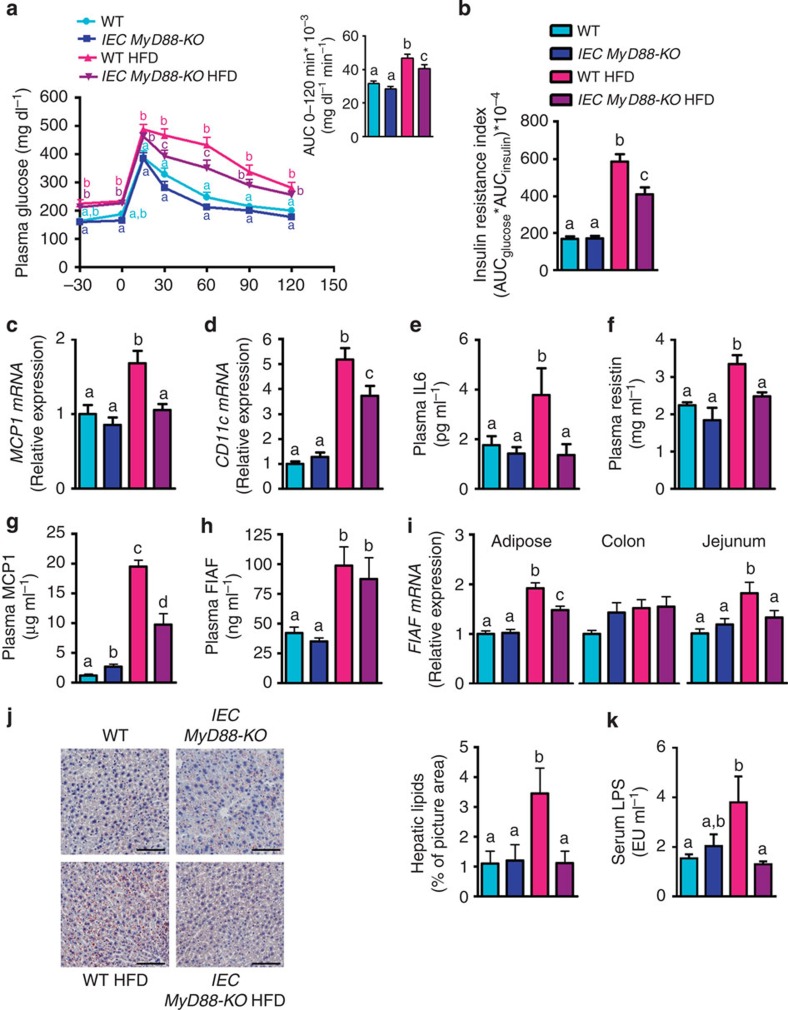
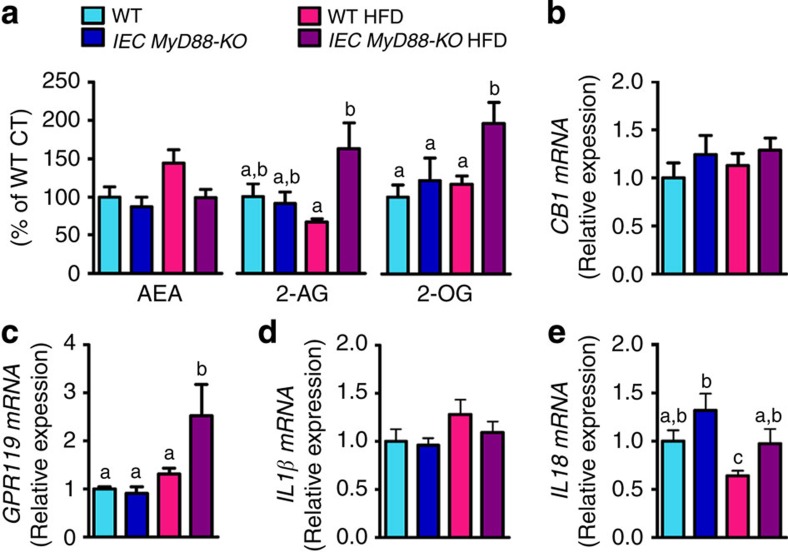
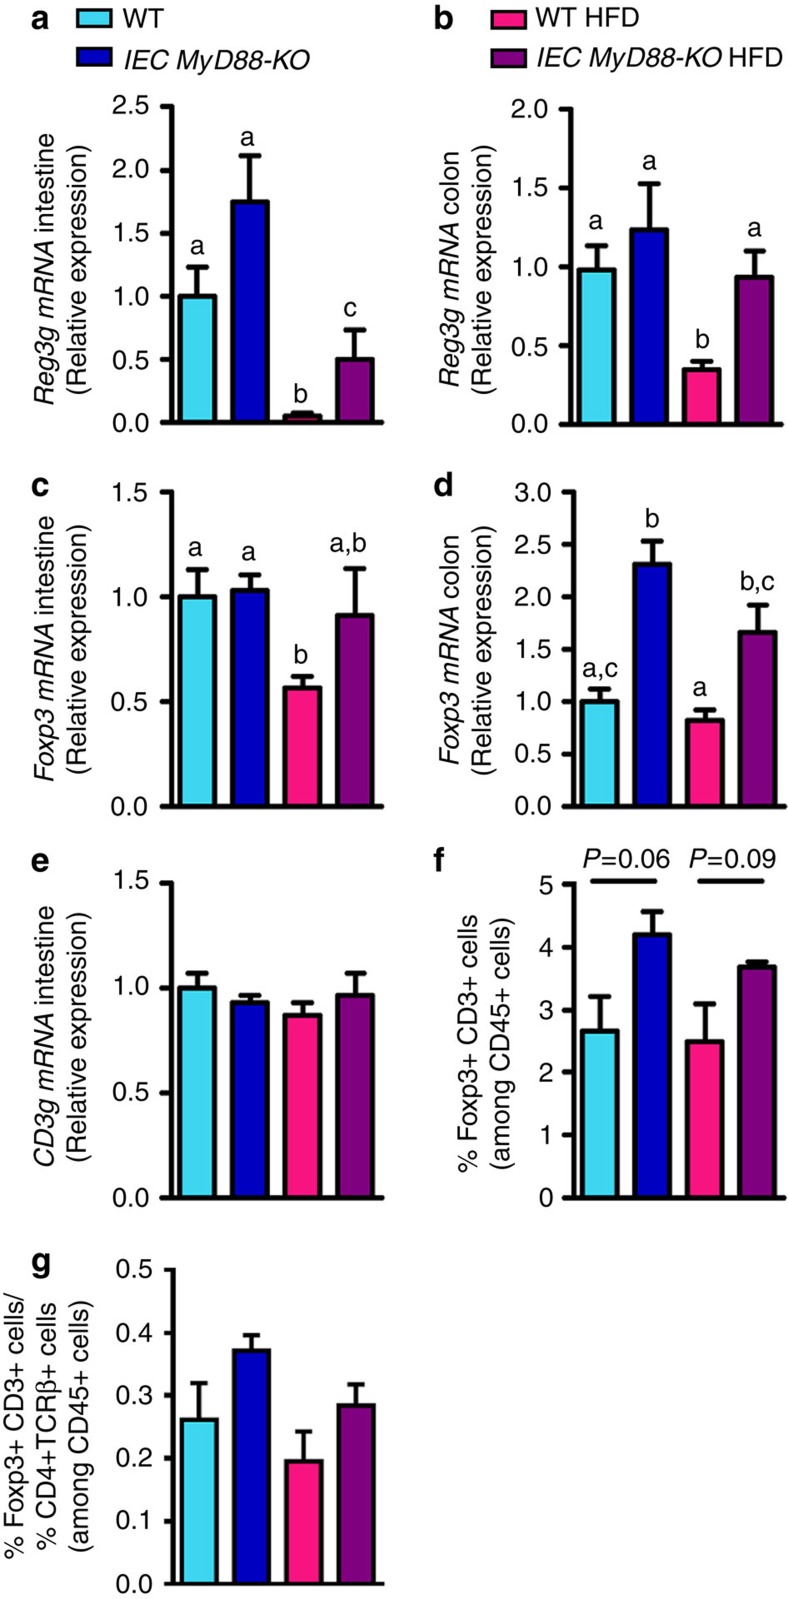
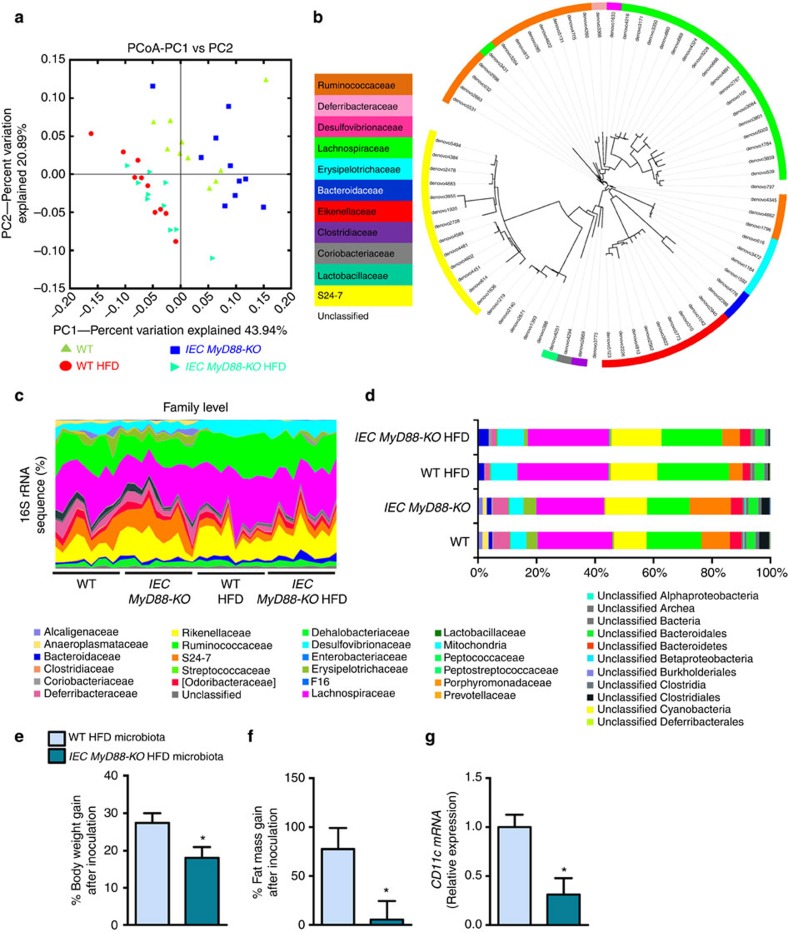
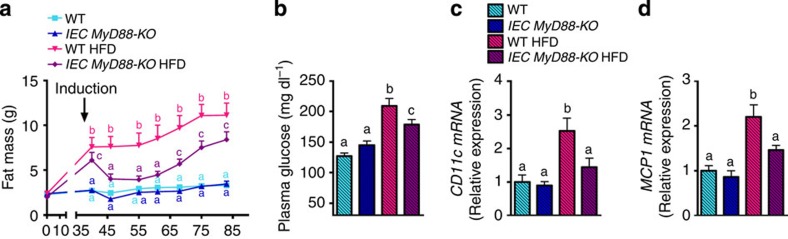
Obesity is associated with a cluster of metabolic disorders, low-grade inflammation and altered gut microbiota. Whether host metabolism is controlled by intestinal innate immune system and the gut microbiota is unknown. Here we report that inducible intestinal epithelial cell-specific deletion of MyD88 partially protects against diet-induced obesity, diabetes and inflammation. This is associated with increased energy expenditure, an improved glucose homeostasis, reduced hepatic steatosis, fat mass and inflammation. Protection is transferred following gut microbiota transplantation to germ-free recipients. We also demonstrate that intestinal epithelial MyD88 deletion increases anti-inflammatory endocannabinoids, restores antimicrobial peptides production and increases intestinal regulatory T cells during diet-induced obesity. Targeting MyD88 after the onset of obesity reduces fat mass and inflammation. Our work thus identifies intestinal epithelial MyD88 as a sensor changing host metabolism according to the nutritional status and we show that targeting intestinal epithelial MyD88 constitutes a putative therapeutic target for obesity and related disorders.


Figures

Figure 1
Figure 1. Validation of intestinal specific deletion of MyD88.
(a) The tamoxifen induction of the intestinal epithelial MyD88 deletion in adult mice (8-week-old mice) is associated with a drastic decrease in MyD88 mRNA expression, specifically in the intestine. mRNA expression of MyD88 in the liver, jejunum, ileum, colon and kidney (n=7). (b) The residual expression of MyD88 corresponds to the other cell types than intestinal epithelial cells since the expression of MyD88 was reduced to almost undetectable values in isolated epithelial cells from IEC MyD88 KO mice (n=4). These data correspond to the results of one experiment. All the replicates represent biological replicates. Data are shown as the means±s.e.m. Data with * are significantly different (P<0.05) according to the unpaired two-tailed Student’s t-test. Data with different superscript letters are significantly different (P<0.05) according to the one-way analysis of variance statistical analysis followed by Newman–Keuls post hoc tests after normalization by log transformation.
Figure 2
Figure 2. IEC MyD88-KO mice are partially protected against HFD-induced obesity.
Mice were monitored during 8 weeks of a HFD or a control diet. (a) Body weight evolution over 6 weeks of treatment (g; n=25). (b) Total body weight gain (g; n=25). (c) Fat mass weight evolution over 6 weeks of treatment (g; n=25). (d) Total fat mass gain (g; n=25). These data (ad) correspond to the results of three independent experiments. (e) Leptin plasma levels (n=10). (f) Daily (24 h) food intake precisely measured in metabolic chambers (kcal; n=6). (g) Dark (night) energy expenditure (kcal) normalized to total lean mass (kg; n=6). (h) Light and dark cycle energy expenditure (kcal) normalized to total lean mass (kg) measured in metabolic chambers during indirect calorimetry studies (n=6). These data (eh) correspond to the results of one experiment. All the replicates represent biological replicates. Data are shown as the means±s.e.m. Data with different superscript letters are significantly different (P<0.05) according to the one-way analysis of variance statistical analysis followed by Newman–Keuls post hoc tests after normalization by log transformation (b,dg) or two-way statistical analysis followed by Bonferroni post hoc test (a and c).
Figure 3
Figure 3. IEC MyD88 deletion increases CO2 production and O2 consumption under HFD.
(a) Dark (night) O2 consumption (ml) normalized to total lean mass (kg; n=6). (b) Light and dark cycle of O2 consumption (ml) normalized to total lean mass (kg; n=6). (c) Dark (night) CO2 production (ml) normalized to total lean mass (kg; n=6). (d) Light and dark cycle of CO2 production (ml) normalized to total lean mass (kg; n=6). (e) Respiratory exchange ratio (n=6). (f) Light and dark cycle of respiratory exchange ratio (n=6). (g) Dark ambulatory activities (counts; n=6). (h) Light and dark cycle of ambulatory activities (counts; n=6). These data correspond to the results of one experiment. All the replicates represent biological replicates. Data are shown as the means±s.e.m. (a,c,e,g) Data with different superscript letters are significantly different (P<0.05) according to the one-way analysis of variance statistical analysis followed by Newman–Keuls post hoc tests after normalization by log transformation (a,c,e and g).
Figure 4
Figure 4. IEC MyD88 deletion improves metabolic disorders associated with obesity.
(a) Oral glucose tolerance test. Inset: area under the curve (AUC) during oral glucose tolerance test (n=10). (b) Insulin resistance index (AUC blood glucose × AUC insulin) (n=10). (c,d) MCP1 mRNA and CD11c mRNA in the adipose tissue (n=25). (e) Circulating IL6 and (f) Resistin, (g) MCP1 and (h) FIAF plasma levels (n=10). (i) FIAF mRNA in the adipose tissue, the colon and the jejunum (n=25). (j) Liver oil red O staining, scale bar, 100 μm. (k) Serum LPS levels measured in the portal vein (EU ml−1) (n=6). Data from c to d correspond to the results of three independent experiments. The data (a,b and ek) correspond to the results of one experiment. All the replicates represent biological replicates. Data are shown as the means±s.e.m. Data with different superscript letters are significantly different (P<0.05) according to the one-way analysis of variance statistical analysis followed by Newman–Keuls post hoc tests after normalization by log transformation (ak) or two-way statistical analysis followed by Bonferroni post hoc tests (a).
Figure 5
Figure 5. IEC MyD88 deletion modulates intestinal endocannabinoid system in HFD-fed mice.
(a) Ileum AEA levels (n=10), 2-AG levels (n=10) and 2-OG levels (n=10). (b) CB1 mRNA in the ileum (n=10). (c) GPR119 mRNA in the ileum (n=10). (d) IL1β mRNA in the colon (n=10). (e) IL18 mRNA in the jejunum (n=15). These data correspond to the results of one experiment. All the replicates represent biological replicates. Data are shown as the means±s.e.m. Data with different superscript letters are significantly different (P<0.05) according to the one-way analysis of variance statistical analysis followed by Newman–Keuls post hoc tests after normalization by log transformation (data ae).
Figure 6
Figure 6. IEC MyD88 deletion regulates markers of intestinal immune system.
(a) Reg3g mRNA in the small intestine (n=10). (b) Reg3g mRNA in the colon (n=25). (c,d) Foxp3 mRNA in the small intestine and in the colon, respectively (n=10). (e) CD3g mRNA in the small intestine (n=10). (f) Foxp3+ and CD3+ cells in the small intestine expressed as a percentage of CD45+ cells and measured by flow cytometry (n=4). (g) Ratio of Foxp3+ CD3+ cells and TCRβ+ cells in the small intestine (n=4). Data from b correspond to the results of three independent experiments. Data from a and cg correspond to the results of one experiment. All the replicates represent biological replicates. Data are shown as the means±s.e.m. Data with different superscript letters are significantly different (P<0.05) according to the one-way analysis of variance statistical analysis followed by Newman–Keuls post hoc tests after normalization by log transformation (data ae and g). Differences between two groups were assessed using the unpaired two-tailed Student’s t-test (data f), P-value is indicated for each comparison.
Figure 7
Figure 7. MyD88 deletion in immune cells does not protect against HFD-induced obesity.
(a) Body weight (g; n=4). (b) Epididymal fat depot weight (g; n=4). (c) Representative histology of adipocyte cell size, scale bar, 100 μm (n=4). (d) Representative histology of crown-like structure (CLS) and quantification of the number of crown-like structures per mm2, scale bar, 100 μm (n=4). (e) Fasted plasma glucose levels (mg dl−1; n=4). (f) Plasma glucose (mg dl−1) profile after 1 g per kg intraperitoneal glucose challenge in freely moving mice (n=4). These data correspond to the results of one experiment. All the replicates represent biological replicates. Data are shown as the means±s.e.m.
Figure 8
Figure 8. Intestinal MyD88 deletion affects gut bacterial community.
Gut bacterial community is analysed by 16S rRNA gene high-throughput sequencing. IEC MyD88-KO HFD gut microbiota transfers the partial protection against the obesity phenotype to germ-free mice. (a) Principal coordinate analysis based on the weighted UniFrac analysis on operational taxonomic units (OTUs; n=10). Each symbol representing a single sample is coloured according to the group. (b) OTUs significantly affected by intestinal epithelial MyD88 deletion under HFD. A representative 16S rRNA gene from each of the 72 differentially expressed OTUs in WT HFD versus IEC MyD88-KO HFD mice was aligned and used to infer the phylogenetic tree shown in this figure (n=10). The colour in front of the OTU indicates the family of the OTU. (c) Relative abundances (percentage of 16S rRNA gene sequences) of the different bacterial families in each sample among the WT, IEC MyD88-KO, WT HFD and IEC MyD88-KO HFD mice (n=10). (d) Percentage of each indicated family (n=10). The different families are represented by different colour codes. eg are the results of gut microbiota transfer from WT HFD or IEC MyD88-KO HFD mice to WT germ-free mice fed a HFD. (e) Percentage of body weight gain after gut microbiota transfer to germ-free mice (%; n=5 CT and 4 HFD). (f) Percentage of fat mass gain after gut microbiota transfer to germ-free mice (%; n=5 CT and 4 HFD). (g) CD11c mRNA in the adipose tissue (n=5 CT and 4 HFD). These data correspond to the results of one experiment. All the replicates represent biological replicates. Data are shown as the means±s.e.m. Data with * are significantly different (P<0.05) according to the unpaired two-tailed Student’s t-test.
Figure 9
Figure 9. Therapeutic effect of IECMyD88 deletion observed in obese and type 2 diabetic mice.
(a) Fat mass weight evolution (g) after 6 weeks of dietary treatment and following 7 weeks after intestinal MyD88 deletion (n=10). Arrow with the word ‘induction’ indicates tamoxifen injection and thereby intestinal MyD88 deletion. (b) Fasted plasma glucose at the end of the experiment (n=10). (c,d) CD11c mRNA and MCP1 mRNA, respectively (n=10 per group). These data correspond to the results of one experiment. All the replicates represent biological replicates. Data are shown as the means±s.e.m. Data with different superscript letters are significantly different (P<0.05) according to the one-way analysis of variance statistical analysis followed by Newman–Keuls post hoc tests after normalization by log transformation (bd) or two-way statistical analysis followed by Bonferroni post hoc tests (a).

References

    1. Larsen N. et al. Gut microbiota in human adults with type 2 diabetes differs from non-diabetic adults. PLoS ONE 5, e9085 (2010). - PMC - PubMed
    1. Wu X. et al. Molecular characterisation of the faecal microbiota in patients with type II diabetes. Curr. Microbiol. 61, 69–78 (2010). - PubMed
    1. Qin J. et al. A metagenome-wide association study of gut microbiota in type 2 diabetes. Nature 490, 55–60 (2012). - PubMed
    1. Karlsson F. H. et al. Gut metagenome in European women with normal, impaired and diabetic glucose control. Nature 498, 99–103 (2013). - PubMed
    1. Turnbaugh P. J. et al. An obesity-associated gut microbiome with increased capacity for energy harvest. Nature 444, 1027–1031 (2006). - PubMed

Publication types