. 2014 Dec 1:204:99-111.
doi: 10.1016/j.resp.2014.09.013. Epub 2014 Sep 28.

Increased cardio-respiratory coupling evoked by slow deep breathing can persist in normal humans

Affiliations

Increased cardio-respiratory coupling evoked by slow deep breathing can persist in normal humans

Thomas E Dick et al. Respir Physiol Neurobiol. .

Abstract

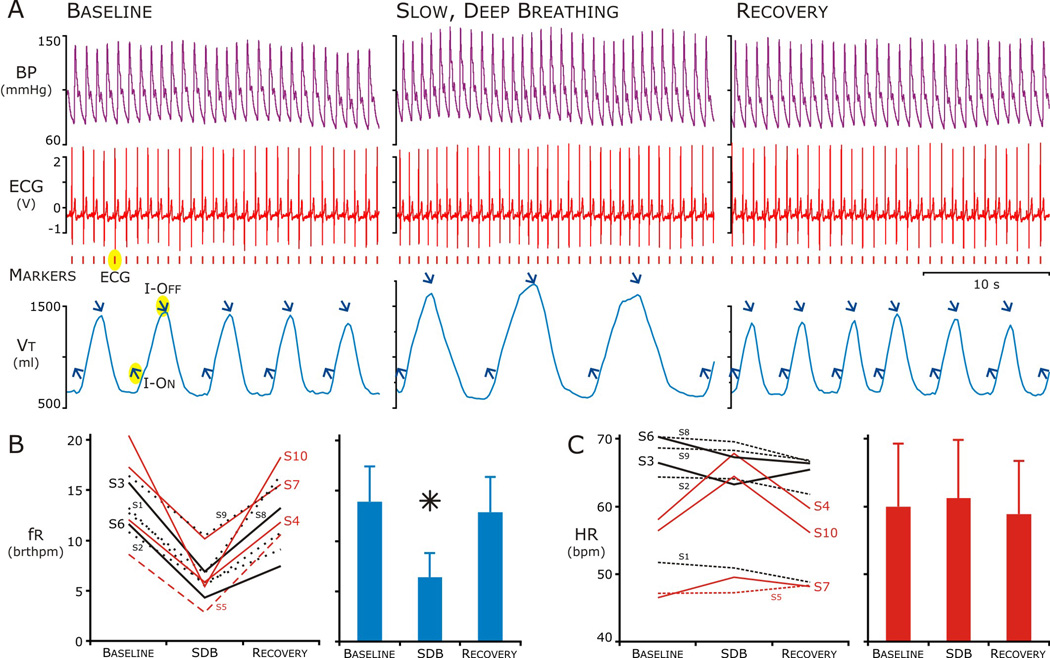
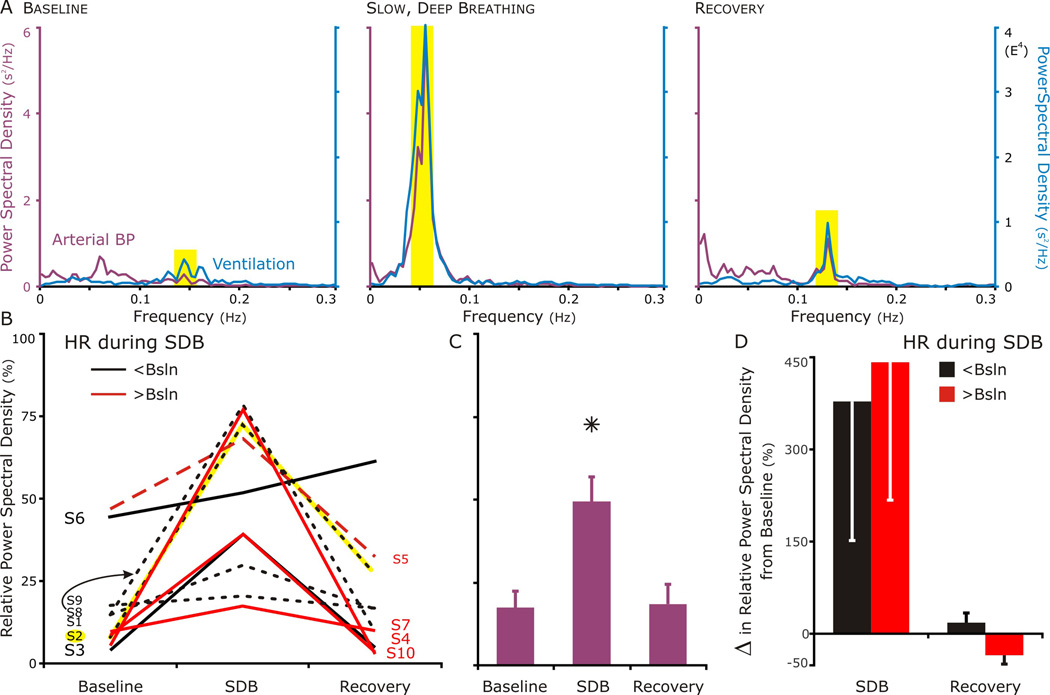
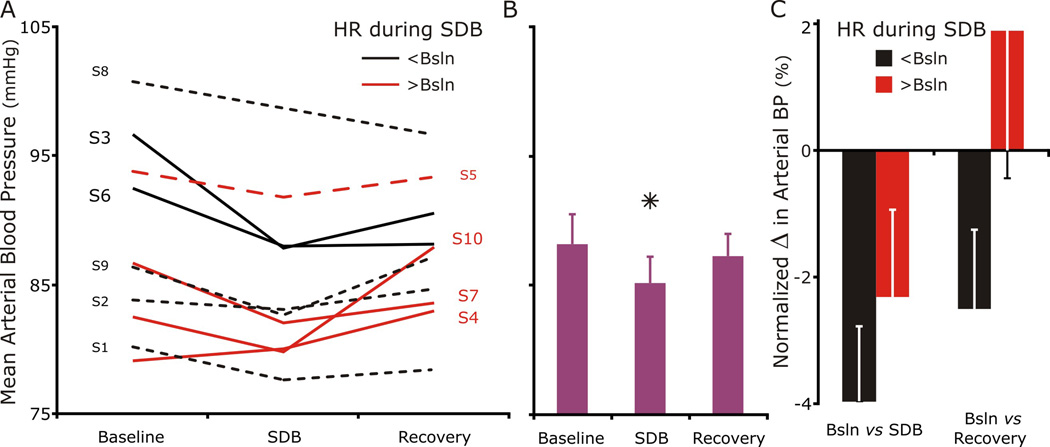
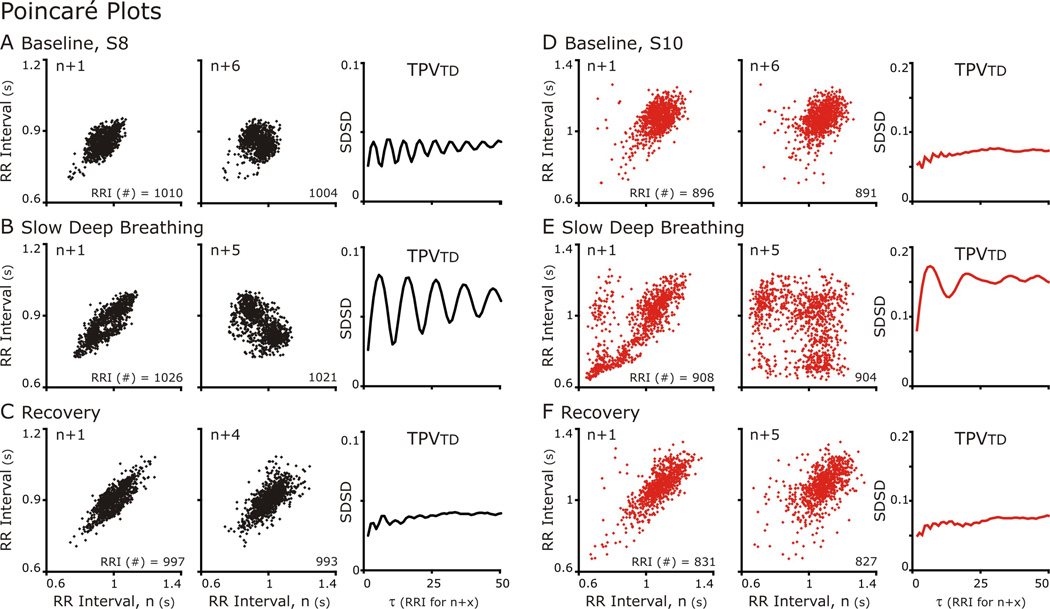
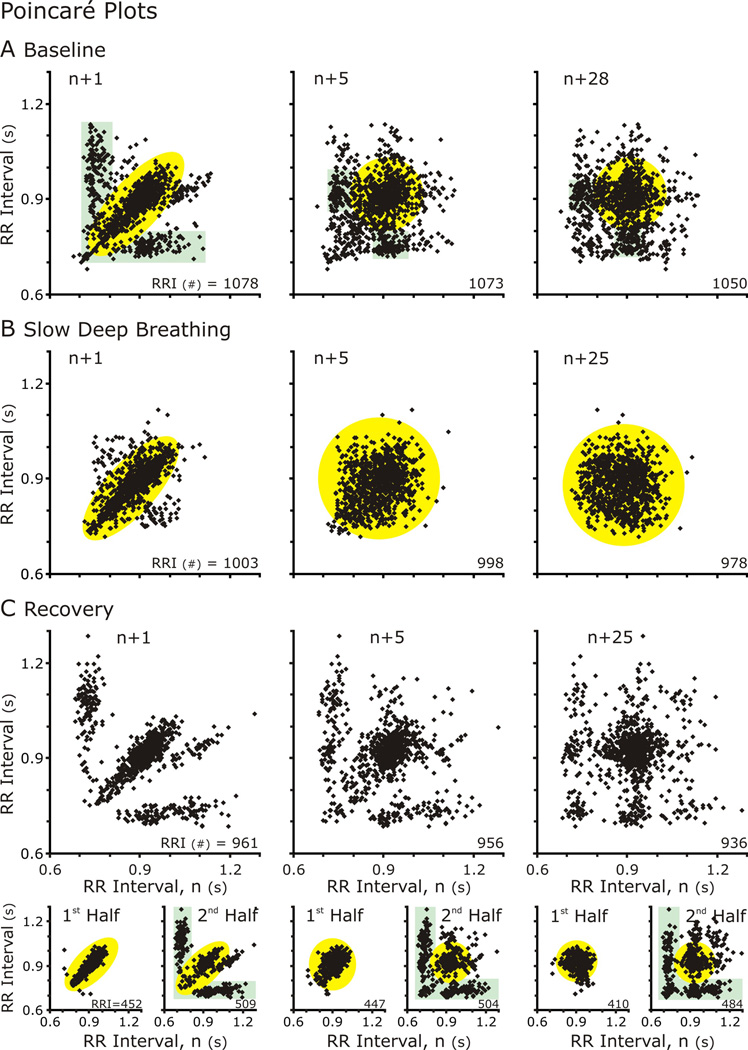
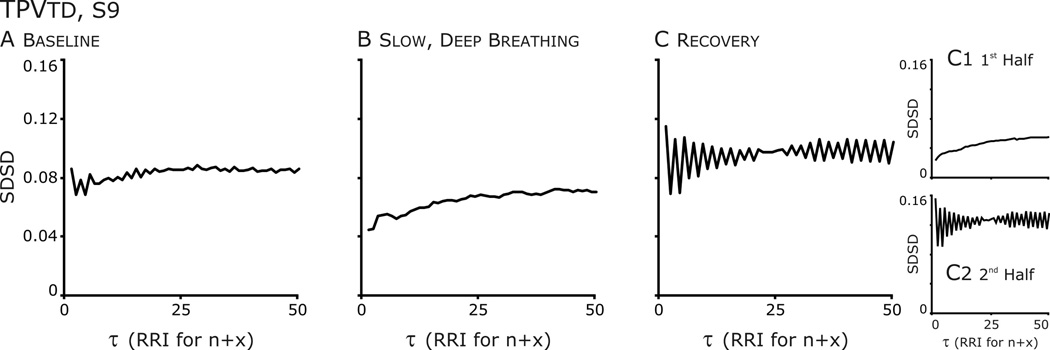
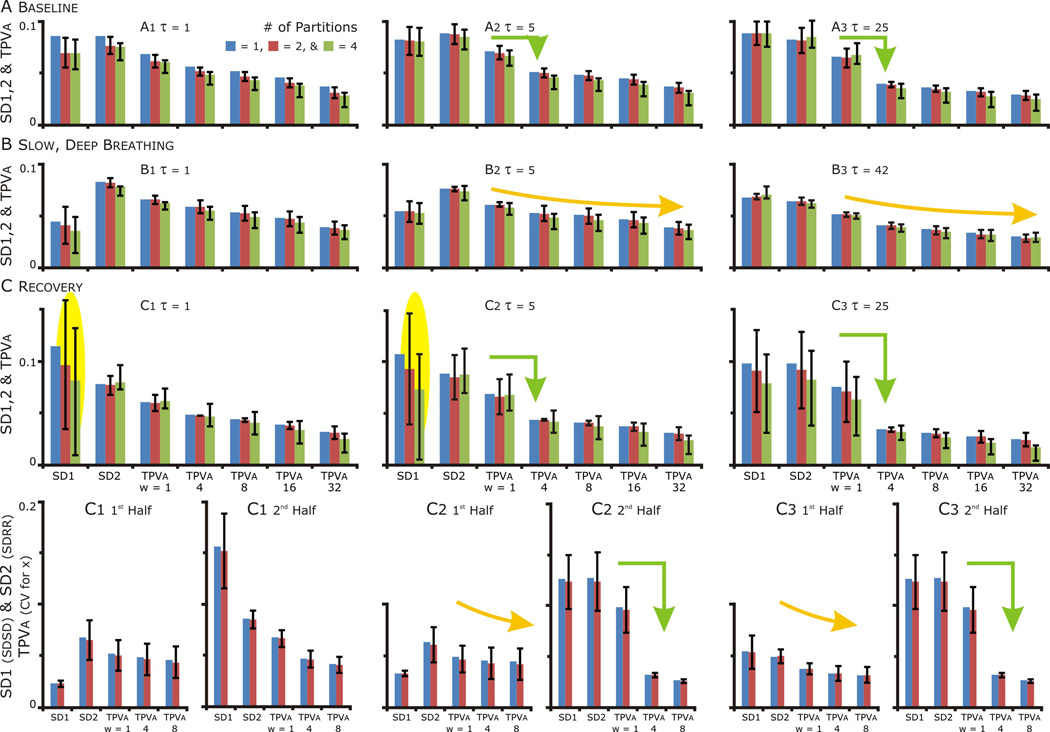
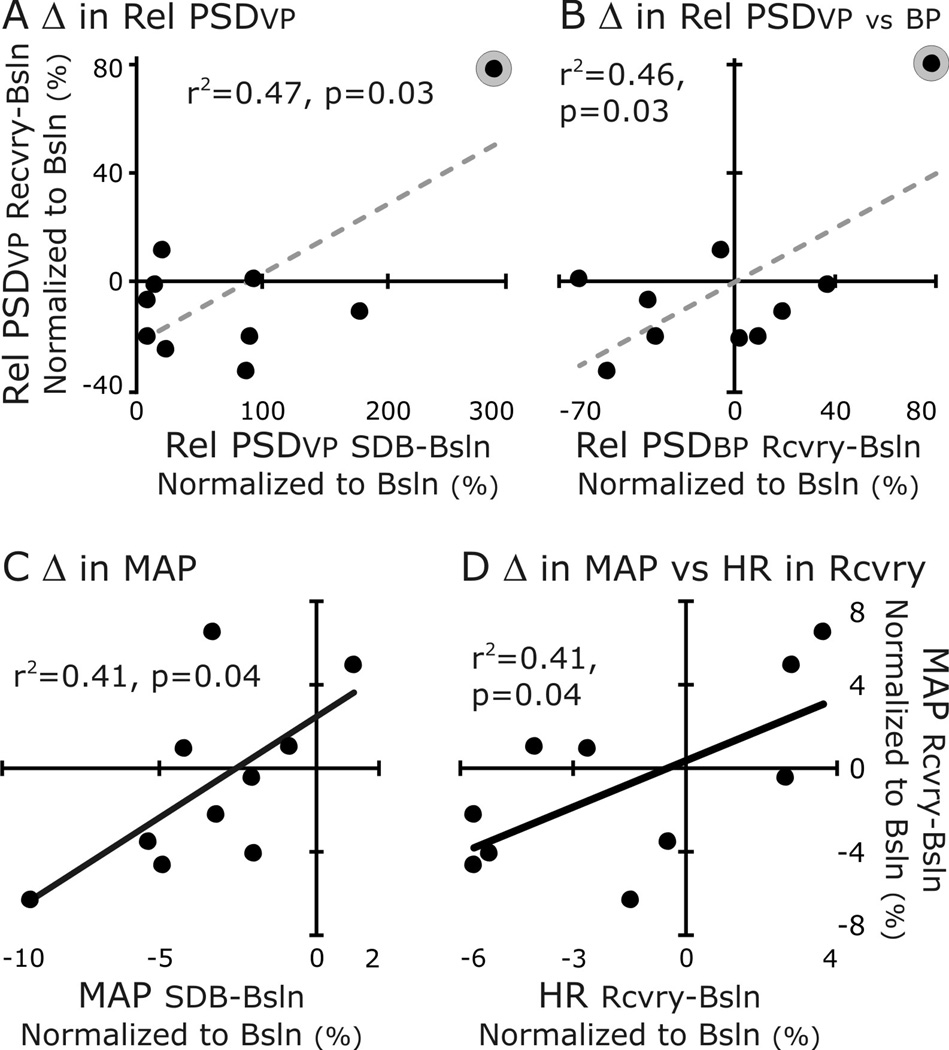
Slow deep breathing (SDB) has a therapeutic effect on autonomic tone. Our previous studies suggested that coupling of the cardiovascular to the respiratory system mediates plasticity expressed in sympathetic nerve activity. We hypothesized that SDB evokes short-term plasticity of cardiorespiratory coupling (CRC). We analyzed respiratory frequency (fR), heart rate and its variability (HR&HRV), the power spectral density (PSD) of blood pressure (BP) and the ventilatory pattern before, during, and after a 20-min epoch of SDB. During SDB, CRC and the relative PSD of BP at fR increased; mean arterial pressure decreased; but HR varied; increasing (n = 3), or decreasing (n = 2) or remaining the same (n = 5). After SDB, short-term plasticity was not apparent for the group but for individuals differences existed between baseline and recovery periods. We conclude that a repeated practice, like pranayama, may strengthen CRC and evoke short-term plasticity effectively in a subset of individuals.

Keywords: Neural control of heart rate; Neural control of respiration; Neural control of sympathetic nerve activity; Poincaré plots; Pranayama.


Figures

Figure 1
Figure 1. The heart rate (HR) response to slow, deep breathing varied among subjects
A. Representative tracings at baseline, during, and after Slow, Deep Breathing. Traces during each period from top: blood pressure (purple) ECG (red) and Thoracic-Abdominal volume (blue). Markers; Peak of the R-wave in ECG (red) and onset of inspiration and peak of breath (upward and downward blue arrows respectively). B. During slow, deep breathing, respiratory frequency (fr) decreased well below ten breaths per minute (20 bthmpm) in all but 2 subjects (S7 and S9, left panel) and this decrease was significant for the group (Right Panel). In the 20-min epoch after SDB (Recovery), fr returned to baseline. C. Heart Rate (HR) did not change for the group across the epochs (right panel), but HR increased in 3 of 10 subjects (S4, S7, S10) during and in another (S5) after SDB (left panel, red lines).
Figure 2
Figure 2. Power Spectral Density (PSD) of respiration and blood pressure between 0.005 and 0.30 Hz; at baseline, during, and after slow, deep breathing
A. A set of PSD graphs representing the result consistent with our hypothesis. The respiratory PSD (blue line) identified the band width for the high-frequency component of cardiovascular PSD (purple line), because it depended on respiratory-modulated vagal nerve activity. The PSD of blood pressure had a small but evident component during relaxed breathing at baseline (left panel); robust, during slow, deep breathing (middle panel); and moderate during recovery (right panel). In this particular subject (S2), in comparing before and after slow deep breathing, the strongest component of the PSD for blood pressure shifted from a low frequency that was independent of respiration to a high frequency that corresponded to respiration. B. In 9 of 10 subjects, the percent of the total power in the BP PSD that overlapped with the respiratory PSD was highest during SDB (S2, depicted in A highlighted in yellow). The one exception (S6) had a large respiratory-modulated component at baseline, which increased during SDB and continued to increase during recovery. C. The relative BP-PSD increased for the group during SDB, but returned to baseline in recovery. D. Separating those subjects that decreased their HR during SDB (black-filled bars) from those that increased it (red-filled bars), revealed a possible effect of SDB on the BP-PSD during recovery may depend on the change in HR during SDB. All 3 of the subjects who increased their HR during SDB had a lower high frequency component in their relative PSD even though they responded well during SDB. The subject that had increase in HR during recovery (S5) also had a lower high frequency component following SDB.
Figure 3
Figure 3. Mean arterial blood pressure decreased during SDB in every subject but S4
A. Six individuals decreased their BP at least 3 percent (3–9%) during SDB, and three others (S2, S5, and S8) decreased less than 2% (0.8 to 2 %). The individual (S4) whose mean arterial BP increase 1.2% had the lowest baseline BP 79 mmHg). B. Group mean arterial BP at baseline decreased during SDB and returned to baseline during recovery. C. Again, separating the individuals in two groups based on their HR during SDB revealed that those that decreased their HR (black-filled bars) had a slightly larger decrease in their percent change in mean ABP from baseline than those that increased their HR (red). Further, blood pressure tended to remain lower in the period following SDB in the groups whose heart rate decreased during SDB.
Figure 4
Figure 4. Poincaré Plots of RR Intervals either n+1 (Left Column) or n+5 (Center Column) and TPVtd calculated for 50 Poincare plots plotted against n
A&D. At baseline for both subjects, n+1 versus n Poincare plots formed an elliptical cloud of points, and n+5 vs n plot had a more circular shape. These shapes are indicative indicative a normal HRV. The n+5 was plotted because the TPVtd plot showed an oscillation in which the nadir of SDSD occurred at 5. B&C. During SDB. The TPVtd revealed that both subjects had strong RSA with S8 greater than S10. In S8 the n+1 vs n plot had a small void on the line of identity in the center of the ellipse, which is near the mean HR. In the n+5 vs n graph represent the largest SDSD and the distribution forms two clouds. S10 reveals a more complex especially in the n+5 vs n Poincaré plot. C&E. Distribution patterns returned to baseline.
Figure 5
Figure 5. TPVtd analysis. Poincaré Plots of RR Intervals either n+1 (Left Column) or n+5 (Center Column) or n+25 (Right Column) plotted against n for subject S9. The complexity of the plots diminished during SDB (middle row) and this effect persisted in the first half of the recovery period
A. Baseline: rather than a simple ellipse, the distribution of RRI was complex at baseline. With two distinct distributions: 1) an ellipse along the line of identity (highlighted in yellow) and 2) clouds paralleling the x and y axes (highlighted in green). B. Slow, deep breathing: The distribution formed an ellipse which became a circular cloud at higher τ. C. Recovery: although the distribution and relationship of RRI returned to baseline during the recovery epoch, it was not immediate. Partitioning 20-min epoch in half revealed that for the first 10 min, the Poincaré plot formed an ellipse and in the second 5-min epoch the two distinct distributions resembling the baseline distribution returned.
Figure 6
Figure 6. Temporal Poincaré variability (TPV) plots revealed differences in the structure HRV after SDB
A. Baseline: from τ=1 to 5, an oscillation is present at each increment of 1 RR Interval and there are hints of an oscillation at higher τ. B. Slow, deep breathing: The oscillation is absent distribution formed an ellipse which became a circular cloud at higher τ. C. Recovery: The oscillation is accentuated. Further, the oscillation is absent in the Poincaré plot from the 1st half of the data set and SDSD is very low, whereas in the 2nd half SDSD increases and the amplitude of the oscillation is accentuated.
Figure 7
Figure 7. SD1, SD2 and TPVa at τ=1, 5 and ≥25 for the whole and partitioned data set. The variance of SD1 during recovery in the partitioned data set indicative of a nonstationarity in the data. The nonstationarity related to a persistent effect of SDB resolving, and then aggravating bigemney in HR
A, B & C. Blue bars: the values of SD1, SD2 and TPVa for the whole data set, Red bars: median + 25th and 75th percentile values with the data set partitioned in half. Green bars: values with the data set partitioned in quarters. SD1 = the standard deviation of successive difference (SDSD) and SD2 = the standard deviation of the RR Intervals (SDRR). The Temporal Poincaré Variability for averaged points or TPVa = the coefficient of variation for x, which the distance of the points from the origin. On the x-axis, w = the number of points that were averaged. As w increased, TPVa decreased as averaging reduced the variability caused by beat to beat variability (compare w=1(no averaging) to w>1). C. In the recovery period, the variability in SD1 indicated a nonstationarity in the data set (yellow oval highlight). The source of this variability was resolved with separate analysis of each half of the recovery data set, the SD1 values for the 1st&2nd halves were an order of magnitude different. A, B & C. Comparing TPVa: In B: TPVa decreased progressively as the number of points averaged increased (yellow curved arrow) reflecting the the distribution points becoming more circular (as in yellow highlighted regions in Fig. 6). In contrast in A&C: TPVa decreased abruptly with averaging (green arrow) reflecting the clustering of points as τ increased.
Figure 8
Figure 8. Correlations revealed the uniqueness of S2 (A&B) and that a change in mean arterial pressure during recovery varies with its change during SDB (C) and the change in HR (from baseline) during recovery (D)

References

    1. Abdala AP, McBryde FD, Marina N, Hendy EB, Engelman ZJ, Fudim M, Sobotka PA, Gourine AV, Paton JF. Hypertension is critically dependent on the carotid body input in the spontaneously hypertensive rat. J Physiol. 2012;590:4269–4277. - PMC - PubMed
    1. Abdala AP, Rybak IA, Smith JC, Paton JF. Abdominal expiratory activity in the rat brainstem-spinal cord in situ: patterns, origins and implications for respiratory rhythm generation. J Physiol. 2009;587:3539–3559. - PMC - PubMed
    1. Baekey DM, Dick TE, Paton JF. Pontomedullary transection attenuates central respiratory modulation of sympathetic discharge, heart rate and the baroreceptor reflex in the in situ rat preparation. Exp Physiol. 2008;93:803–816. - PubMed
    1. Bar KJ, Boettger MK, Schulz S, Neubauer R, Jochum T, Voss A, Yeragani VK. Reduced cardio-respiratory coupling in acute alcohol withdrawal. Drug Alcohol Depend. 2008;98:210–217. - PubMed
    1. Ben-Tal A, Shamailov SS, Paton JF. Evaluating the physiological significance of respiratory sinus arrhythmia: looking beyond ventilation-perfusion efficiency. J Physiol. 2012;590:1989–2008. - PMC - PubMed

Publication types

LinkOut - more resources