. 2014 Aug 12:8:233.
doi: 10.3389/fncel.2014.00233. eCollection 2014.

CX3CL1 is up-regulated in the rat hippocampus during memory-associated synaptic plasticity

Affiliations

CX3CL1 is up-regulated in the rat hippocampus during memory-associated synaptic plasticity

Graham K Sheridan et al. Front Cell Neurosci. .

Abstract

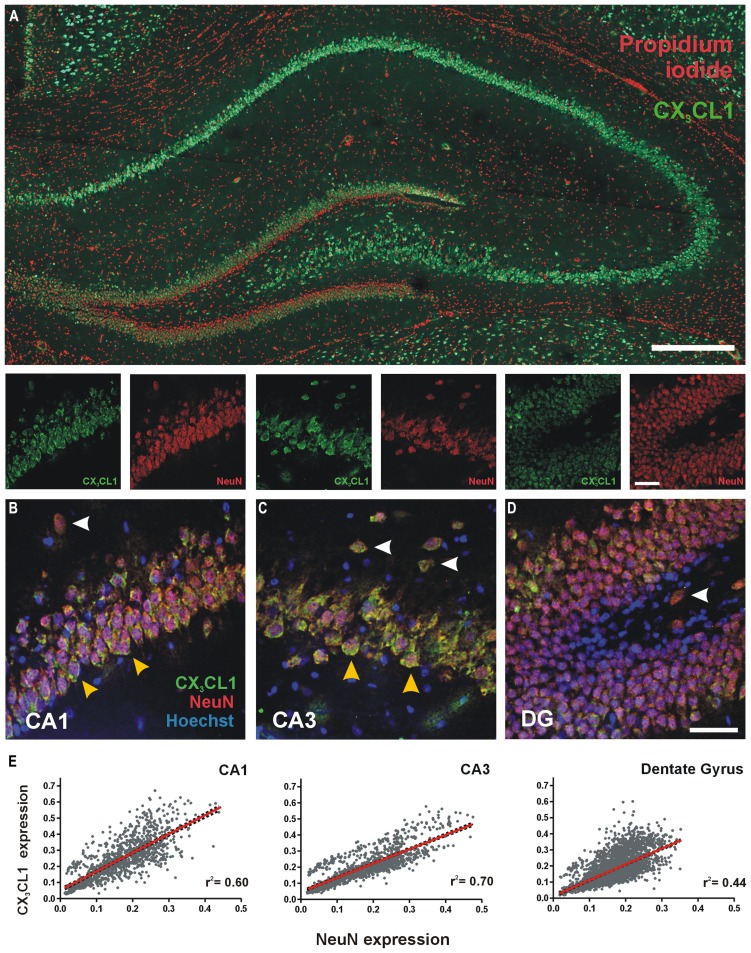
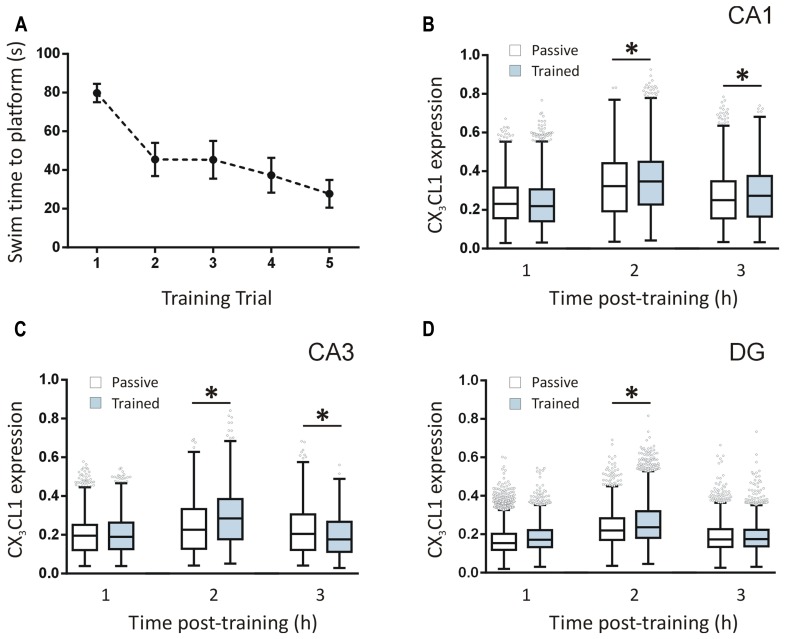
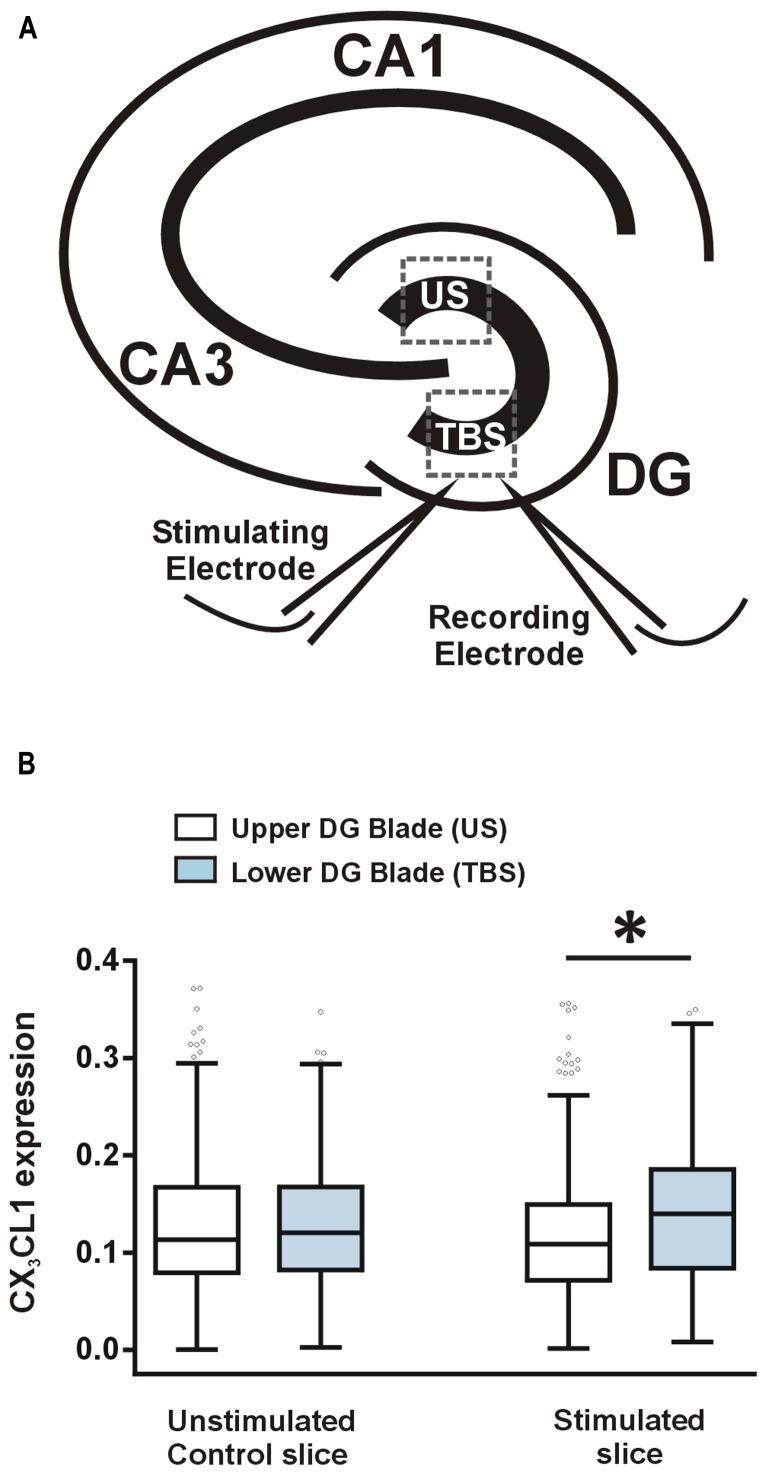
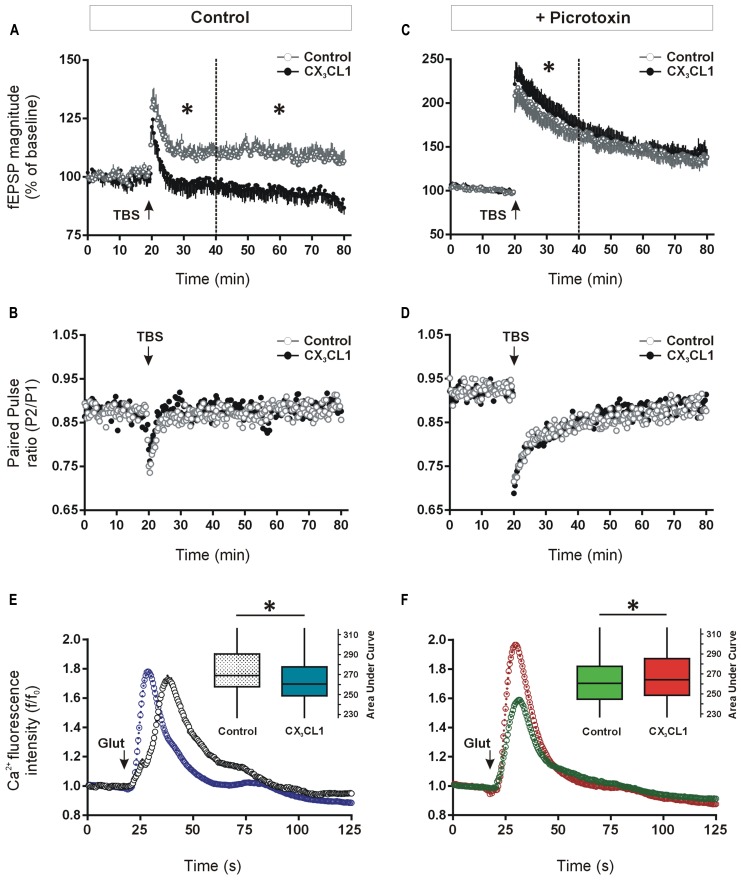
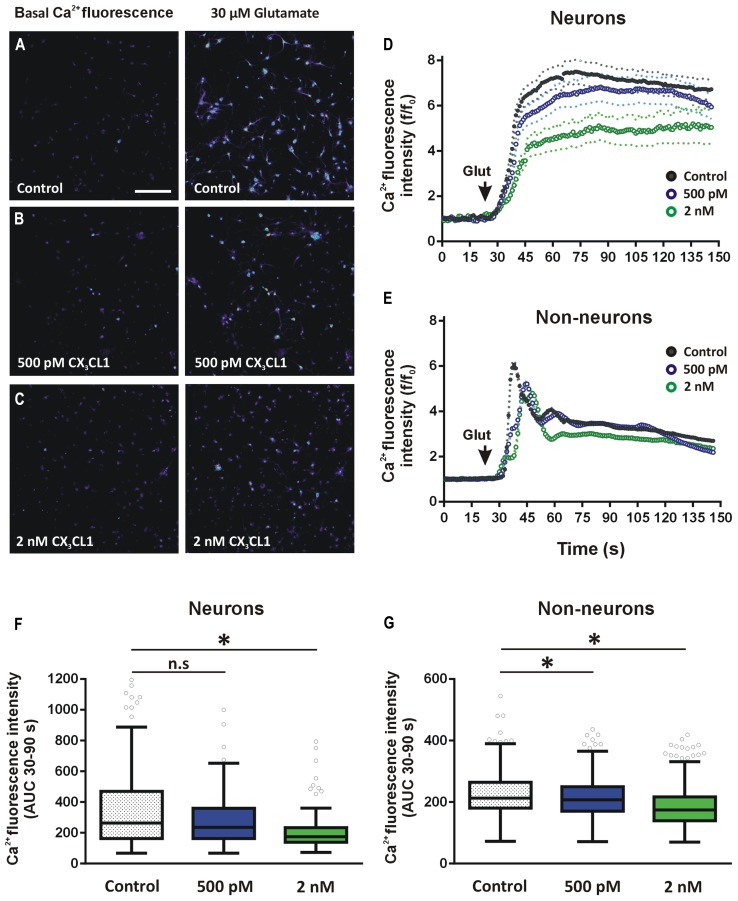
Several cytokines and chemokines are now known to play normal physiological roles in the brain where they act as key regulators of communication between neurons, glia, and microglia. In particular, cytokines and chemokines can affect cardinal cellular and molecular processes of hippocampal-dependent long-term memory consolidation including synaptic plasticity, synaptic scaling and neurogenesis. The chemokine, CX3CL1 (fractalkine), has been shown to modulate synaptic transmission and long-term potentiation (LTP) in the CA1 pyramidal cell layer of the hippocampus. Here, we confirm widespread expression of CX3CL1 on mature neurons in the adult rat hippocampus. We report an up-regulation in CX3CL1 protein expression in the CA1, CA3 and dentate gyrus (DG) of the rat hippocampus 2 h after spatial learning in the water maze task. Moreover, the same temporal increase in CX3CL1 was evident following LTP-inducing theta-burst stimulation in the DG. At physiologically relevant concentrations, CX3CL1 inhibited LTP maintenance in the DG. This attenuation in dentate LTP was lost in the presence of GABAA receptor/chloride channel antagonism. CX3CL1 also had opposing actions on glutamate-mediated rise in intracellular calcium in hippocampal organotypic slice cultures in the presence and absence of GABAA receptor/chloride channel blockade. Using primary dissociated hippocampal cultures, we established that CX3CL1 reduces glutamate-mediated intracellular calcium rises in both neurons and glia in a dose dependent manner. In conclusion, CX3CL1 is up-regulated in the hippocampus during a brief temporal window following spatial learning the purpose of which may be to regulate glutamate-mediated neurotransmission tone. Our data supports a possible role for this chemokine in the protective plasticity process of synaptic scaling.

Keywords: LTP; calcium imaging; chemokine signaling; fractalkine; learning and memory; water maze.


Figures

FIGURE 1
FIGURE 1
Expression of CX3CL1 in the CA1, CA3 and dentate gyrus (DG) of the rat hippocampus. (A) Basal levels of CX3CL1 expression in the rat dorsal hippocampus. Green: CX3CL1; Red: propidium iodide-stained nuclei. Scale bar = 200 μm. (B–D) CA1, CA3 and DG regions of the hippocampus, respectively, showing CX3CL1 (green), NeuN (red) and Hoechst (blue) expression. White arrowheads: interneurons; yellow arrowheads: CA pyramidal neurons. (E) Relationship between CX3CL1 and NeuN expression. Each dot represents a single cell. Linear regression analyses (red lines) appear on each plot with corresponding r2 values indicated. Linear regression p < 0.05 for CA1, CA3 and DG regions of the hippocampus.
FIGURE 2
FIGURE 2
Temporal changes in CX3CL1 expression in the rat hippocampus post-spatial learning measured by immunofluorescence. (A) Graph shows the average latency-to-platform times for rats trained in a single session (five trials) of the water maze task (n = 12). (B–D) Box plots represent the distributions of fluorescence intensity values for CX3CL1 protein expression in CA1, CA3, and DG cells at 1, 2 and 3 h post-water maze training, compared to passive control animals. Changes in CX3CL1 expression were analyzed using Kruskal–Wallis ANOVA and Dunn’s multiple comparisons post hoc tests; p < 0.01. There were four rats per time-point and three hippocampal sections analyzed per animal. The numbers of cells analyzed per hippocampal region were as follows: CA1: 1116–1201 cells; CA3: 1090–1247 cells; DG: 2888–3455 cells. The numbers of cells analyzed per time-point were: 1 h: 11,526 cells; 2 h: 10,355 cells; 3 h: 10,867 cells.
FIGURE 3
FIGURE 3
CX3CL1 expression increases 2 h following theta-burst stimulation-induced LTP in the DG of acute hippocampal slices. (A) Schematic diagram illustrating the position of stimulating and recording electrodes in hippocampal LTP experiments. Electrodes were always placed in the medial molecular layer of the lower blade of the DG approximately 100–200 μm apart. US, unstimulated DG blade; TBS, theta-burst stimulated blade. (B) Box plots showing the distribution of CX3CL1 fluorescence intensities in the upper and lower blades of the DG in stimulated slices and time-matched control slices. Asterisk indicates significant difference from the US blade (Kruskal–Wallis ANOVA and Dunn’s multiple comparisons post hoc tests; p < 0.001).
FIGURE 4
FIGURE 4
Differential effects of CX3CL1 on long-term potentiation (LTP) in the DG and glutamate-induced intracellular calcium rise in the CA1, in the presence and absence of GABAA/chloride receptor blockade. (A) The effect of the chemokine domain of CX3CL1 on LTP in acute hippocampal slices as measured by augmented field EPSP magnitude in the DG following theta-burst stimulation (TBS: 8 × 8 × 200 Hz). CX3CL1 inhibited dentate LTP in both the early and late phases post-TBS (i.e., 20–40 min and 40–80 min, respectively; one-way ANOVA; p < 0.05, indicated by an asterisk; n = 8 slices per group). CX3CL1 (500 pM) was present for the duration of the time period shown. (B) Shows the paired-pulse ratio between the first and second stimulations (50 ms interval) in the LTP experiment in A. (C) Shows the effect of CX3CL1 on dentate LTP in acute hippocampal slices as measured by augmented field EPSP magnitude following TBS in the presence of picrotoxin (100 μM). CX3CL1 (500 pM) and picrotoxin were present for the duration of the time period shown. CX3CL1 enhanced early LTP (one-way ANOVA; p < 0.05, indicated by an asterisk; n = 8 slices per group) while having no effect on late LTP. (D) Shows the paired-pulse ratio between the first and second stimulations (50 ms interval) in the LTP experiment in C. (E) Shows the effect of CX3CL1 on glutamate-induced calcium influx in the CA1 region of organotypic hippocampal slices cultured for 21 DIV. Pre-treatment of slice cultures with CX3CL1 (500 pM) for 15 min prior to glutamate exposure reduced calcium influx in the CA1 region (Mann–Whitney U test; p < 0.001). Box plot inset shows the area under the curve (AUC) for the whole experimental time-course. CX3CL1 (500 pM) was present for the duration of the time period shown. (F) The effect of CX3CL1 on glutamate-induced calcium influx in the CA1 region of organotypic hippocampal slices in the presence of picrotoxin. Pre-treatment of slice cultures with CX3CL1 (500 pM) and picrotoxin (100 μM) versus picrotoxin alone (control) for 15 min prior to glutamate exposure enhanced calcium influx in the CA1 region (Mann–Whitney U test; p < 0.001). Box plot inset shows the area under the curve (AUC) for the whole experimental time-course. CX3CL1 (500 pM) and/or picrotoxin (100 μM) were present for the duration of the time period shown.
FIGURE 5
FIGURE 5
Effect of CX3CL1 on glutamate-induced calcium dynamics in neurons and glia. (A–C) Representative images of intracellular calcium [Ca2+]i levels in mixed neuron-glial primary hippocampal cultures before and after 30 μM glutamate exposure. Control cells (A) were untreated prior to glutamate exposure. Treated cells were exposed to either (B) 500 pM or (C) 2 nM CX3CL1 for 15 min. Scale bar = 200 μm. (D,E) Shows the time-course of the [Ca2+]i response to glutamate in neurons (D) and non-neuronal cells (E). Cells were treated for 15 min with either 500 pM (blue circles) or 2 nM (green circles) CX3CL1 for 15 min prior to 30 μM glutamate exposure. Untreated control time-course is represented by black circles. Relative changes in [Ca2+]i were calculated for each cell at each time point as f/f0, where f is the [Ca2+]i fluorescence in each frame and f0 is the average baseline fluorescence per cell, calculated 20 s prior to glutamate addition. Primary hippocampal cell cultures were divided into neurons (138, 171, and 101 cells for control, 500 pM and 2 nM CX3CL1-treated cells, respectively) and non-neuronal (432, 726, and 604 cells for control, 500 pM and 2 nM CX3CL1-treated cells, respectively) cell populations based on their [Ca2+]i response to 30 μM glutamate (Pickering et al., 2008). (F,G) Quantification of the calcium imaging time-courses in D and E. 500 pM CX3CL1 attenuates glutamate-induced [Ca2+]i increases in non-neuronal cell types (Kruskal–Wallis ANOVA and Dunn’s multiple comparisons post hoc tests; p < 0.05), but has no significant effect on [Ca2+]i response in neurons. Pre-treatment of hippocampal cell cultures for 15 min with 2 nM CX3CL1, however, significantly attenuates glutamate-induced [Ca2+]i influx in both non-neuronal cells and in neurons (Kruskal–Wallis ANOVA and Dunn’s multiple comparisons post hoc tests; p < 0.001). The results represent combined data from five to six individual cover-slips per treatment group and from two separate cell culturing days.

References

    1. Adler M. W., Geller E. B., Chen X., Rogers T. J. (2006). Viewing chemokines as a third major system of communication in the brain. AAPS J. 7 E865–E870 10.1208/aapsj070484 - DOI - PMC - PubMed
    1. Adler M. W., Rogers T. J. (2005). Are chemokines the third major system in the brain? J. Leukoc. Biol. 78 1204–1209 10.1189/jlb.0405222 - DOI - PubMed
    1. Allen S. J., Crown S. E., Handel T. M. (2007). Chemokine: receptor structure, interactions, and antagonism. Annu. Rev. Immunol. 25 787–820 10.1146/annurev.immunol.24.021605.090529 - DOI - PubMed
    1. Antonucci F., Alpár A., Kacza J., Caleo M., Verderio C., Giani A., et al. (2012). Cracking down on inhibition: selective removal of GABAergic interneurons from hippocampal networks. J. Neurosci. 32 1989–2001 10.1523/JNEUROSCI.2720-11.2012 - DOI - PMC - PubMed
    1. Araujo D. M., Cotman C. W. (1993). Trophic effects of interleukin-4, -7, and -8 on hippocampal neuronal cultures: potential involvement of glial-derived factors. Brain Res. 600 49–55 10.1016/0006-8993(93)90400-H - DOI - PubMed