. 2014 Sep:255:71-82.
doi: 10.1016/j.mbs.2014.06.015. Epub 2014 Jul 6.

Central regulation of heart rate and the appearance of respiratory sinus arrhythmia: new insights from mathematical modeling

Affiliations

Central regulation of heart rate and the appearance of respiratory sinus arrhythmia: new insights from mathematical modeling

Alona Ben-Tal et al. Math Biosci. 2014 Sep.

Abstract

A minimal model for the neural control of heart rate (HR) has been developed with the aim of better understanding respiratory sinus arrhythmia (RSA)--a modulation of HR at the frequency of breathing. This model consists of two differential equations and is integrated into a previously-published model of gas exchange. The heart period is assumed to be affected primarily by the parasympathetic signal, with the sympathetic signal taken as a parameter in the model. We include the baroreflex, mechanical stretch-receptor feedback from the lungs, and central modulation of the cardiac vagal tone by the respiratory drive. Our model mimics a range of experimental observations and provides several new insights. Most notably, the model mimics the growth in the amplitude of RSA with decreasing respiratory frequency up to 7 breaths per minute (for humans). Our model then mimics the decrease in the amplitude of RSA at frequencies below 7 breaths per minute and predicts that this decrease is due to the baroreflex (we show this both numerically and analytically with a linear baroreflex). Another new prediction of the model is that the gating of the baroreflex leads to the dependency of RSA on mean vagal tone. The new model was also used to test two previously-suggested hypotheses regarding the physiological function of RSA and supports the hypothesis that RSA minimizes the work done by the heart while maintaining physiological levels of arterial CO2. These and other new insights the model provides extend our understanding of the integrative nature of vagal control of the heart.

Keywords: Autonomic control; Heart rate; Mathematical model; Respiratory sinus arrhythmia.


Figures

Figure 1
Figure 1. A schematic description of the heart rate control model for mammals
(a) Central rhythm-generating signal A, (b) Phrenic nerve signal Rp, (c) Airflow q, (d) Lung volume VA, (e) Heart beat period TL, (f) Afferents from the baroreceptors, BR(TL) (showing the linearized and full, non-linear versions), (g) Integrated cardiac vagal signal CV N, (h) Respiratory gating function G(Aq). Time-series results produced with the linear baroreflex. The lung model is described in the Appendix.
Figure 2
Figure 2. Heart beat period (TL) as a function of mean arterial pressure (MAP)
Upper panel: A selection of cardiac baroreflex response curves from the literature, some using neck suction [41, 43, 42] and some injections of vasoactive agents [44, 45] to change blood pressure. All data sets were shifted to a common mid-point. Lower panel: Blue line with circles is the theoretical curve from [43] based on experimental results from [70], dashed red line is calculated with the model using the nonlinear BR, while the dash-dotted green line uses the linear BR. For model simulations, we had TI = 0.5TE, c1 and c2 were set to zero (no RSA) and CV N0 = 1.101 was chosen so that mean HR was 72 bpm. MAP was changed by varying Rs, the systemic resistance.
Figure 3
Figure 3. The magnitude of RSA increases linearly with mean vagal tone (average of CV N over one breathing period), as found experimentally
(a) Model results with linear BR as we change MAP. This is done by setting MAP=VcRs/TL in the expression for BR to given values. Otherwise, 2TI = TE and default parameters are used. The blue lines (dashed and dash-dotted) correspond to x-axis units of TLmax (the longest heart-beat period attained during a breath) and the solid red line corresponds to x-axis units of mean vagal tone, CVN. The flat line shows the response when G(qA) = 1 (i.e. when there is no gating, see Eq. (2)). (b) Data extracted from Figure 3 of [46]. Note that TLmax is proportional to mean CV N and mean TL as MAP is changed.
Figure 4
Figure 4. Roughly linear dependence of RSA amplitude on tidal volume (VT) agrees with experiments
TI = TE with default parameters. Linear BR in blue circles, nonlinear BR in green squares. The red solid line is a least-squares fit to the model output with linear baroreflex. The black dashed line is a least-squares fit to experimental data from [49].
Figure 5
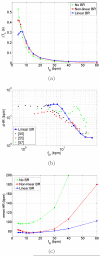
Figure 5. RSA amplitude peaks at a small respiratory frequency
(a) ΔTL as a function of respiratory frequency (fR in breaths per minute, bpm). (b) Experimental data compared with one curve from (a) on a log-log plot. (c) Mean HR as a function of respiratory frequency. VT = 1 L for all points and TI = TE. Solid blue lines – default cardiac parameters with the linear baroreflex. Dashed red lines – default cardiac parameters with the non-linear baroreflex. Dash-dotted green lines – the baroreflex has been removed by setting c3 = 0.
Figure 6
Figure 6. RSA amplitude is largest under deep, slow breathing, as found experimentally
Linear BR and 2TI = TE are used for all simulations. Minute ventilation was kept the same in all cases. Solid blue lines: TR = 5 s, VT = 0.3768 L (Kn = 0.5). Dashed red lines: TR = 10 s, VT = 0.7552 L (Kn = 0.74). Dash-dotted green lines: TR = 2.5 s, VT = 0.1879 L (Kn = 0.562). Panels from top down: lung volume (VA), heart rate (HR) and integrated vagal nerve activity (CV N).
Figure 7
Figure 7. The phase between heart rate (HR) and lung volume (VA) is in qualitative agreement with experimental observations
Red squares – the phase difference (Δϕ) between a peak in the heart period (TL) and the preceding trough in the lung volume. Blue stars – negative values of red squares for easier comparison with the literature. Simulations performed with the linear BR, TI = TE and VT = 1 L. The model output is plotted on a logarithmic scale for easier comparison with experiments [32, 54, 57, 59].
Figure 8
Figure 8. A prediction for the behaviour of mean heart rate as tidal volume is varied
The figure shows mean heart rate (HR) as a function of the tidal volume (VT). Blue circles – linear BR, green squares – nonlinear BR.
Figure 9
Figure 9. Lower mean heart rate (HR) reduces RSA amplitude and increases the peak-HR time-delay when the linear baroreflex is used
VT = 0.5 L (Kn = 0.46), TR = 5 s, TI = TE, and the linear version of BR is used. Solid blue lines: pce=39 mmHg, CV N 0 = 1.1, dashed red lines: pce=38 mmHg, CV N 0 = 1.65, dash-dotted green lines: pce=37 mmHg, CV N 0 = 2.4. Shaded area shows inspiration time.
Figure 10
Figure 10. Larger inspiration-to-expiration ratio (TI/TE) decreases the time between end of inspiration and the peak in HR
(a): Top panel shows airflow into the lungs (q) and the bottom shows the heart rate (HR). TR = 5 s and minute ventilation is 5.964 L/min. pce was constrained to 38.00 mmHg for all three curves. Blue solid curves: TI/TE = 1, Kn = 0.46, CV N 0 = 1.65. Red dashed curves: TI/TE = 0.5, Kn = 0.805, CV N 0 = 1.68. Green dash-dotted curves: TI/TE = 2, Kn = 0.235, CV N 0 = 1.67. Horizontal bars show the inspiration period (TI) as defined by A(t). (b): the time between end of inspiration and the peak in HR as a function of TI/TE when pce was constrained to 38.00 mmHg (blue stars) and when the mean HR was constrained to 67 bpm (red squares).
Figure 11
Figure 11. RSA minimizes the work done by the heart while maintaining arterial CO2 levels
TR = 10 s, VT = 1 L (Kn = 0.83), TI = TE. c0 is decreased steadily and SM is adjusted to keep mean pce at its initial value of 37.11 ± 0.02 mmHg (when c0 = SM = 1 with the linear baroreflex). Energy per heart-beat (E) is calculated and plotted as a function of HR variation. Linear baroreflex is used.

References

    1. Spyer KM. Central nervous integration of cardiovascular control. Journal of Experimental Biology. 1982;100(OCT):109–128. - PubMed
    1. Sherwood L. Human physiology : from cells to systems. 2nd Edition West Pub. Co.: 1993.
    1. Bradley TD, Floras JS, editors. Sleep apnea - Implications in cardiovascular and cerebrovascular disease. Marcel Dekker, Inc.; New York: 2000.
    1. Yasuma F, Hayano J. Respiratory sinus arrhythmia - why does the heartbeat synchronize with respiratory rhythm? Chest. 2004;125(2):683–690. - PubMed
    1. Grossman P, Taylor EW. Toward understanding respiratory sinus arrhythmia: Relations to cardiac vagal tone, evolution and biobehavioral functions. Biological Psychology. 2007;74(2):263–285. - PubMed

Publication types

LinkOut - more resources