

A comparison of the Scottish Index of Multiple Deprivation (SIMD) 2004 with the 2009 + 1 SIMD: does choice of measure affect the interpretation of inequality in mortality?
- PMID: 25001866
- PMCID: PMC4105786
- DOI: 10.1186/1476-072X-13-27
A comparison of the Scottish Index of Multiple Deprivation (SIMD) 2004 with the 2009 + 1 SIMD: does choice of measure affect the interpretation of inequality in mortality?
Abstract
Background: There is a growing international literature assessing inequalities in health and mortality by area based measures. However, there are few works comparing measures available to inform research design. The analysis here seeks to begin to address this issue by assessing whether there are important differences in the relationship between deprivation and inequalities in mortality when measures that have been constructed at different time points are compared.
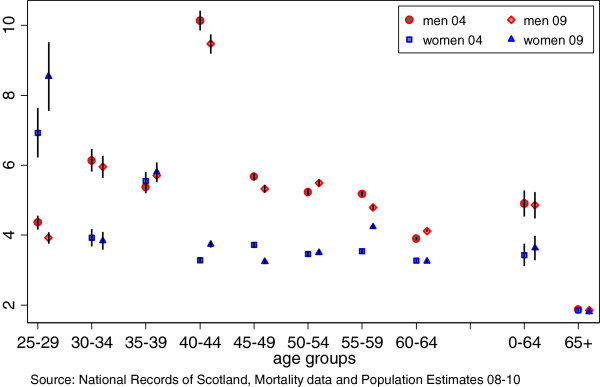
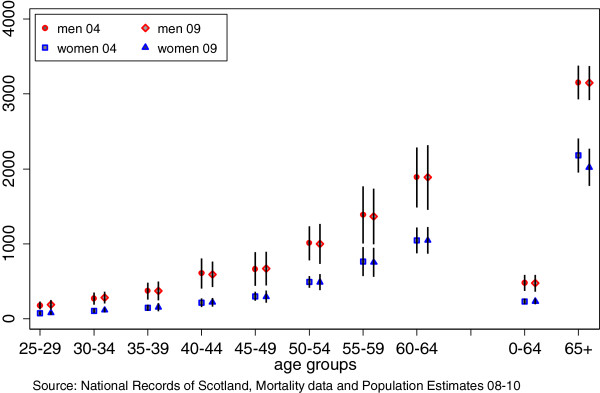
Methods: We contrast whether the interpretation of inequalities in all-cause mortality between the years 2008-10 changes in Scotland if we apply the earliest (2004) and the 2009 + 1 releases of the Scottish Index of Multiple Deprivation (SIMD) to make this comparison. The 2004 release is based on data from 2001/2 and the 2009 + 1 release is based on data from 2008/9. The slope index of inequality (SII) and 1:10 ratio are used to summarise inequalities standardised by age/sex using population and mortality records.
Results: The 1:10 ratio suggests some differences in the magnitude of inequalities measured using SIMD at different time points. However, the SII shows much closer correspondence.
Conclusions: Overall the findings show that substantive conclusions in relation to inequalities in all-cause mortality are little changed by the updated measure. This information is beneficial to researchers as the most recent measures are not always available. This adds to the body of literature showing stability in inequalities in health and mortality by geographical deprivation over time.
Figures
References
-
- Datta GD, Kawachi I, Delpierre C, Lang T, Grosclaude P. Trends in Kaposi’s sarcoma survival disparities in the United States: 1980 through 2004. Cancer Epidemiol Biomarkers Prev. 2010;19(11):2718–2726. - PubMed
-
- Boarini R, Mira d'Ercole M. Measures of Material Deprivation in OECD Countries. Paris: OECD; 2006. Working Paper No 372006.
-
- Townsend P. Poverty in the United Kingdom. Harmondsworth: Penguin; 1979.
Publication types
MeSH terms
Grants and funding
LinkOut - more resources
Full Text Sources
Other Literature Sources
Medical
