. 2013 Nov 28;3(2):202-8.
doi: 10.1016/j.molmet.2013.11.007. eCollection 2014 Apr.

Hypothalamic glucagon signals through the KATP channels to regulate glucose production

Affiliations

Hypothalamic glucagon signals through the KATP channels to regulate glucose production

Mona A Abraham et al. Mol Metab. .

Abstract

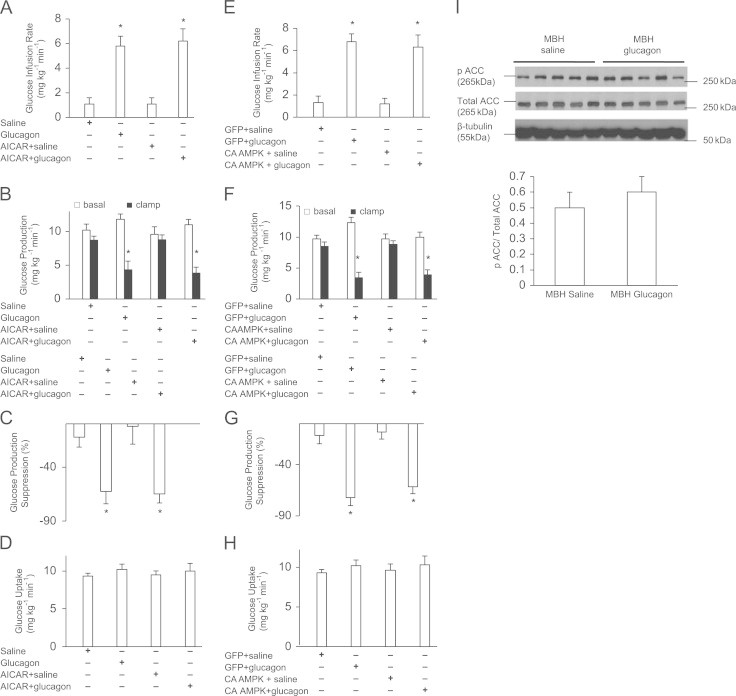
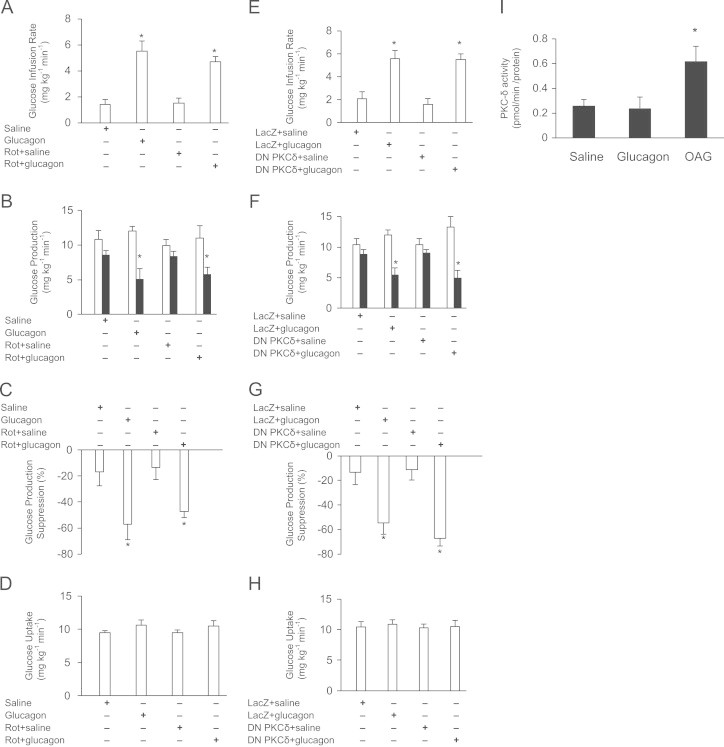
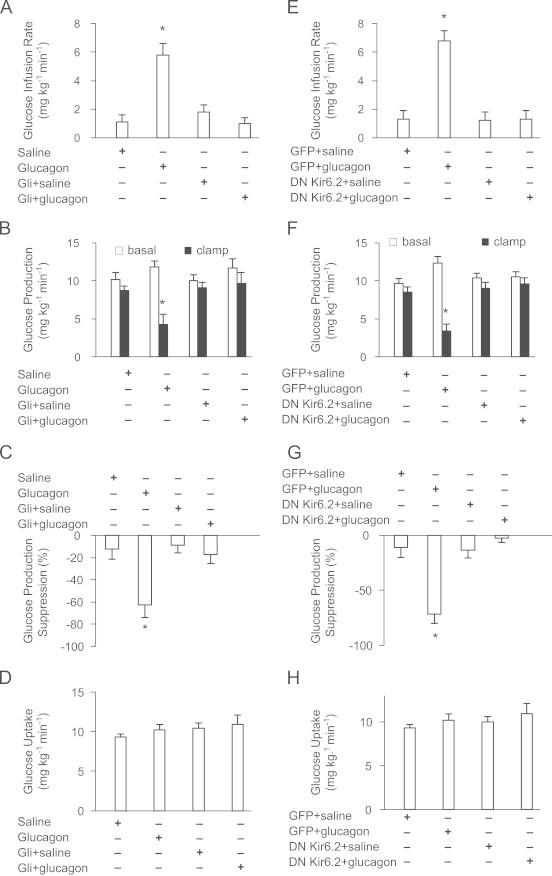
Insulin, leptin and GLP-1 signal in the mediobasal hypothalamus (MBH) to lower hepatic glucose production (GP). MBH glucagon action also inhibits GP but the downstream signaling mediators remain largely unknown. In parallel, a lipid-sensing pathway involving MBH AMPK→malonyl-CoA→CPT-1→LCFA-CoA→PKC-δ leading to the activation of KATP channels lowers GP. Given that glucagon signals through the MBH PKA to lower GP, and PKA inhibits AMPK in hypothalamic cell lines, a possibility arises that MBH glucagon-PKA inhibits AMPK, elevates LCFA-CoA levels to activate PKC-δ, and activates KATP channels to lower GP. We here report that neither molecular or chemical activation of MBH AMPK nor inhibition of PKC-δ negated the effect of MBH glucagon. In contrast, molecular and chemical inhibition of MBH KATP channels negated MBH glucagon's effect to lower GP. Thus, MBH glucagon signals through a lipid-sensing independent but KATP channel-dependent pathway to regulate GP.

Keywords: Glucagon; Glucose production; Hypothalamus; KATP channels.


Figures

Figure 1
Figure 1
Role of MBH AMPK in glucagon action. (A) Glucose infusion rate, (B) GP, (C) GP suppression expressed as the percentage decrease from basal period (60–90 min) to the clamp period (180–210 min) and (D) glucose uptake obtained during the clamps that received MBH saline (n=5), glucagon (n=5), AICAR+saline (n=5) or AICAR+glucagon (n=7). (E) Glucose infusion rate, (F) GP, (G) GP suppression expressed as the percentage decrease from basal period (60–90 min) to the clamp period (180–210 min) and (H) glucose uptake obtained during the clamps that received MBH GFP+saline (n=5), GFP+glucagon (n=5), CA AMPK+saline (n=5) or CA AMPK+glucagon (n=6). (I): Phosphorylation of ACC. Shown above is the representative western blot of pACC in saline (n=5) and glucagon (n=5) treated MBH wedges normalized to total ACC and B-tubulin. Shown below is the quantification of pACC normalized to total ACC. Data are shown as means+SE. *P<0.05.
Figure 2
Figure 2
Role of MBH PKC-δ in glucagon action. (A) Glucose infusion rate, (B) GP, (C) GP suppression expressed as the percentage decrease from basal period (60–90 min) to the clamp period (180–210 min) and (D) glucose uptake obtained during the clamps that received MBH Saline (n=5); Glucagon (n=5); Rot+saline (n=5); Rot+glucagon (n=5). Rot=Rottlerin. (E) Glucose infusion rate, (F) GP, (G) GP suppression expressed as the percentage decrease from basal period (60–90 min) to the clamp period (180–210 min) and (H) glucose uptake obtained during the clamps that received MBH LacZ+saline (n=5); Lacz+glucagon (n=5); DN PKC-δ+saline (n=5); DN PKC-δ+glucagon (n=5). I: PKC-δ activity in MBH wedges. Shown is a representative quantification from three samples in each treatment group. Data are shown as means+SE. *P<0.05.
Figure 3
Figure 3
Role of MBH KATP channels glucagon action. (A) Glucose infusion rate, (B) GP, (C) GP suppression expressed as the percentage decrease from basal period (60–90 min) to the clamp period (180–210 min) and (D) glucose uptake obtained during the clamps that received Saline (n=5); Glucagon (n=5); Gli+saline (n=5); Gli+glucagon (n=4). Gli=Glibenclamide. (E) Glucose infusion rate, (F) GP, (G) GP suppression expressed as the percentage decrease from basal period (60–90 min) to the clamp period (180–210 min) and (H) glucose uptake obtained during the clamps that received MBH GFP+saline (n=5); GFP+glucagon (n=5); DN Kir6.2+saline (n=5); DN Kir6.2+glucagon (n=5). Values are shown as means+SE. *P<0.05.

References

    1. Mighiu P.I., Yue J.T., Filippi B.M., Abraham M.A., Chari M., Lam C.K., Yang C.S., Christian N.R., Charron M.J., Lam T.K. Hypothalamic glucagon signaling inhibits hepatic glucose production. Nature Medicine. 2013;19:766–772. - PubMed
    1. Damm E., Buech T.R., Gudermann T., Breit A., Melanocortin-induced P.K.A. activation inhibits AMPK activity via ERK-1/2 and LKB-1 in hypothalamic GT1-7 cells. Molecular Endocrinology. 2012;26:643–654. - PMC - PubMed
    1. Djouder N., Tuerk R.D., Suter M., Salvioni P., Thali R.F., Scholz R., Vaahtomeri K., Auchli Y., Rechsteiner H., Brunisholz R.A., Viollet B., Makela T.P., Wallimann T., Neumann D., Krek W. PKA phosphorylates and inactivates AMPKalpha to promote efficient lipolysis. The EMBO Journal. 2010;29:469–481. - PMC - PubMed
    1. Yang C.S., Lam C.K., Chari M., Cheung G.W., Kokorovic A., Gao S., Leclerc I., Rutter G.A., Lam T.K. Hypothalamic AMP-activated protein kinase regulates glucose production. Diabetes. 2010;59:2435–2443. - PMC - PubMed
    1. Lam T.K. Neuronal regulation of homeostasis by nutrient sensing. Nature Medicine. 2010;16:392–395. - PubMed