Review
. 2012 Jan;2(1):221-54.
doi: 10.1002/cphy.c100083.

Central chemoreceptors: locations and functions

Affiliations
Review

Central chemoreceptors: locations and functions

Eugene Nattie et al. Compr Physiol. 2012 Jan.

Abstract

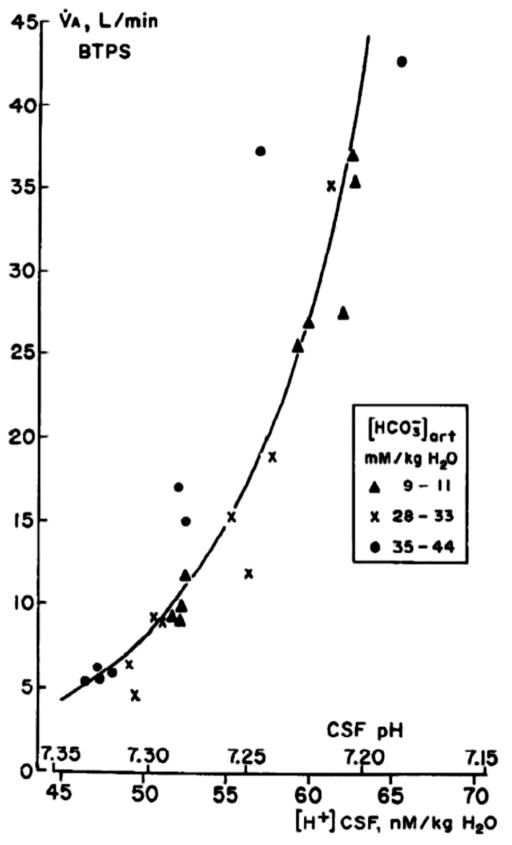
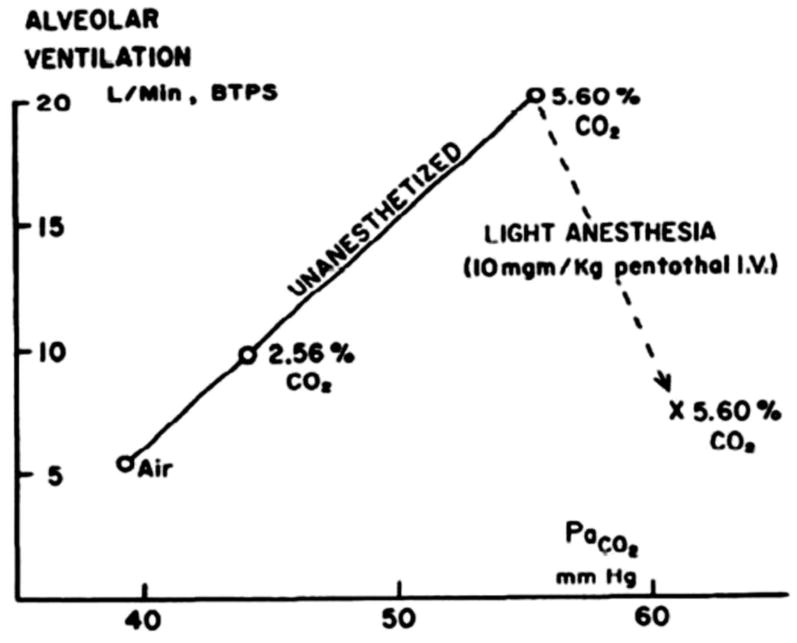
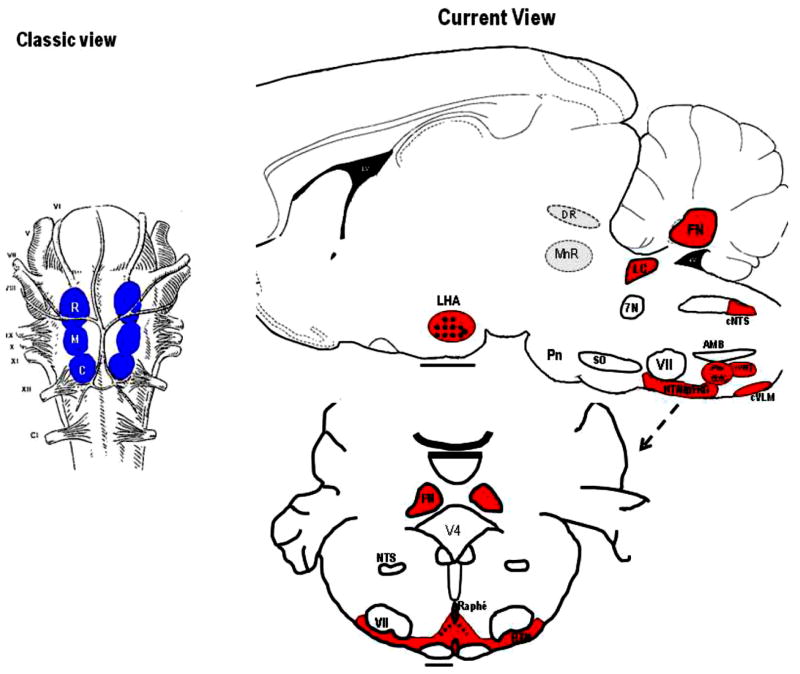
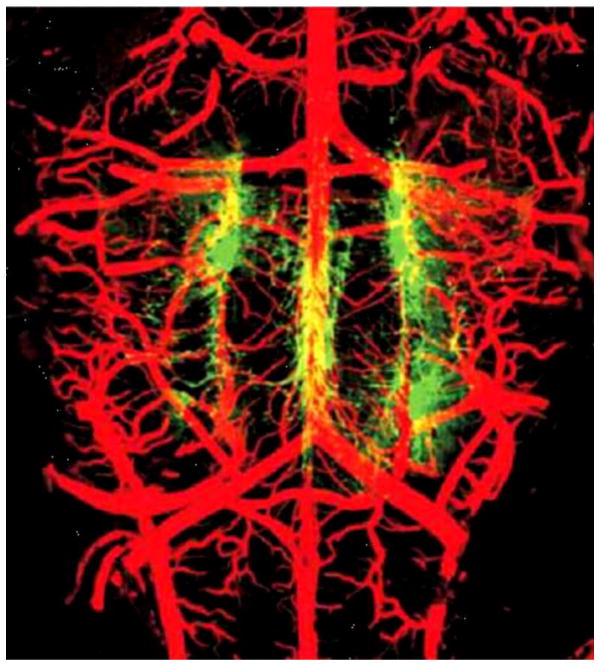
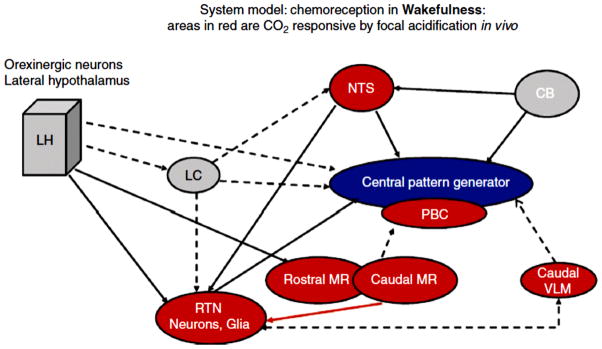
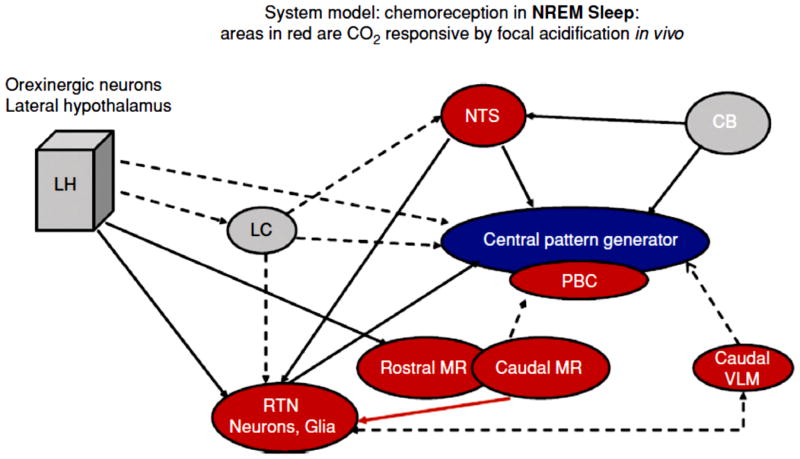
Central chemoreception traditionally refers to a change in ventilation attributable to changes in CO2/H(+) detected within the brain. Interest in central chemoreception has grown substantially since the previous Handbook of Physiology published in 1986. Initially, central chemoreception was localized to areas on the ventral medullary surface, a hypothesis complemented by the recent identification of neurons with specific phenotypes near one of these areas as putative chemoreceptor cells. However, there is substantial evidence that many sites participate in central chemoreception some located at a distance from the ventral medulla. Functionally, central chemoreception, via the sensing of brain interstitial fluid H(+), serves to detect and integrate information on (i) alveolar ventilation (arterial PCO2), (ii) brain blood flow and metabolism, and (iii) acid-base balance, and, in response, can affect breathing, airway resistance, blood pressure (sympathetic tone), and arousal. In addition, central chemoreception provides a tonic "drive" (source of excitation) at the normal, baseline PCO2 level that maintains a degree of functional connectivity among brainstem respiratory neurons necessary to produce eupneic breathing. Central chemoreception responds to small variations in PCO2 to regulate normal gas exchange and to large changes in PCO2 to minimize acid-base changes. Central chemoreceptor sites vary in function with sex and with development. From an evolutionary perspective, central chemoreception grew out of the demands posed by air versus water breathing, homeothermy, sleep, optimization of the work of breathing with the "ideal" arterial PCO2, and the maintenance of the appropriate pH at 37°C for optimal protein structure and function.


Figures

Figure 1
Figure 1. The ventilatory response to changes in brain interstitial fluid pH as studied in conscious goats
The response of alveolar ventilation to CO2 inhalation in normal acid-base conditions (X) as well as in chronic metabolic acidosis (solid triangles) and alkalosis (solid circles) in a conscious goat. Fencl et al., Am. J. Physiol. 1966 (65), used with permission.
Figure 2
Figure 2. The effect of anesthesia on the CO2 response
Effect of light anesthesia on the ventilatory response to inhaled 2.56% and 5.6% CO2. While breathing 5.6% CO2, 10 mg/kg sodium pentothal was injected through a catheter in the jugular vein. Subsequent measurements were made during the last 5 min of a 15-min period of anesthesia. Pappenheimer et al., Am. J. Physiol. 1965 (200), used with permission.
Figure 3
Figure 3. Schematic location of central chemoreceptor sites
Locations of central chemoreceptors; the classic view: chemoreception located at ventral medullary surface (left panel) and the current view: chemoreception is widely distributed in hindbrain (right panel). Abbreviations: R, rostral; M, middle; C, caudal; LHA, lateral hypothalamus; DR, dorsal raphe; FN, fastigial nucleus; 4v, fourth ventricle; LC, locus ceruleus; 7N, facial nerve; cNTS, caudal nucleus tractus solitarious; AMB, ambiguous; VII, facial nucleus; SO, superior olive; PBC, pre-BÖotzinger Complex; rVRG, rostral ventral respiratory group; cVLM, caudal ventrolateral medulla; RTH/pFRG, retrotrapezoid nucleus/parafacial respiratory group; and Pn, pons [modified from Figure 1 in Nattie (168) and used with permission].
Figure 4
Figure 4. Blood vessels and serotonergic neurons on the ventral medullary surface
A confocal image of arteries filled with fluorescein-tagged albumin (red) and serotonergic neurons stained with anti-TPH antibody (green). (A) TPH-IR neurons and arteries seen in on the ventral surface of the medulla en bloc; filled vessels include arteries and some veins. [Adapted with permission from Macmillan Publishers Ltd: Nature Neuroscience (20), 2002.]
Figure 5
Figure 5. Schematic view of set-up for study of conscious rats in wakefulness and sleep
Drawing of experimental set-up including blow-up of dialysis probe tip (Panel A) and example of typical tracings (Breathing, EEG, neck EMG) in air and 7% CO2 during wakefulness (AW), non-rapid eye movement (NREM), and rapid eye movement (REM) sleep (Panel B).
Figure 6
Figure 6. Lesions in the RTN region in anesthetized rats reduces the CO2 response dramatically
The average response of integrated phrenic amplitude to increased end-tidal PCO2 before (solid line) and after (dotted line) injection of 100 nl kainic acid into the retrotrapezoid nucleus. These rats were anesthetized initially with halothane followed by chloralose-urethane. Mean +/− SEM values are shown (n = 4). (Reprinted from Respiration Physiology, 97, Nattie EE, and Li A. Retrotrapezoid nucleus lesions decrease phrenic activity and CO2 sensitivity in rats. 63–77, 1994, (183) with permission from Elsevier.)
Figure 7
Figure 7. Focal acidification in the RTN increases ventilation in wakefulness
Ventilation in absolute terms (A) and expressed as % baseline (B) in unanesthetized rats (n = 7) dialyzed with 25% CO2 in the retrotrapezoid nucleus during wakefulness (solid circles n = 13 trials) and behaviorally defined sleep (open circles, N = 10 trials). Mean +/− SE values are shown. Control room air values were obtained before and after 20-min period of dialysis. The 4 pre-exposure control values were combined into single value. Ventilation during focal RTN acidification was significantly greater during wakefulness when expressed in absolute terms or as % baseline. Note that ventilation increased to 24% of baseline. There was no response during sleep. Li et al., J. Appl. Physiol. 1999, (140), used with permission.
Figure 8
Figure 8. The location of putative chemoreceptor neurons in the RTN
Location and general characteristics of retrotrapezoid nucleus (RTN) neurons. A: schematic but correctly scaled drawing of a parasagittal section through the pontomedullary region of the adult rat showing the location of the RTN. BötC, Bötzinger region of the ventral respiratory column; preBötC, pre-Bötzinger region; rVRG, rostral ventral respiratory group; cVRG, caudal ventral respiratory group; IS, inferior salivary nucleus; LRt, lateral reticular nucleus; nA, nucleus ambiguus pars compacta; SO, superior olive; tz, trapezoid body; 7, facial motor nucleus; 7n, seventh nerve. The two black dots are the cell bodies of the neurons shown in E and F. B: coronal section at the level indicated by the arrows in A showing the distribution of neurons that express Phox2b (left side of brain). The chemoreceptors are the Phox2b-positive neurons that do not express tyrosine-hydroxylase (TH). The cells that express both markers are the C1 neurons, which regulate blood pressure. C: method used to record from RTN neurons in vivo. D: effect of changing end-expiratory CO2 on the activity of an RTN neuron recorded in vivo after intracerebral injection of the glutamate blocker kynurenic acid. The neuron still encodes the level of arterial CO2 despite the fact that the drug has silenced the activity of the central pattern generator (CPG; evidence that it has is not shown in the figure). E and F: structure of two RTN neurons recorded in vivo illustrating the fact that a major portion of the dendritic domain of these cells resides within the marginal layer of the ventral medullary surface. Guyenet, PG, J. Appl. Physiol. 2008, (80) used with permission.
Figure 9
Figure 9. Lesions of putative RTN chemosensitive neurons alters the apneic threshold
Effect of bilateral injections of SSP-SAP into the RTN on the central chemoreflex. A, relationship between phrenic nerve discharge (PND) and end-expiratory CO2 in a control rat 2 weeks after bilateral injection of saline. The apnoeic threshold is 5.2%. B, same experiment in a different rat 2 weeks after bilateral treatment with 2 × 0.6 ng of SSP-SAP. The apnoeic threshold is 7.9%. PND above the apnoeic threshold appears normal. C, relationship between mv PND and end-expiratory CO2 in controls (n = 19) and in 11 rats treated bilaterally with 2 × 0.6 ng of SSPSAP causing the destruction of 70% of the Phox2b+TH− neurons of RTN. One arbitrary unit represents the highest value of mv PND registered at steady state with end-expiratory CO2 set at 9.5–10%. *Statistical significance by RM ANOVA (P < 0.05). D, effect of graded lesions of the Phox2b+TH− neurons of the RTN on the apnoeic threshold measured as shown in A and B. *Statistically significant difference from the other two groups by ANOVA (P < 0.05). E, correlation between apnoeic threshold and percentage Phox2b+TH− neurons remaining (10 rats with 2 injections of toxin on each side and 6 rats with one injection on each side). The F, r2 and probability values of the linear regression are indicated in the figure. Takakura et al., J. Physiol., John Wiley and Sons (251) used with permission.
Figure 10
Figure 10. Serotonergic neurons respond to CO2
Neurons in cell cultures from the medullary raphe’ are chemosensitive to acidosis. (A) Example of the firing rate of an acidosis-stimulated neuron in response to respiratory acidosis and alkalosis. Lower trace is bath pH measured simultaneously at the inflow to the recording chamber. (B) Example of the firing rate of an acidosis-inhibited neuron in response to the same stimuli. (C) Acidosis-stimulated neurons respond to both respiratory acidosis and metabolic acidosis, indicating that a change in pHo (and/or intracellular pH), in the absence of changes in CO2, is sufficient for a response to occur. (Reprinted from Respiration Physiology, 129, Richerson et al., Chemosensitivity of serotonergic neurons of the rostral ventral medulla. 175–189, 2001, (217) with permission from Elsevier.)
Figure 11
Figure 11. Focal acidification at the caudal chemosensitive zone increases ventilation in wakefulness
Focal acidification just below the caudal ventral surface chemosensitive area increases ventilation. Illustrative example of a single experiment in a responsive animal. The period of focal acidification is depicted by the gray rectangle with control periods shown before and after. The EEG and EMG recordings shown in panel A indicate the presence of wakefulness and sleep periods before, during and after focal acidosis. The ventilation data in the bottom of panel A shows that the increase of ventilation during high CO2 dialysis is present only in wakefulness. Note that at the onset of high CO2 dialysis when the rat was asleep (open symbols) ventilation did not increase but quickly did so when the animal woke up (filled symbols). In panel B, we show actual recordings of the plethysmograph pressure signal (upper trace), the EEG (middle trace) and the EMG (lower trace) taken from the averaged data points depicted by the lines and arrows. (Reprinted from Respiration Physiology & Neurobiology, 171, da Silva et al., High CO2/H+ dialysis in the caudal ventrolateral medulla (Loeschcke’s area) increases ventilation in wakefulness. 46–53, 2010, (35) with permission from Elsevier.)
Figure 12
Figure 12. Orexin participates in chemoreception
The role of orexin in central chemoreception. The top panel is a schematic of a saggital section of rat brain showing the location of orexin containing neurons in the hypothalamus and their projection sites in the retrotrapezoid nucleus (RTN) and raphe magnus (RM) and raphe obscurus (Rob), which have been identified as participating in central chemoreception. The arrows point to plots demonstrating chemoreception effects at each site, At the left, the hypercapnic responses of ventilation in wild-type (WT) mice and prepro-orexin knockout mice (ORX-KO) during quiet Wakefulness are shown. Data are presented as means± SEM of five WT mice and five ORX-KO mice. *P < 0.05 compared with WT mice. At the right, the Figure shows the effects of dialysis of vehicle solution (solid circles; N= 6) and 5 mM SB-334867, an Ox1R antagonist, (open circles; N= 6) into the medullary raphe on ventilation while the rats were breathing air and 7% CO2 during wakefulness in the dark period. Mean ± SEM values are shown. The −16% effect is significant comparing vehicle to SB-334867 treatment during 7% CO2 breathing for ventilation (P < 0.001, repeated measures ANOVA interaction with gas type). In the middle, the Figure shows the effects of dialysis of vehicle solution (filled circles; n = 6) and 5 mM SB-334867 (open circles; n = 6) into the RTN on ventilation while the rats were breathing air and 7% CO2 during wakefulness. Mean ± SEM values are shown. The −30% effect is significant comparing vehicle to SB-334867 treatment during 7% CO2 breathing (P < 0.01 post hoc comparison). This composite is modified from Fig. 1 in Nattie (166) and used with permission (top panel), Fig 3 from Respiration Physiology& Neurobiology, 164, Kuwacki, Orexinergic modulation of breathing across vigilance states, 204–212, 2008, (127) and used with permission of Elsevier (bottom left panel), Fig. 2 from Respiration Physiology & Neurobiology, 170, Dias et al., The orexin receptor 1 (OX1R) in the rostral medullary raphe contributes to the hypercapnic chemoreflex in wakefulness, during the active period of the diurnal cycle, 96–102, 2010, (46) and used with permission of Elsevier (bottom right panel), and Fig. 2 in Dias et al., (47) J. Physiol. used with permission, John Wiley and Sons (bottom middle panel).
Figure 13
Figure 13. Lesions of noradrenergic neurons of the locus ceruleus decrease the CO2 response
The relationship between pulmonary ventilation (VE) and the arterial partial pressure of CO2 (PaCO2) of sham and rats treated with 6-OHDA induced lesions (>50%) of noradrenergic neurons of the locus ceruleus exposed to normocapnia (0% CO2) and hypercapnia (7% CO2). The overall effect was a 64% reduction in the CO2 response. With kind permission from Springer Science and Business Media: Pflügers Archiv, Locus coeruleus noradrenergic neurons and CO2 drive to breathing, 455, 2008, pp. 1119–28, Biancardi, V., Bicego, K. C., Almeida, M. C., and Gargaglioni, L. H Fig. 3. (18).
Figure 14
Figure 14. The relationship of alveolar ventilation and PCO2
The arterial partial pressure of CO2 (PaCO2) in mm Hg is shown as a function of alveolar ventilation relative to a ‘normal’ value (that associated with PaCO2 = 40 mm Hg) of 1.0 and multiples thereof. A constant and normal metabolic rate is assumed. The insert magnifies the central region of the plot. As alveolar ventilation increases, PaCO2 decreases, and vice versa. A 10% change in alveolar ventilation is associated with a 4 mm Hg change in PaCO2.
Figure 15
Figure 15. Breathing responses to low levels of inspired CO2
Responses of VE, VT, and f to 0 – 7.6% CO2 in 8 awake, unrestrained rats. Note that the response at low inspired CO2 levels is substantial such that PaCO2 is unchanged, i.e. PaCO2 regulation is “perfect”. Lai et al., J. Appl. Physiol. 1978, (130) used with permission.
Figure 16
Figure 16. Interdependent response to simultaneous focal acidification of medullary raphe and RTN
Ventilatory response, expressed as % baseline, to focal acidification of: (A) the retrotrapezoid nucleus (RTN) alone (with simultaneous acidification of sites lying outside the raphe obscurus (ROb)), (B) the ROb alone (with simultaneous acidification of the sites lying outside the RTN), and (A + B) both the RTN and the ROb simultaneously. Asterisk at far right of A and of A + B indicates a significant (P < 0.01) increase as determined by repeated-measures ANOVA on the absolute values for ventilation. Asterisks at individual time periods indicate a significant (P < 0.05) difference from baseline as determined by post hoc comparison with Dunnett’s test. Modified from Figs. 3, 4, and 5 in Dias et al., J. Appl. Physiol. 2008, (45) and used with permission.
Figure 17
Figure 17. Chemoreception in wakefulness
A schematic model for central chemoreception in wakefulness that represents our current working hypothesis. The areas in red represent sites at which focal acidification by dialysis with aCSF equilibrated with high CO2 produced an increase in ventilation in wakefulness. The areas in gray represent sites at which we anticipate a response to focal acidification in wakefulness. Solid lines show established functional connections related to chemoreception, e.g., dialysis of an OX1R antagonist at the RTN decreased the CO2 response in wakefulness. Dotted lines show likely connections that remain to be established. That linking the caudal MR to the PBC reflects observations obtained in a slice preparation. The red line between the caudal MR and the RTN reflects a CO2 linked connection, i.e., focal acidification of the caudal MR enhances the response to focal acidification of the RTN. Abbreviations are: LH, a designation that includes orexin neurons in lateral hypothalamus, dorsomedial hypothalamus and perifornical area; LC, locus ceruleus; CB, carotid body; NTS, nucleus tractus solitarius; PBC, pre-Bötzinger complex; RTN, retrotrapezoid nucleus; MR, medullary raphe; VLM, ventrolateral medulla. Nattie & Li, (169) J. Appl. Physiol. 2010, used with permission.
Figure 18
Figure 18. Chemoreception in NREM sleep
A schematic model for central chemoreception in NREM (non-rapid eye movement) sleep that represents our current working hypothesis. The symbols and lines are as in Figure 17. Nattie & Li, (169) J. Appl. Physiol. 2010, used with permission.

References

    1. Abbott SB, Stornetta RL, Fortuna MG, Depuy SD, West GH, Harris TE, Guyenet PG. Photostimulation of retrotrapezoid nucleus phox2b expressing neurons in vivo produces long-lasting activation of breathing in rats. J Neurosci. 2009;29:5806–5819. - PMC - PubMed
    1. Adamantidis AR, Zhang F, Aravanis AM, Deisseroth K, de Lecea L. Neural substrates of awakening probed with optogenetic control of hypocretin neurons. Nature. 2007;450:420–424. - PMC - PubMed
    1. Ainslie PN, Duffin J. Integration of cerebrovascular CO2 reactivity and chemoreflex control of breathing: Mechanisms of regulation, measurement, and interpretation. Am J Physiol. 2009;296:R1473–R1495. - PubMed
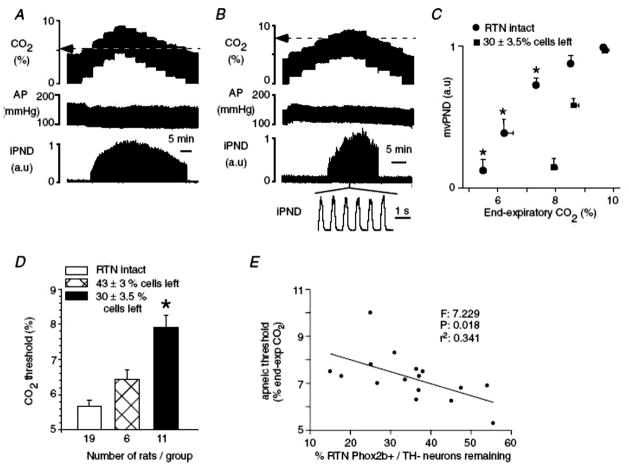
    1. Akilesh MR, Kamper M, Li A, Nattie EE. Effects of unilateral lesions of retrotrapezoid nucleus on breathing in awake rats. J Appl Physiol. 1997;82:469–479. - PubMed
    1. Amiel J, Dubreuil V, Ramanantsoa N, Fortin G, Gallego J, Brunet JF, Goridis C. PHOX2B in respiratory control: Lessons from congenital central hypoventilation syndrome and its mousemodels. Respir Physiol Neurobiol. 2009;168:125–132. - PubMed

Publication types

LinkOut - more resources