. 2012 Sep 21;337(6101):1553-6.
doi: 10.1126/science.1220961. Epub 2012 Aug 23.

Acute gastrointestinal infection induces long-lived microbiota-specific T cell responses

Affiliations

Acute gastrointestinal infection induces long-lived microbiota-specific T cell responses

Timothy W Hand et al. Science. .

Abstract

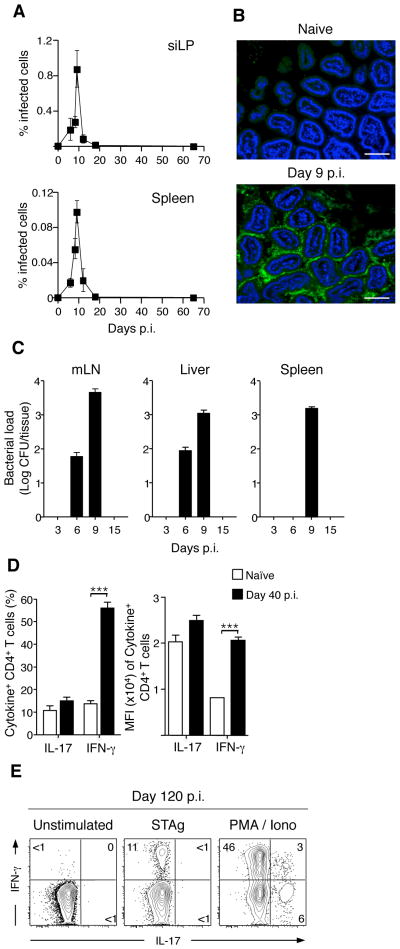
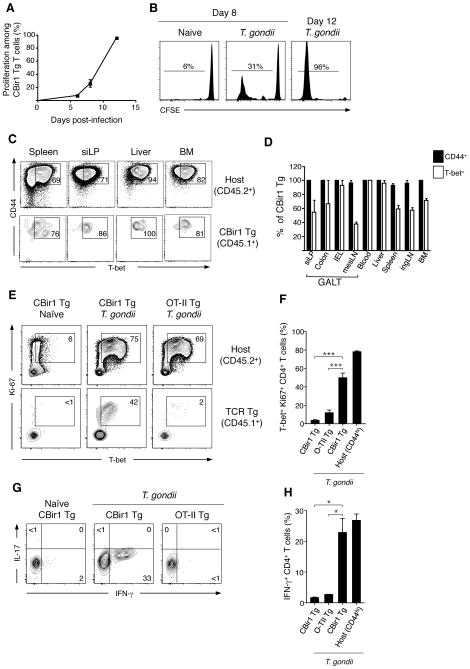
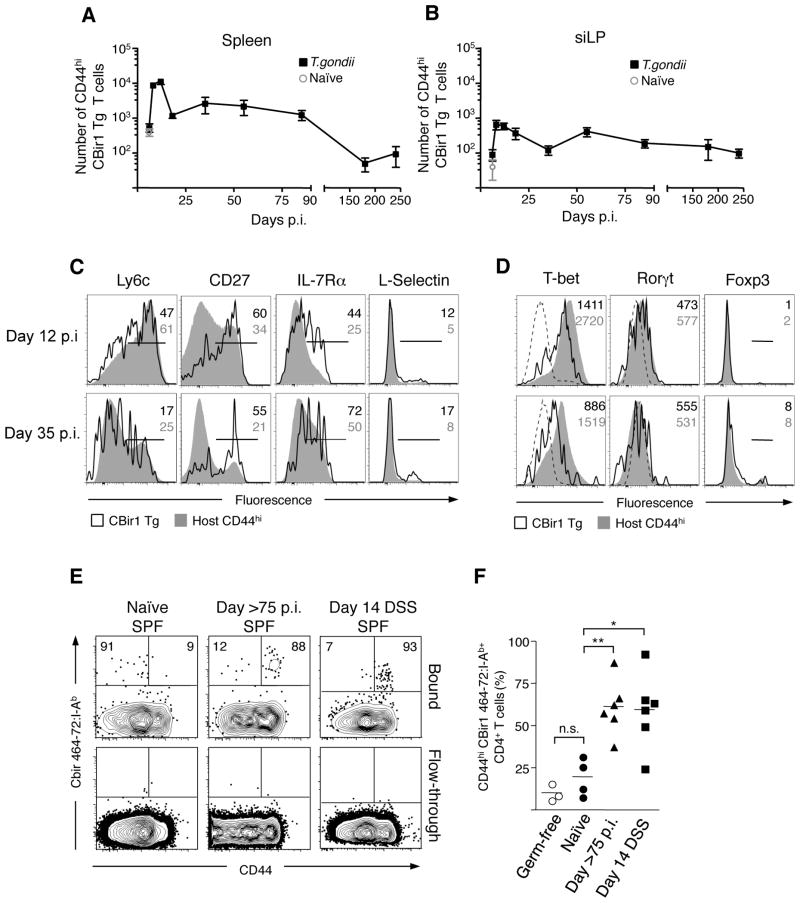
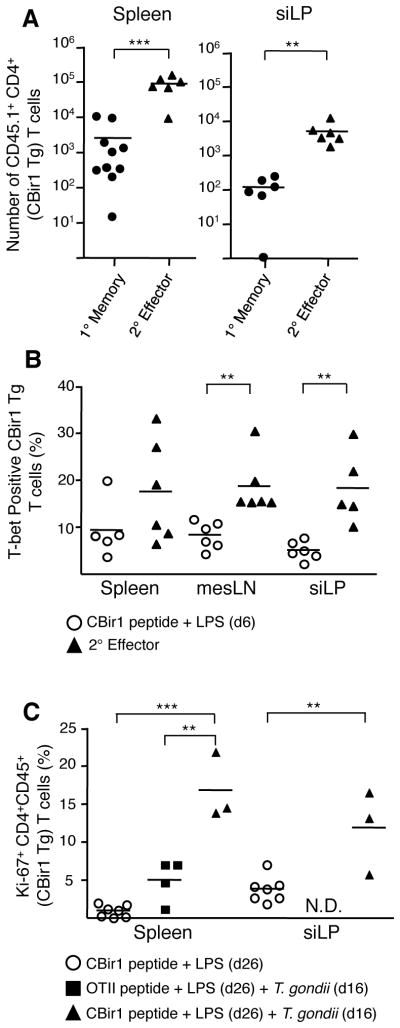
The mammalian gastrointestinal tract contains a large and diverse population of commensal bacteria and is also one of the primary sites of exposure to pathogens. How the immune system perceives commensals in the context of mucosal infection is unclear. Here, we show that during a gastrointestinal infection, tolerance to commensals is lost, and microbiota-specific T cells are activated and differentiate to inflammatory effector cells. Furthermore, these T cells go on to form memory cells that are phenotypically and functionally consistent with pathogen-specific T cells. Our results suggest that during a gastrointestinal infection, the immune response to commensals parallels the immune response against pathogenic microbes and that adaptive responses against commensals are an integral component of mucosal immunity.


Conflict of interest statement

The authors declare that they have no conflict of interest.

Figures

Figure 1
Figure 1. T. gondii infection leads to transient bacterial translocation but persistent lamina propria Th1 T cell responses
(A) C57Bl/6 mice were infected orally with 15 cysts of RFP-expressing T. gondii. At the times indicated p.i., siLP and spleen were isolated and the percent of cells infected measured via flow cytometric analysis of RFP+ cells; N=1–8, n=3–15 mice per timepoint. (B) Small intestinal samples were isolated from naïve and day 9 T. gondii infected mice. Intestinal samples were then fixed, sectioned, counter-stained with DAPI and hybridized for FISH with a fluorescent probe specific to eubacterial 16S chromosomal sequences. Scale bar indicates 25 μM; N=7 (C) Counts of bacterial colonies cultured from spleen, mesenteric LN (mesLN) and liver at time points indicated post T. gondii infection; N=3, n=3–4 mice per timepoint. (D) Lymphocytes were prepared from the siLP of naïve or day 40 infected mice, stimulated with PMA/ionomycin and stained intracellularly for IFN-γ and IL-17. Bar graph shows the percent (Left) or the Mean Fluorescence Intensity (Right) of CD4+ cells expressing IFN-γ or IL-17. Shown is a representative example of three separate experiments; n=4–6 mice per experiment. (E) CD4 T cells were purified from the siLP by flow cytometry and co-cultured with bone-marrow derived DCs pre-loaded with Soluble T. gondii Antigen (STAg) or activated with PMA/ionomycin for 3.5 hours. Stimulated cells were stained intracellularly for IFN-γ and IL-17 and analyzed by flow cytometry. Shown is one of two experiments. Flow cytometry of CD4 cells is gated Live TCRβ+ CD4+ Foxp3. Graphs show mean +/− SEM. ***p<0.001.
Figure 2
Figure 2. Gastrointestinal infection leads to the activation and Th1 differentiation of microbiota-specific T cells
(A and B) 105 CBir1 Tg (CD45.1) T cells were labeled with CFSE and transferred into congenic (CD45.2) hosts that were subsequently infected orally with 15 cysts of T. gondii. At 6, 8 or 12 days p.i. splenocytes were isolated and the dilution of CFSE on CBir1 Tg T cells (Live TCRβ+ CD4+ CD45.1+) assessed by flow cytometry; N=1, n=3–4 mice per time point. (C) 7.5×10⁴ CBir1 Tg (CD45.1) T cells were transferred into congenic (CD45.2) hosts that were subsequently infected orally with 15 cysts of T. gondii. Eighteen days p.i., single cell suspensions were prepared from the spleen, ingLN, mesLN, bone marrow, liver, peripheral blood, siLP, IEL and colon and stained intracellularly for flow cytometry. Contour plots show expression of CD44 and T-bet amongst CBir1 Tg (CD45.1) CD4 T cells (bottom row) and host CD4+ T cells (D) Bar graph showing the frequency of CBir1 Tg T cells from (C) expressing CD44 (black bars) and Tbet (white bars); N=1–8, n=3 mice. (E) 7.5×10⁴ CBir1 Tg (CD45.1) or OTII T cells were transferred into congenic (CD45.2) hosts that were subsequently infected orally with 15 cysts of T. gondii or left naïve. Eight days p.i. splenocytes were isolated and stained intracellularly for flow cytometry. Flow cytometric analysis of T-bet and Ki67 in CBir1 Tg or OTII TCR Tg (bottom row) and host CD44hi CD4 T cells (top row). Shown is a representative example of eight separate experiments. (F) Quantification of (E). (G) Splenocytes from (E) were stimulated with PMA/ionomycin, stained intracellularly for IFN-γ and IL-17 and analyzed by flow cytometry. (H) Quantification of (G). Data is representative of three separate experiments. All flow cytometry plots in this figure are gated on Live TCRβ+ CD4+ Foxp3. Graphs show mean +/- SEM *p<0.05, ***p<0.001.
Figure 3
Figure 3. Gastrointestinal infection induces microbiota-specific memory CD4 T cells
(A and B) 7.5×10⁴ CBir1 Tg (CD45.1) T cells were transferred into congenic (CD45.2) hosts that were subsequently infected orally with 15 cysts of T. gondii. At the days indicated, splenocytes (A) and siLP cells (B) were isolated and the number of CD44hi CBir1 Tg T cells (black squares) in each tissue was assessed by flow cytometry. Open grey circle shows the number of CD44hi CBir1 Tg T cells in naïve mice eight days after transfer of CBir1 Tg T cells; N=1–8, n=3–15 mice per timepoint (C) Flow cytometric analysis of surface marker phenotype of transferred CBir1 Tg T cells (CD45.1) (black line) and host CD44hi T cells (CD45.2) (grey filled) at day 12 and day 35 p.i. isolated from the spleen (D) Expression of transcription factors in CBir1 Tg T cells (CD45.1) (black line) and host CD44hi T cells (CD45.2) (grey filled) at day 12 and day 35 p.i. isolated from the spleen. Histograms in (C) and (D) are gated on Live TCRβ+ CD4+; Data shown is representative of three separate experiments (E) Flow cytometric analysis of CBir464- 72:I-Ab tetramer binding populations from the total secondary lymphoid tissue in naïve, >day 75 T. gondii infected and DSS-treated mice. The top row depicts the population bound during tetramer-specific separation; the bottom row shows the non-binding column flow-through to show specificity. Plots are gated on DAPI NK1.1 F4/80 CD11c CD11b B220 CD3+ CD4+. (F) Bar graph shows the percent CD44hi of CBir464–72:I-Ab tetramer binding cells in germ-free (open circles), naïve (circles), infected (triangles) and DSS-treated (squares) mice. Data from (E) are representative of three experiments. Graphs show mean +/− SEM *p<0.05, **p<0.01.
Figure 4
Figure 4. Microbiota-specific memory T cell are functional and can be re-activated by gastrointestinal infection
(A) 7.5×10⁴ CBir1 Tg (CD45.1) T cells were transferred into congenic (CD45.2) hosts that were subsequently infected orally with 15 cysts of T. gondii. 35 days p.i. with T. gondii mice carrying CBir1 Tg T cells were injected with CBir1 peptide and LPS. Numbers of CBir1 Tg T cells (CD45.1) in the spleen and siLP at day 35 (1° memory) or six days post stimulation with CBir peptide and LPS (2° effector). Shown is a composite of three experiments. (B) Either naïve hosts carrying ~104 naïve CBir1 Tg T cells (open circles) or day 35 (1° memory) T. gondii infected mice (black triangles) were injected with CBir peptide and LPS as in (A). Six days post-injection splenocytes were isolated and stained intracellularly for T-bet. Data shown is representative of three experiments. (C) Naïve hosts carrying ~104 naïve CBir1 Tg or OTII Tg T cells were injected with peptide and LPS. Ten days post-immunization these mice were infected with 15 cysts T. gondii. Percent Ki67+ CBir1 Tg T cells isolated from the spleen and siLP from mice 16 days post-infection (26 days post-immunization). Data shown are representative of 3 separate experiments. CBir1 Tg T cells are gated Live TCRβ+ CD4+ Foxp3 CD45.1+. Graphs show mean +/− SEM **p<0.01, ***p<0.001.

References

    1. Kau AL, Ahern PP, Griffin NW, Goodman AL, Gordon JI. Nature. Jun 16;474:327. - PMC - PubMed
    1. Qin J, et al. Nature. Mar 4;464:59. - PubMed
    1. Iwasaki A, Medzhitov R. Nat Immunol. 2004 Oct;5:987. - PubMed
    1. Macpherson AJ, Slack E, Geuking MB, McCoy KD. Semin Immunopathol. 2009 Jul;31:145. - PubMed
    1. Macpherson AJ, Uhr T. Science. 2004 Mar 12;303:1662. - PubMed

Publication types

MeSH terms