. 2012 Feb;4(2):151-61.
doi: 10.2217/imt.11.163.

Modulating intestinal immune responses by lipoteichoic acid-deficient Lactobacillus acidophilus

Affiliations

Modulating intestinal immune responses by lipoteichoic acid-deficient Lactobacillus acidophilus

Mohammad W Khan et al. Immunotherapy. 2012 Feb.

Abstract

Aim: To investigate the mechanism(s) by which the intestinal commensal microbe Lactobacillus acidophilus can affect host immunity, we studied the role of a component of the cell wall, lipoteichoic acid, in colitis.

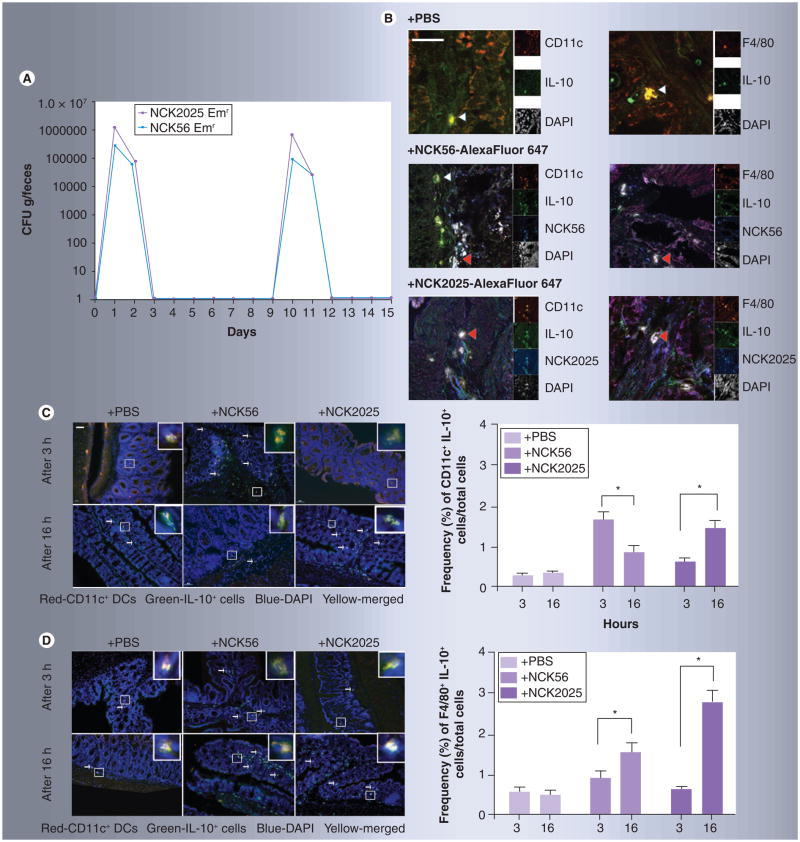
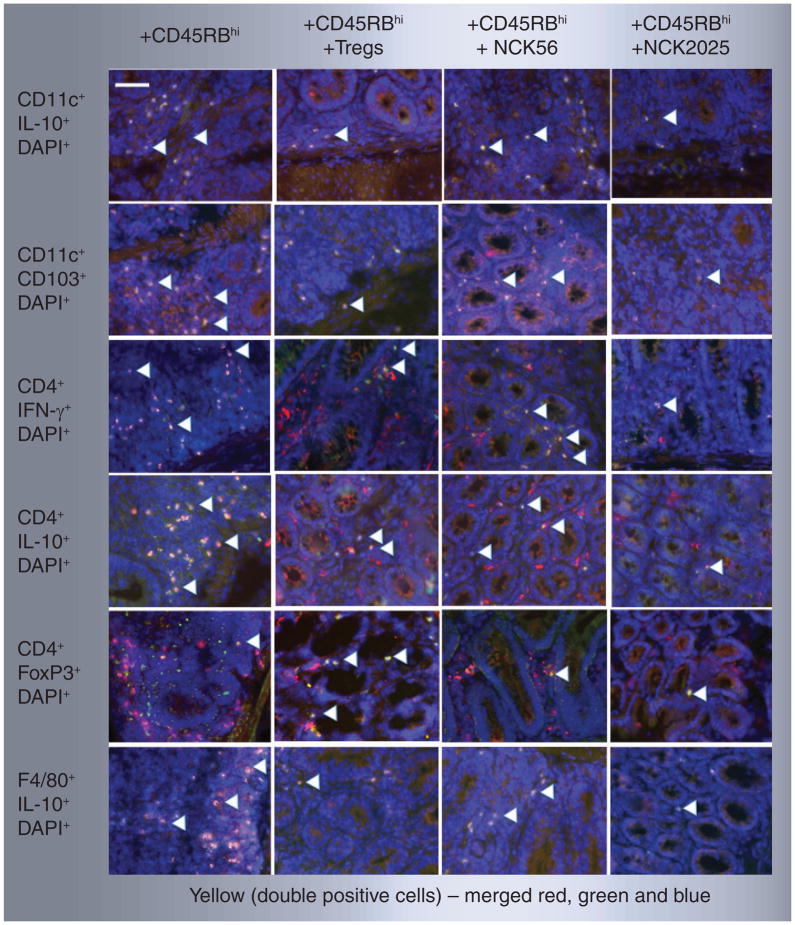
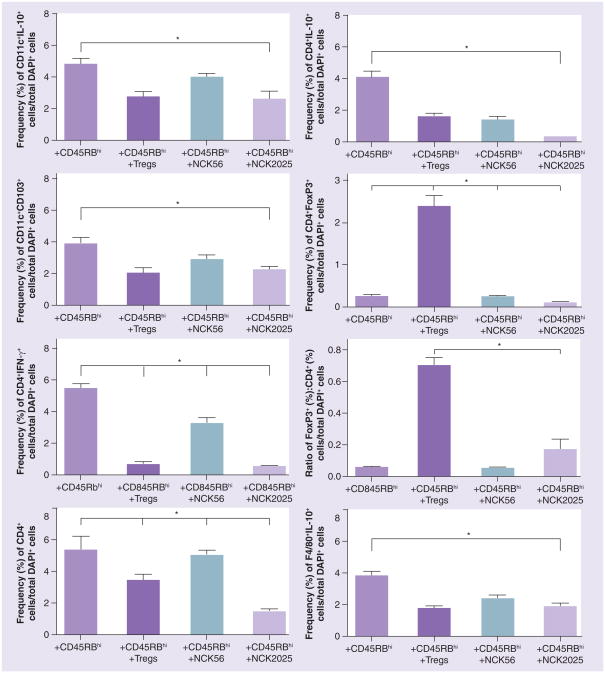
Materials & methods: Colitis was induced by the intraperitoneal injection of pathogenic CD4(+)CD25(-)CD45RB(hi) T cells into Rag1(-/-) mice. The parental strain, NCK56, or the lipoteichoic acid-deficient strain, NCK2025, was then administered orally. Fluorescent microscopy was employed to examine resulting cell populations and their cytokine production in the colon.

Results: NCK2025 enhanced IL-10 production by dendritic cells and macrophages. Increased numbers of regulatory dendritic cells coincided with the induction of activated FoxP3(+) Tregs.

Conclusion: These results suggest that the oral administration of the genetically modified strain NCK2025 may be an effective immunotherapeutic approach that reprograms the immune response in colonic inflammatory conditions.


Figures

Figure 1
Figure 1. Transient colonization of the gut and bacterial uptake by colonic dendritic cells and macrophages
(A) Groups of mice (n = 3) were orally treated with Emr NCK56 or NCK2025 cells (5 × 10⁸ CFU/100 μl per mouse). Fecal pellets were collected before, during and for up to 8 days after bacterial oral treatments, and dissolved in 10% de Man, Rogosa and Sharpe broth (MRS). The homogenized materials were serially diluted and plated onto MRS agar containing erythromycin (2 μg/ml). The daily average number of CFU of either Lactobacillus acidophilus strain in mouse feces was determined. Data are representative of at least three independent experiments. (B) Confocal microscopy images of colons from mice treated with PBS and NCK56 or NCK2025 cells. NCK56 or NCK2025 cells were labeled with AlexaFluor 647 (blue). 5-μm sections were stained with an anti-IL-10 antibody (green), and for DCs (anti-CD11c, red) or macrophages (anti-F4/80, red). Magnification ×630 (white scale bar represents 50 μm). The main images are the merge of three channels (red, green and blue). The double-positive cells are yellow (indicated by white arrowheads) and the triple-positive cells are white (indicated by red arrowheads). On the right of the main images are thumbnails of the single-color images, as well as the DAPI image in gray. (C & D) AlexaFluor 647-labeled NCK56- or NCK2025-treated and untreated (PBS) mouse colons were stained with CD11c or F4/80 (red cells) and IL-10 (green cells) antibodies and visualized by TissueGnostics® Tissue/Cell High-Throughput Imaging and Analysis System. (C) Representation and quantification of IL-10 production by CD11c+ DCs at 3 and 16 h following PBS, NCK56 or NCK2025 treatment. (D) Representation and quantification of IL-10 production by F4/80+ macrophages at 3 and 16 h following PBS, NCK56 or NCK2025 treatment. Data were statistically analyzed by one-way ANOVA. *p < 0.05 indicates significance of the data between the study groups. DAPI: 4,6-diamidino-2-phenylindole dihydrochloride; DC: Dendritic cell; Emr: Erythromycin resistant; PBS: Phosphate buffered saline.
Figure 2
Figure 2. Regulation of colonic dendritic cells and macrophages by NCK2025 cells
(A–D) PBS-, NCK56- or NCK2025-treated mouse colons were stained with CD11c, F4/80, TNF-α, IL-12 or IL-10 antibodies and visualized by TissueGnostics® Tissue/Cell High-Throughput Imaging and Analysis System. This shows the quantification of the frequencies of (A) CD11c+IL-10+ dendritic cells (DCs), (B) CD11c+TNF-α+ DCs, (C) CD11c+IL-12+ DCs and (D) F4/80+IL-10+ macrophages in the colons of mice treated with PBS, NCK56 or NCK2025 at days 1, 3 and 7. Data were statistically analyzed by one-way ANOVA. *p < 0.05 indicates significance of the data between the study groups. DAPI: 4,6-diamidino-2-phenylindole dihydrochloride; PBS: Phosphate buffered saline.
Figure 3
Figure 3. Regulation of colonic T cells by NCK2025
(A–C) PBS-, NCK56- or NCK2025-treated mouse colons were stained with CD4, FoxP3, IL-10 or IFN-γ antibodies and visualized by TissueGnostics® Tissue/Cell High-Throughput Imaging and Analysis System. Figure shows quantification of the frequencies of (A) FoxP3+IL-10+ T cells, (B) CD4+IL-10+ T cells and (C) CD4+IFN-γ+ T cells in the colons of mice treated with PBS, NCK56 or NCK2025 at days 1, 3, and 7. Data were statistically analyzed by one-way ANOVA. *p < 0.05 indicates significance of the data between the study groups. DAPI: 4,6-diamidino-2-phenylindole dihydrochloride; PBS: Phosphate buffered saline.
Figure 4
Figure 4. Regulation of pathogenic CD4+CD45RBhi T cells in Rag1−/− mice by NCK2025
(A & B) Colons from Rag1−/− mice receiving pathogenic CD4+ T cells along with phosphate buffered saline, Tregs, NCK56 or NCK2025 treatment were stained with CD11c (red cells) antibodies and TNF-α or IL-12 (green cells) antibodies and visualized by TissueGnostics® Tissue/Cell High-Throughput Imaging and Analysis System. The figure shows the representation and quantification of (A) CD11c+TNF-α+ and (B) CD11c+IL-12+ dendritic cells. Data were statistically analyzed by one-way ANOVA. *p < 0.05 indicates significance of the data between the study groups. White scale bar represents 50 μm. Colocalized double-positive cells are yellow, as indicated by white arrowheads. DAPI: 4,6-diamidino-2-phenylindole dihydrochloride.
Figure 5
Figure 5. Immuneregulation of pathogenic CD4+CD45RBhi T cells by NCK2025
Colons from Rag1−/− mice receiving pathogenic CD4+ T cells along with PBS, Tregs, NCK56 or NCK2025 treatment were stained with CD11c, CD4, F4/80 (red cells) antibodies, IL-10, CD103, IFN-γ or FoxP3 (green cells) antibodies and visualized by TissueGnostics® Tissue/Cell High-Throughput Imaging and Analysis System. The figure depicts representative pictures. The white scale bar represents 50 μm, colocalized double-positive cells are yellow indicated by white arrowheads. DAPI: 4,6-diamidino-2-phenylindole dihydrochloride.
Figure 6
Figure 6. Regulation of pathogenic CD4+CD45RBhi T cells in vivo by NCK2025
Quantification of the frequencies of CD11c+IL-10+, CD11c+CD103+, CD4+IFN-γ+, CD4+IL-10+ and CD4+FoxP3+ cells; ratio (%) of Foxp3: CD4+ T cells; and F4/80+IL-10+ cells in colons of Rag1−/− mice (n = 5/group) treated with phosphate buffered saline, NCK56 or NCK2025. Data were statistically analyzed by one-way ANOVA. *p < 0.05 indicates the significance of the data between the study groups.

References

    1. Mowat AM. Anatomical basis of tolerance and immunity to intestinal antigens. Nat Rev Immunol. 2003;3(4):331–341. - PubMed
    1. MacDonald TT, Gordon JN. Bacterial regulation of intestinal immune responses. Gastroenterol Clin North Am. 2005;34(3):401–412. VII–VIII. - PubMed
    1. Neurath MF, Fuss I, Kelsall BL, et al. Experimental granulomatous colitis in mice is abrogated by induction of TGF-β-mediated oral tolerance. J Exp Med. 1996;183(6):2605–2616. - PMC - PubMed
    1. Xavier RJ, Podolsky DK. Unravelling the pathogenesis of inflammatory bowel disease. Nature. 2007;448(7152):427–434. - PubMed
    1. Baumgart DC, Carding SR. Inflammatory bowel disease: cause and immunobiology. Lancet. 2007;369(9573):1627–1640. - PubMed

Publication types

MeSH terms