. 2012 Feb 28;109(9):E535-43.
doi: 10.1073/pnas.1112839109. Epub 2012 Feb 14.

Long-term perspective on wildfires in the western USA

Affiliations

Long-term perspective on wildfires in the western USA

Jennifer R Marlon et al. Proc Natl Acad Sci U S A. .

Abstract

Understanding the causes and consequences of wildfires in forests of the western United States requires integrated information about fire, climate changes, and human activity on multiple temporal scales. We use sedimentary charcoal accumulation rates to construct long-term variations in fire during the past 3,000 y in the American West and compare this record to independent fire-history data from historical records and fire scars. There has been a slight decline in burning over the past 3,000 y, with the lowest levels attained during the 20th century and during the Little Ice Age (LIA, ca. 1400-1700 CE [Common Era]). Prominent peaks in forest fires occurred during the Medieval Climate Anomaly (ca. 950-1250 CE) and during the 1800s. Analysis of climate reconstructions beginning from 500 CE and population data show that temperature and drought predict changes in biomass burning up to the late 1800s CE. Since the late 1800s , human activities and the ecological effects of recent high fire activity caused a large, abrupt decline in burning similar to the LIA fire decline. Consequently, there is now a forest "fire deficit" in the western United States attributable to the combined effects of human activities, ecological, and climate changes. Large fires in the late 20th and 21st century fires have begun to address the fire deficit, but it is continuing to grow.


Conflict of interest statement

The authors declare no conflict of interest.

Figures

Fig. 1.
Fig. 1.
(A) The geographic distribution of fire-scar (green triangles) records and charcoal-based fire-history records (influx and peak frequency records are blue, influx-only records are purple) in the western United States on a base map of tree cover (84); (B) The latitudinal distribution of dendrochronological sites recording fire scars for the past 1,000 y. A site is gray when it is recording fire, and a red tick mark indicates a fire scar (URL: http://www.ncdc.noaa.gov/paleo/impd/paleofire.html); isolated gray tick marks at the beginning of each record indicate the beginnings of individual tree records. (C) Anomalies of charcoal influx over the past 1,000 y from 69 sites in the western United States arranged latitudinally from north (top) to south (bottom). Each row represents a study site. Blue dots indicate less burning than average; red dots indicate more burning than average. Spacing of the dots reflects the sampling resolution and sedimentation rate of the record.
Fig. 2.
Fig. 2.
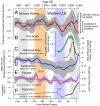
(A) Estimated historical saw timber affected by fires (48). (B) Smoothed proportions of dendrochronological sites recording fire scars (the green curve is based on locally fitting nearest-neighbor parameter of 0.25, while the gray curve is based on a parameter value of 0.10. (C) Smoothed and standardized 25-year (gray) and 100-year (red) trend line through standardized biomass burning records (n = 69) along with predicted biomass burning based on a GAM (black dashed line) fit to the 100-year biomass burning records. (D) Smoothed peak density (inferred fire frequency) from charcoal values (n = 41). (E) Smoothed gridded temperature anomalies for the western United States (10). (F) Smoothed Palmer Drought Severity Index for the western United States (9) . (G) Population estimates for the western United States (11). All smoothed curves are plotted with 95% bootstrap confidence intervals.
Fig. 3.
Fig. 3.
Relative changes in biomass burning in the western United States for the past 3,000 y based on 69 standardized sedimentary charcoal records. The red line is a lowess curve based on a 200-year window width and the dark gray line is a lowess curve based on a 100-year window. 95% bootstrap confidence intervals are shown as a gray band.
Fig. P1.
Fig. P1.
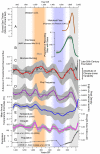
(A) Smoothed and standardized 25-year (gray) and 100-year (red) trend line through standardized biomass burning records (n = 69) along with predicted biomass burning based on a GAM (black dashed line) fit to the 100-year charcoal values. (B) Smoothed proportions of dendrochronological sites recording fire scars. (C) Estimated historical sawtimber affected by lightning- and human-caused fires in the western United States (2) (D) Smoothed gridded temperature anomalies for the western United States (3). (E) Smoothed Palmer Drought Severity Index for the western United States (4). (F) Population estimates for the western United States (5). All smoothed curves are plotted with 95% bootstrap confidence intervals.

References

    1. Westerling AL, Hidalgo HG, Cayan DR, Swetnam TW. Warming and earlier spring increase western US forest wildfire activity. Science. 2006;313:940–943. - PubMed
    1. Miller J, Safford H, Crimmins M, Thode A. Quantitative evidence for increasing forest fire severity in the Sierra Nevada and Southern Cascade Mountains, California and Nevada, USA. Ecosystems. 2009;12:16–32.
    1. Littell JS, McKenzie D, Peterson DL, Westerling AL. Climate and wildfire area burned in western U. S. ecoprovinces, 1916-2003. Ecol Appl. 2009;19:1003–1021. doi: 10.1890/07-1183.1. - DOI - PubMed
    1. Trouet V, Taylor AH, Wahl ER, Skinner CN, Stephens SL. Fire-climate interactions in the American West since 1400 CE. Geophys Res Lett. 2010;37:L04702.
    1. Wiedinmyer C, Neff J. Estimates of CO2 from fires in the United States: implications for carbon management. Carbon Balance and Management. 2007;2 doi: 10.1186/1750-0680-1182-1110. - DOI - PMC - PubMed

Publication types

MeSH terms

LinkOut - more resources