

Argininosuccinate synthase conditions the response to acute and chronic ethanol-induced liver injury in mice
- PMID: 22213272
- PMCID: PMC4632528
- DOI: 10.1002/hep.25543
Argininosuccinate synthase conditions the response to acute and chronic ethanol-induced liver injury in mice
Abstract
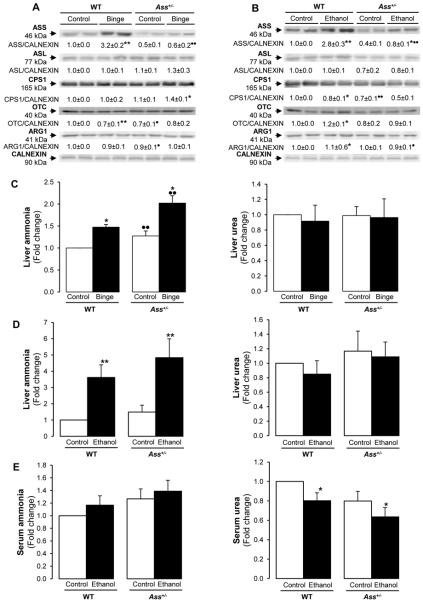
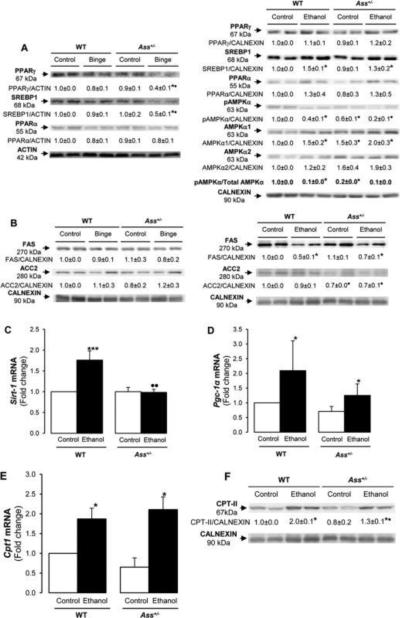
Argininosuccinate synthase (ASS) is the rate-limiting enzyme in both the urea and the L-citrulline/nitric oxide (NO·) cycles regulating protein catabolism, ammonia levels, and NO· generation. Because a proteomics analysis identified ASS and nitric oxide synthase-2 (NOS2) as coinduced in rat hepatocytes by chronic ethanol consumption, which also occurred in alcoholic liver disease (ALD) and in cirrhosis patients, we hypothesized that ASS could play a role in ethanol binge and chronic ethanol-induced liver damage. To investigate the contribution of ASS to the pathophysiology of ALD, wildtype (WT) and Ass(+/-) mice (Ass(-/-) are lethal due to hyperammonemia) were exposed to an ethanol binge or to chronic ethanol drinking. Compared with WT, Ass(+/-) mice given an ethanol binge exhibited decreased steatosis, lower NOS2 induction, and less 3-nitrotyrosine (3-NT) protein residues, indicating that reducing nitrosative stress by way of the L-citrulline/NO· pathway plays a significant role in preventing liver damage. However, chronic ethanol-treated Ass(+/-) mice displayed enhanced liver injury compared with WT mice. This was due to hyperammonemia, lower phosphorylated AMP-activated protein kinase alpha (pAMPKα) to total AMPKα ratio, decreased sirtuin-1 (Sirt-1) and peroxisomal proliferator-activated receptor coactivator-1α (Pgc1α) messenger RNAs (mRNAs), lower fatty acid β-oxidation due to down-regulation of carnitine palmitoyl transferase-II (CPT-II), decreased antioxidant defense, and elevated lipid peroxidation end-products in spite of comparable nitrosative stress but likely reduced NOS3.
Conclusion: Partial Ass ablation protects only in acute ethanol-induced liver injury by decreasing nitrosative stress but not in a more chronic scenario where oxidative stress and impaired fatty acid β-oxidation are key events.
Copyright © 2011 American Association for the Study of Liver Diseases.
Figures
 ) and macrovesicular (
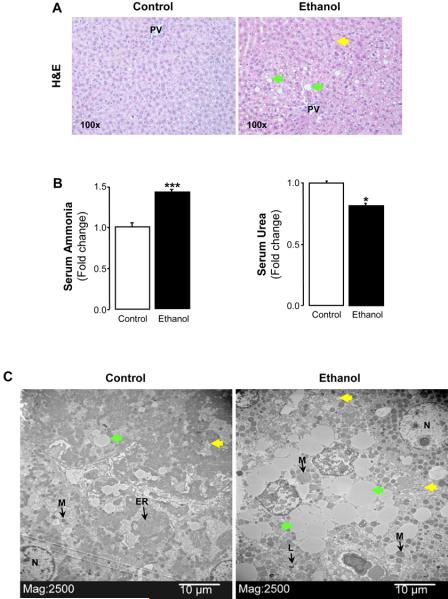
 ) steatosis (A, right. PV: portal vein). Serum ammonia and urea. Results are average values ± SEM. n=10/group; *p<0.05 and ***p<0.001 for chronic ethanol vs control (B). Transmission electron microscopy showing ultrastructural features (micro- (
 ) and macrovesicular steatosis (
 ),
),  ER: endoplasmic reticulum, L: lysosome, M: mitochondria, N: nucleus). Livers from control rats show normal mitochondria, minimal microvesicular steatosis and stacked ER (left), while livers from ethanol-fed rats show greater micro- and macrovesicular steatosis, disrupted ER and dilated mitochondria (right) (C). Western blot analysis for CYP2E1, NOS2, DYNAMIN, HSP70 and ACTIN in HControl and HEthanol. The quantification of the intensity of the signals corrected by that of ACTIN is indicated under the blots. Results are average values ± SEM. n=3/group; **p<0.01 and ***p<0.001 for HEthanol
vs HControl
(D). Tryptic peptides of ASS were identified by mass spectrometry as highlighted in orange in the sequence. The calculation of their abundance ratios is shown in the chromatograms reconstructed from LC/MS-MS data. Red lines are raw spectra, blue lines are smoothed spectra, green lines are the area under the curve used in the ratio calculation and horizontal cyan lines are the background in the spectra. n=5/group (E).
ER: endoplasmic reticulum, L: lysosome, M: mitochondria, N: nucleus). Livers from control rats show normal mitochondria, minimal microvesicular steatosis and stacked ER (left), while livers from ethanol-fed rats show greater micro- and macrovesicular steatosis, disrupted ER and dilated mitochondria (right) (C). Western blot analysis for CYP2E1, NOS2, DYNAMIN, HSP70 and ACTIN in HControl and HEthanol. The quantification of the intensity of the signals corrected by that of ACTIN is indicated under the blots. Results are average values ± SEM. n=3/group; **p<0.01 and ***p<0.001 for HEthanol
vs HControl
(D). Tryptic peptides of ASS were identified by mass spectrometry as highlighted in orange in the sequence. The calculation of their abundance ratios is shown in the chromatograms reconstructed from LC/MS-MS data. Red lines are raw spectra, blue lines are smoothed spectra, green lines are the area under the curve used in the ratio calculation and horizontal cyan lines are the background in the spectra. n=5/group (E).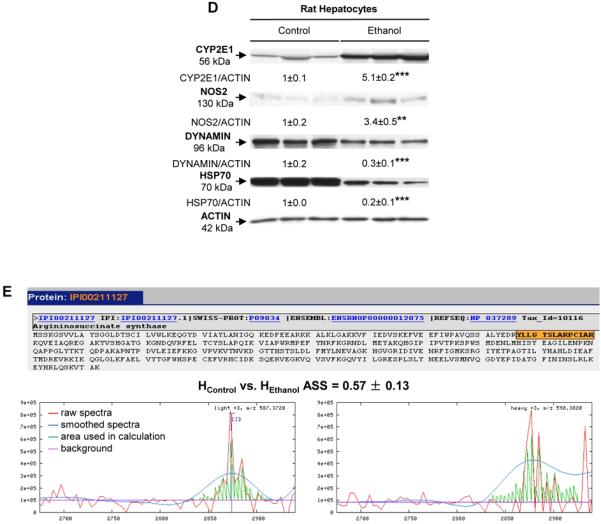 ) and macrovesicular () steatosis (A, right. PV: portal vein). Serum ammonia and urea. Results are average values ± SEM. n=10/group; *p<0.05 and ***p<0.001 for chronic ethanol vs control (B). Transmission electron microscopy showing ultrastructural features (micro- () and macrovesicular steatosis (), ER: endoplasmic reticulum, L: lysosome, M: mitochondria, N: nucleus). Livers from control rats show normal mitochondria, minimal microvesicular steatosis and stacked ER (left), while livers from ethanol-fed rats show greater micro- and macrovesicular steatosis, disrupted ER and dilated mitochondria (right) (C). Western blot analysis for CYP2E1, NOS2, DYNAMIN, HSP70 and ACTIN in HControl and HEthanol. The quantification of the intensity of the signals corrected by that of ACTIN is indicated under the blots. Results are average values ± SEM. n=3/group; **p<0.01 and ***p<0.001 for HEthanol
vs HControl
(D). Tryptic peptides of ASS were identified by mass spectrometry as highlighted in orange in the sequence. The calculation of their abundance ratios is shown in the chromatograms reconstructed from LC/MS-MS data. Red lines are raw spectra, blue lines are smoothed spectra, green lines are the area under the curve used in the ratio calculation and horizontal cyan lines are the background in the spectra. n=5/group (E).
) and macrovesicular () steatosis (A, right. PV: portal vein). Serum ammonia and urea. Results are average values ± SEM. n=10/group; *p<0.05 and ***p<0.001 for chronic ethanol vs control (B). Transmission electron microscopy showing ultrastructural features (micro- () and macrovesicular steatosis (), ER: endoplasmic reticulum, L: lysosome, M: mitochondria, N: nucleus). Livers from control rats show normal mitochondria, minimal microvesicular steatosis and stacked ER (left), while livers from ethanol-fed rats show greater micro- and macrovesicular steatosis, disrupted ER and dilated mitochondria (right) (C). Western blot analysis for CYP2E1, NOS2, DYNAMIN, HSP70 and ACTIN in HControl and HEthanol. The quantification of the intensity of the signals corrected by that of ACTIN is indicated under the blots. Results are average values ± SEM. n=3/group; **p<0.01 and ***p<0.001 for HEthanol
vs HControl
(D). Tryptic peptides of ASS were identified by mass spectrometry as highlighted in orange in the sequence. The calculation of their abundance ratios is shown in the chromatograms reconstructed from LC/MS-MS data. Red lines are raw spectra, blue lines are smoothed spectra, green lines are the area under the curve used in the ratio calculation and horizontal cyan lines are the background in the spectra. n=5/group (E).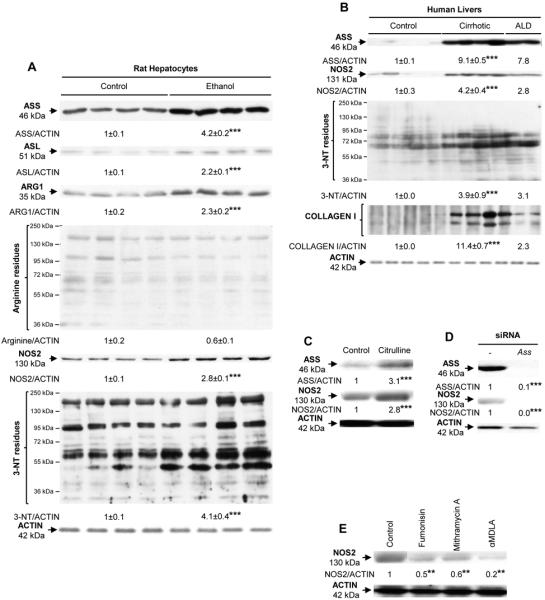
 ) and macrovesicular (
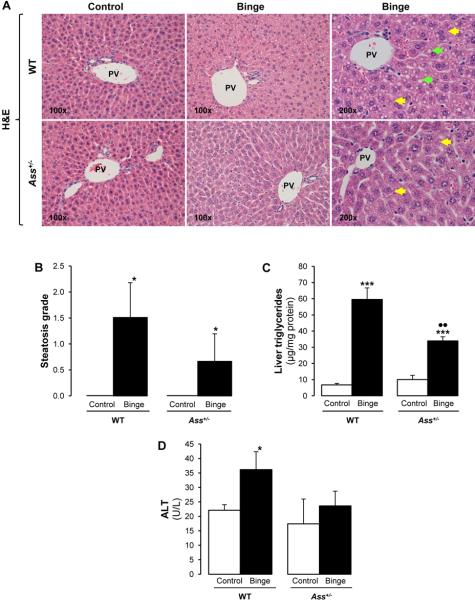
 ) steatosis in binged WT compared with Ass+/− mice (A). Steatosis grade (B), liver triglycerides (C) and ALT activity (D). The ethanol Lieber-DeCarli diet caused more inflammation (
 ), micro- (
 ) and macrovesicular (
 ) steatosis in Ass+/− than in WT mice as shown by the H&E staining (E). The scores for inflammation, necrosis, ductular reaction and steatosis are shown in (F). PV: portal vein. Results are average values ± SEM. n=8/group; *p<0.05 and ***p<0.001 for binge or chronic ethanol vs control; •p<0.05 and ••p<0.01 for Ass+/− vs WT.
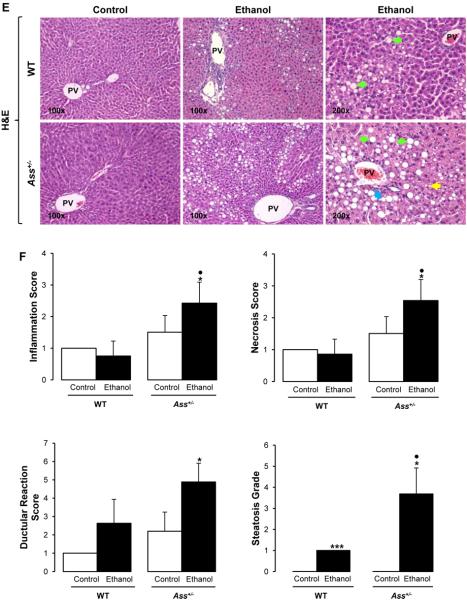 ) and macrovesicular () steatosis in binged WT compared with Ass+/− mice (A). Steatosis grade (B), liver triglycerides (C) and ALT activity (D). The ethanol Lieber-DeCarli diet caused more inflammation (), micro- () and macrovesicular () steatosis in Ass+/− than in WT mice as shown by the H&E staining (E). The scores for inflammation, necrosis, ductular reaction and steatosis are shown in (F). PV: portal vein. Results are average values ± SEM. n=8/group; *p<0.05 and ***p<0.001 for binge or chronic ethanol vs control; •p<0.05 and ••p<0.01 for Ass+/− vs WT.
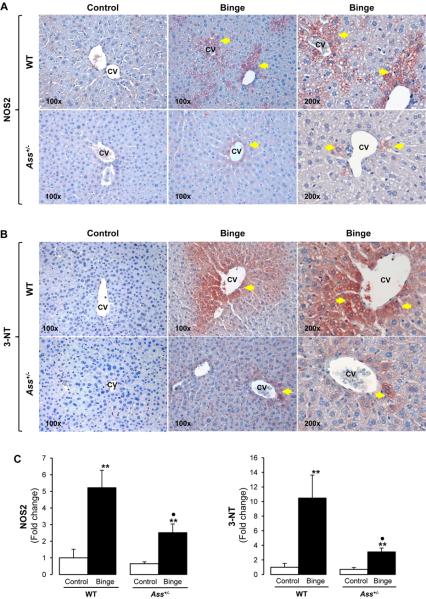
 ) (A) and 3-NT residues (
 ) (B) in binged WT and Ass+/− mice. Morphometry analysis for NOS2 and 3-NT staining (C). IHC and morphometry analysis for NOS2 and 3-NT in chronic ethanol-fed WT and Ass+/− mice (D-F). CV: central vein. Results are average values ± SEM. n=8/group; *p<0.05 and **p<0.01 for binge or chronic ethanol vs control; •p<0.05 for Ass+/− vs WT.
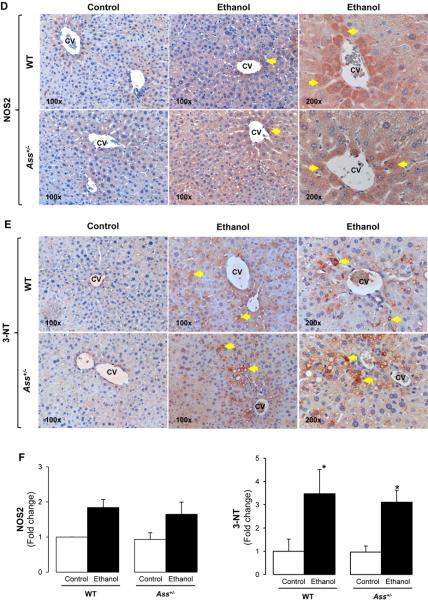 ) (A) and 3-NT residues () (B) in binged WT and Ass+/− mice. Morphometry analysis for NOS2 and 3-NT staining (C). IHC and morphometry analysis for NOS2 and 3-NT in chronic ethanol-fed WT and Ass+/− mice (D-F). CV: central vein. Results are average values ± SEM. n=8/group; *p<0.05 and **p<0.01 for binge or chronic ethanol vs control; •p<0.05 for Ass+/− vs WT.
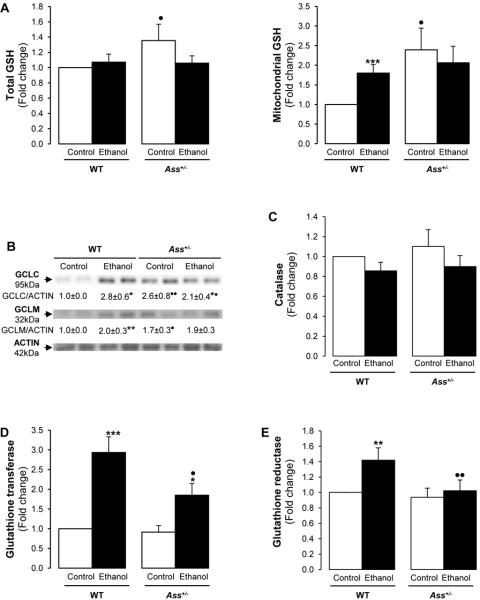
References
-
- Morris SM., Jr. Regulation of enzymes of urea and arginine synthesis. Annu Rev Nutr. 1992;12:81–101. - PubMed
-
- Xie L, Gross SS. Argininosuccinate synthetase overexpression in vascular smooth muscle cells potentiates immunostimulant-induced NO production. J Biol Chem. 1997;272:16624–16630. - PubMed
-
- Day CP, James OF. Steatohepatitis: a tale of two “hits”? Gastroenterology. 1998;114:842–845. - PubMed
-
- Lalor PF, Faint J, Aarbodem Y, Hubscher SG, Adams DH. The role of cytokines and chemokines in the development of steatohepatitis. Semin Liver Dis. 2007;27:173–193. - PubMed
-
- Ignarro LJ. Physiology and pathophysiology of nitric oxide. Kidney Int Suppl. 1996;55:S2–5. - PubMed
Publication types
MeSH terms
Substances
Grants and funding
LinkOut - more resources
Full Text Sources
Medical
Research Materials
Miscellaneous