

Comparative Study
doi: 10.1128/AEM.05490-11.
Epub 2011 Aug 26.
Comparison of the gut microbiotas of healthy adult twins living in South Korea and the United States
Affiliations
- PMID: 21873488
- PMCID: PMC3194848
- DOI: 10.1128/AEM.05490-11
Item in Clipboard
Comparative Study
Comparison of the gut microbiotas of healthy adult twins living in South Korea and the United States
Appl Environ Microbiol.
2011 Oct.
Abstract
We compared the composition of the fecal microbiotas of Korean and U.S. adult twins. Our data indicated that the gut microbiota shows some signature of biogeography, potentially mediated by differences in diet and/or other environmental factors; however, these regional differences may be masked by other phenotypic variations, such as obesity.
Figures
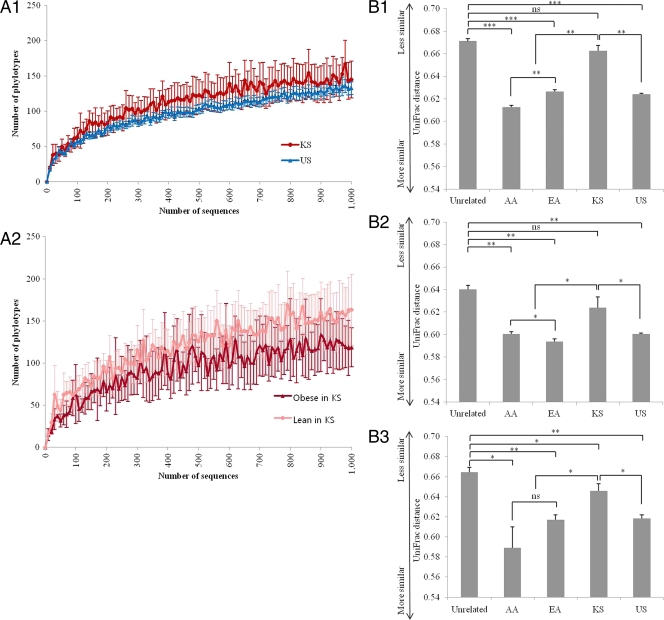
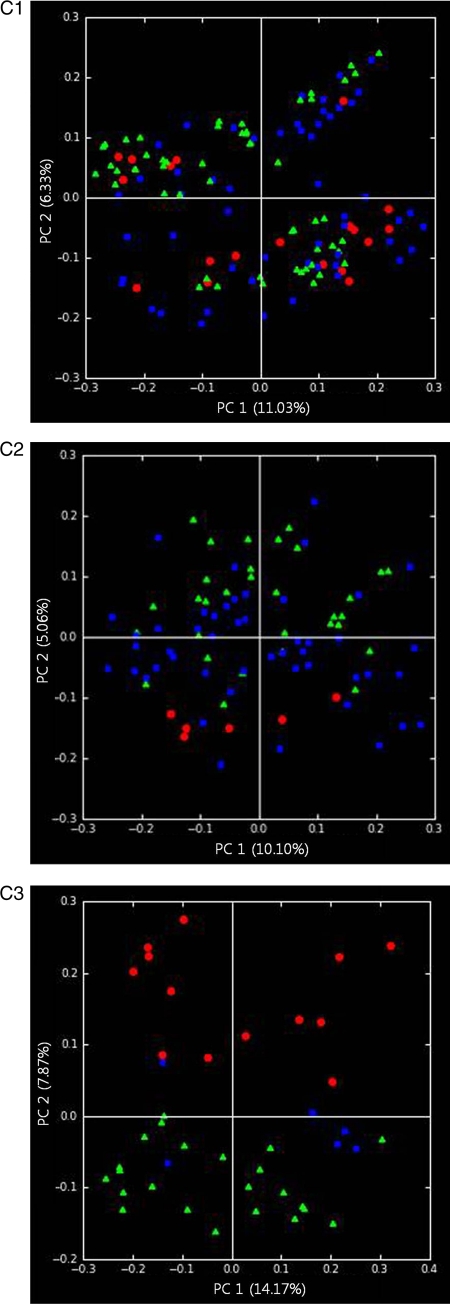
(A) Estimation of the abundance of unique operational taxonomic units (OTUs) using Chao1 based on nonphylogenetic metrics. Phylogenetic diversity was estimated using the average values for the Chao1 plot of the gut microbiota in the American (US) and Korean (KS) cohorts (A1) and in obese and lean Korean cohorts (A2). Data are based on 1,000 sequences per sample from the study populations. The values are means, and error bars indicate the 95% confidence intervals. (B) Average unweighted UniFrac distance between the samples from Korean (KS), total American (US), African American (AA), European American (EA), and unrelated individuals in the total population (B1), obese subpopulation (B2), and lean subpopulation (B3). Asterisks indicate significant differences (Student's t test). The values are means, and error bars indicate the standard errors of the means. ns, not significant; *, P < 0.05; **, P < 10−9; ***, P < 10−53. (C) Principal coordinate analysis (PCoA) of the total gut bacterial communities in the Korean and American cohorts. Points indicate values for Korean (red spots) and American, including African American (blue spots) and European American (green spots), individuals. The PC1 (principal component 1; x axis) and PC2 (principal component 2; y axis) values were estimated to be 11.03 and 6.33%, respectively, in the total population (C1). The obese subpopulation values were estimated to be 10.10 and 5.06%, respectively (C2). The lean subpopulation values were estimated to be 14.17 and 7.87%, respectively (C3).
(A) Estimation of the abundance of unique operational taxonomic units (OTUs) using Chao1 based on nonphylogenetic metrics. Phylogenetic diversity was estimated using the average values for the Chao1 plot of the gut microbiota in the American (US) and Korean (KS) cohorts (A1) and in obese and lean Korean cohorts (A2). Data are based on 1,000 sequences per sample from the study populations. The values are means, and error bars indicate the 95% confidence intervals. (B) Average unweighted UniFrac distance between the samples from Korean (KS), total American (US), African American (AA), European American (EA), and unrelated individuals in the total population (B1), obese subpopulation (B2), and lean subpopulation (B3). Asterisks indicate significant differences (Student's t test). The values are means, and error bars indicate the standard errors of the means. ns, not significant; *, P < 0.05; **, P < 10−9; ***, P < 10−53. (C) Principal coordinate analysis (PCoA) of the total gut bacterial communities in the Korean and American cohorts. Points indicate values for Korean (red spots) and American, including African American (blue spots) and European American (green spots), individuals. The PC1 (principal component 1; x axis) and PC2 (principal component 2; y axis) values were estimated to be 11.03 and 6.33%, respectively, in the total population (C1). The obese subpopulation values were estimated to be 10.10 and 5.06%, respectively (C2). The lean subpopulation values were estimated to be 14.17 and 7.87%, respectively (C3).
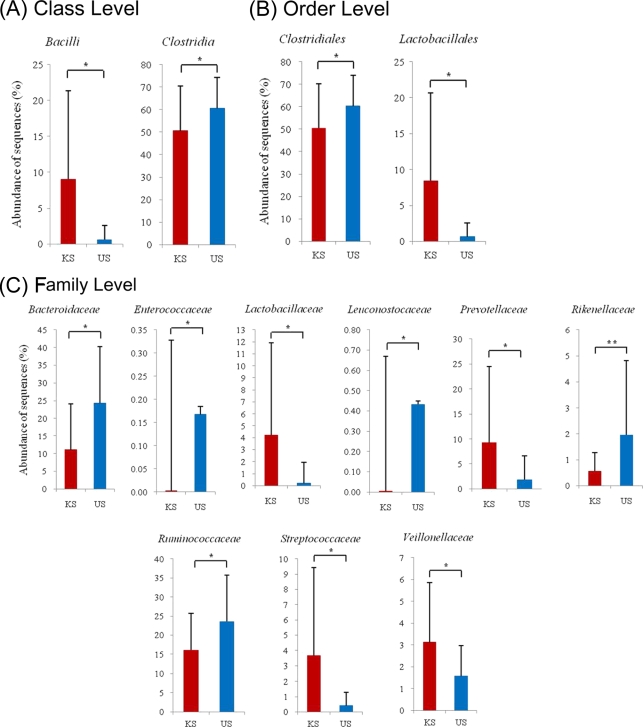
Bacterial taxa that discriminate Korean versus U.S. fecal microbiota at the class (A), order (B), and (C) family levels. The graphs show only Firmicutes and Bacteroidetes taxa that exhibited significant differences.
References
-
- Heath A., et al. 2002. Ascertainment of a mid-western US female adolescent twin cohort for alcohol studies: assessment of sample representativeness using birth record data. Twin Res. 5:107–112 - PubMed
-
- Hehemann J., et al. 2010. Transfer of carbohydrate-active enzymes from marine bacteria to Japanese gut microbiota. Nature 464:908–912 - PubMed
-
- Huber T., Faulkner G., Hugenholtz P. 2004. Bellerophon: a program to detect chimeric sequences in multiple sequence alignments. Bioinformatics 20:2317. - PubMed
Publication types
MeSH terms
LinkOut - more resources
Full Text Sources
Molecular Biology Databases
