. 2011 Jun;300(6):E1047-58.
doi: 10.1152/ajpendo.00666.2010. Epub 2011 Mar 8.

High-fat diet induces an initial adaptation of mitochondrial bioenergetics in the kidney despite evident oxidative stress and mitochondrial ROS production

Affiliations

High-fat diet induces an initial adaptation of mitochondrial bioenergetics in the kidney despite evident oxidative stress and mitochondrial ROS production

Christine Ruggiero et al. Am J Physiol Endocrinol Metab. 2011 Jun.

Abstract

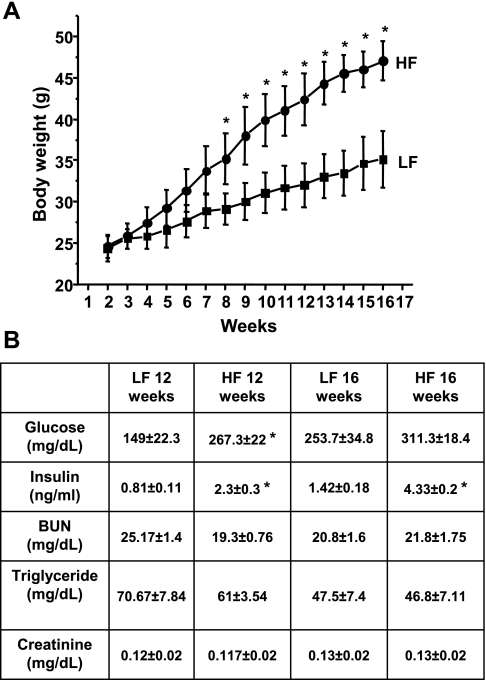
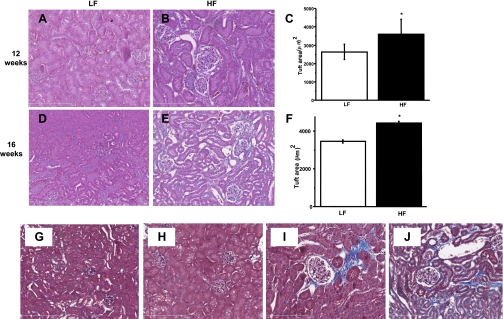
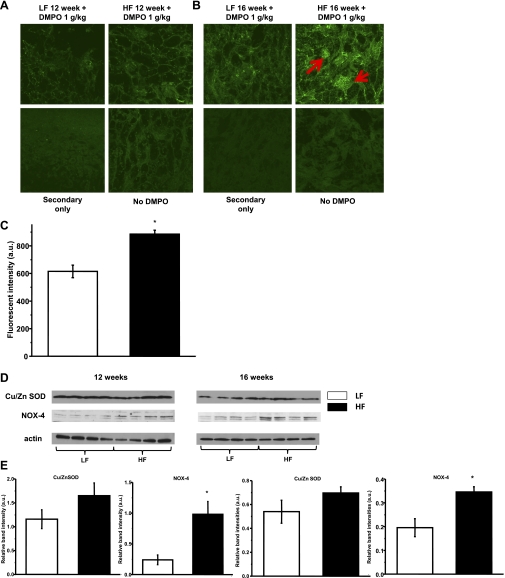
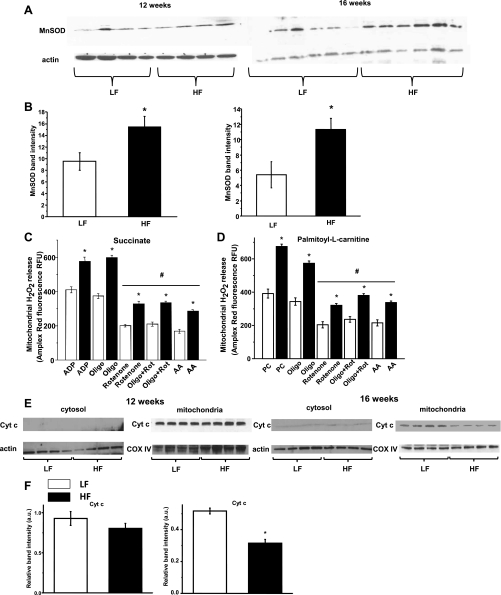
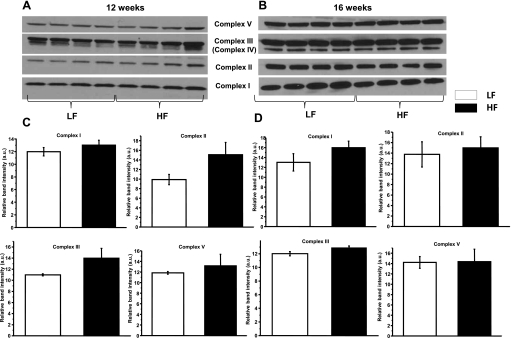
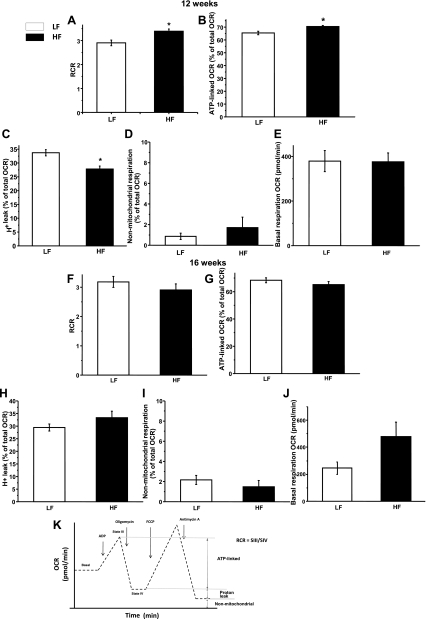
Obesity and metabolic syndrome are associated with an increased risk for several diabetic complications, including diabetic nephropathy and chronic kidney diseases. Oxidative stress and mitochondrial dysfunction are often proposed mechanisms in various organs in obesity models, but limited data are available on the kidney. Here, we fed a lard-based high-fat diet to mice to investigate structural changes, cellular and subcellular oxidative stress and redox status, and mitochondrial biogenesis and function in the kidney. The diet induced characteristic changes, including glomerular hypertrophy, fibrosis, and interstitial scarring, which were accompanied by a proinflammatory transition. We demonstrate evidence for oxidative stress in the kidney through 3-nitrotyrosine and protein radical formation on high-fat diet with a contribution from iNOS and NOX-4 as well as increased generation of mitochondrial oxidants on carbohydrate- and lipid-based substrates. The increased H(2)O(2) emission in the mitochondria suggests altered redox balance and mitochondrial ROS generation, contributing to the overall oxidative stress. No major derailments were observed in respiratory function or biogenesis, indicating preserved and initially improved bioenergetic parameters and energy production. We suggest that, regardless of the oxidative stress events, the kidney developed an adaptation to maintain normal respiratory function as a possible response to an increased lipid overload. These findings provide new insights into the complex role of oxidative stress and mitochondrial redox status in the pathogenesis of the kidney in obesity and indicate that early oxidative stress-related changes, but not mitochondrial bioenergetic dysfunction, may contribute to the pathogenesis and development of obesity-linked chronic kidney diseases.


Figures

Fig. 1.
Fig. 1.
Body weight changes and clinical/kidney metabolic parameters in low- (LFD) and high-fat diet (HFD)-fed mice. A: representative graph of body weight changes in C57BL mice on 10% kcal LFD or 45% kcal HFD. B: typical clinical chemistry parameters of C57BL mice after 12 and 16 wk of LFD or HFD. Values are means ± SE; n = 12. *P < 0.05 vs. LFD fed.
Fig. 2.
Fig. 2.
Glomerular hypertrophy and fibrosis, interstitial scarring, fibrosis, and mesangial space expansion in the HFD kidney. A–F: LFD-fed mice kidneys showed normal glomeruli structure at 12 and 16 wk (A and D), whereas kidneys in HFD-fed group showed gradually progressing increase in glomerular tuft size and Bowman's space expansion after 12 (B) and 16 wk (E). At least 30 glomeruli were measured in each group, data represent means ± SE; n = 30, *P < 0.05 vs. LFD. G: representative section of LFD-fed mouse kidney at ×100 with TriChrome staining, with normal glomeruli and mesangial cells at 12 wk. H: typical section of a 16-wk LFD-fed mouse kidney. I: representative of 12-wk HFD glomeruli with mesangial space expansion, fibrotic tissue, thickened membranes, and expanded Bowman's space stained in blue (×200). J: fibrosis, collagen, and interstitial scarring in a 16-wk HFD-fed mouse kidney (×200).
Fig. 3.
Fig. 3.
Proinflammatory signs in the kidney from HFD mice. A: fibroblast-specific protein-1 (FSP-1) expression and accumulation over time in mouse kidneys after 12 and 16 wk of HFD feeding (green fluorescent interstitial staining). B: staining was evaluated as the positively green-stained percentage of total pixels in each group. Values are means ± SE; n = 12 pictures evaluated in each group. *P < 0.05 vs. LFD group. C: positive and progressing 3-nitrotyrosine (3-NT) staining in kidney glomeruli (red fluorescence mainly in glomeruli). D: evaluation of staining was measured as fluorescent intensity in the glomeruli. Values are means ± SE; n = 15–20 glomeruli per each group. *P < 0.05 vs. LFD group. E: representative iNOS staining in LFD and HFD kidney sections at both time points showing iNOS in the glomeruli. F: evaluation of staining was measured as fluorescent intensity in the glomeruli. Values are means ± SE; n = 15–20 glomeruli per each group, *P < 0.05 vs. LFD group.
Fig. 4.
Fig. 4.
Cellular oxidative stress and protein radical formation progress over time on HFD feeding in the kidney. Animals were injected with the spin trap DMPO (1 g/kg, twice) before being euthanized, and then a DMPO-protein radical adduct-specific anti-DMPO antibody was applied for staining. A: minimal green staining can be observed in kidney sections after 12 wk of HFD feeding. B: protein radical formation was observed as positive green staining mainly in glomeruli after 16 wk of HFD feeding (red arrows). Kidney sections from non-DMPO-treated animals and omitting primary antibody on sections served as negative controls. C: evaluation of staining was measured as fluorescent intensity in glomeruli of the 16-wk group. Data show means ± SE; n = 15–20 glomeruli per each group. *P < 0.05 vs. LFD group. D: representative Western blots of Cu/ZnSOD and NOX-4 protein levels in LFD and HFD groups showing no change in Cu/ZnSOD levels, but a robust increase in NOX-4 levels on HFD. E: Western blot band intensities were evaluated in each group (n = 4). Data are expressed as means ± SE. *P < 0.05 vs. LFD group.
Fig. 5.
Fig. 5.
Mitochondrial redox status changes and oxidant production upon HFD feeding in obese mouse kidneys. A: representative Western blots show slightly increased MnSOD expression in the 12-wk feeding group, which was further increased at 16 wk. B: Western blot band intensities were evaluated in each group (n = 4–5), and experiments were repeated 3 times. Data are expressed as means ± SE. *P < 0.05 vs. LFD group. C: HFD increased kidney mitochondrial H2O2 emission at 12 wk time point on ADP or in state IV respiration vs. LFD group, using succinate or palmitoyl-l-carnitine (D) as substrates. Inhibition of complex I significantly reduced H2O2 emitting capacity. Rot, rotenone; PC, palmitoyl-l-carnitine; AA, antimycin A. Data represent means ± SE; n = 5 in duplicated experiments. *P < 0.05 vs. LFD group; #P < 0.05 vs. corresponding state IV respiration groups. E: representative Western blot analyses of cytochrome c levels in cytosolic and mitochondrial fractions from LFD and HFD kidney samples. F: band intensities were evaluated in the mitochondrial fraction as above (n = 4). Data are expressed as means ± SE. *P < 0.05 vs. LFD group.
Fig. 6.
Fig. 6.
Mitochondrial biogenesis and protein expression levels of respiratory chain complexes. A and B: representative Western blots of respiratory chain complex proteins after 12 and 16 wk of feeding. C and D: evaluation of Western blot band intensities revealed intact biogenesis of the electron transport chain (n = 4, triplicate experiments). Data are shown as means ± SE. *P < 0.05 vs. LFD group.
Fig. 7.
Fig. 7.
Mitochondrial bioenergetic adaptation to HFD feeding in isolated kidney mitochondria. Experiments were run on a SeaHorse XF24 extracellular flux analyzer to obtain bioenergetic profiles from LFD- and HFD-fed groups at 12 and 16 wk. OCR, oxygen consumption rate. A–E: typical bioenergetic parameters in the 12-wk feeding group. Some parameters showed improvement as an adaptation. A: respiratory control ratio (RCR). B: ATP-linked respiration. C: proton leak. D: nonmitochondrial respiration. E: basal respiration rates. F–J: same as A–E in the 16-wk feeding group. K: philosophy of the SeaHorse extracellular flux analyzer machine and interpretation of the various parameters. Data represent means ± SE for 2 independent cohorts (n = 8 per group). *P < 0.05 vs. LFD group.

References

    1. Abrass CK. Cellular lipid metabolism and the role of lipids in progressive renal disease. Am J Nephrol 24: 46–53, 2004 - PubMed
    1. Abrass CK. Overview: obesity: what does it have to do with kidney disease? J Am Soc Nephrol 15: 2768–2772, 2004 - PubMed
    1. Anderson EJ, Lustig ME, Boyle KE, Woodlief TL, Kane DA, Lin CT, Price JW, 3rd, Kang L, Rabinovitch PS, Szeto HH, Houmard JA, Cortright RN, Wasserman DH, Neufer PD. Mitochondrial H2O2 emission and cellular redox state link excess fat intake to insulin resistance in both rodents and humans. J Clin Invest 2009 - PMC - PubMed
    1. Anderson EJ, Yamazaki H, Neufer PD. Induction of endogenous uncoupling protein 3 suppresses mitochondrial oxidant emission during fatty acid-supported respiration. J Biol Chem 282: 31257–31266, 2007 - PubMed
    1. Bagby SP. Obesity-initiated metabolic syndrome and the kidney: a recipe for chronic kidney disease? J Am Soc Nephrol 15: 2775–2791, 2004 - PubMed

Publication types

MeSH terms