. 2010 Sep 28;107(39):16970-5.
doi: 10.1073/pnas.1011751107. Epub 2010 Sep 13.

Polyamine pathway contributes to the pathogenesis of Parkinson disease

Affiliations

Polyamine pathway contributes to the pathogenesis of Parkinson disease

Nicole M Lewandowski et al. Proc Natl Acad Sci U S A. .

Abstract

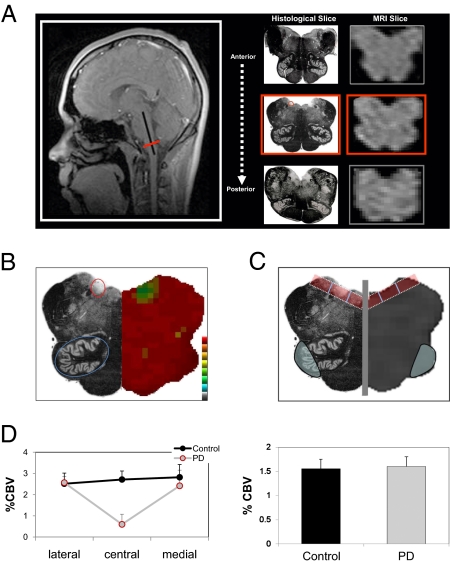
The full complement of molecular pathways contributing to the pathogenesis of Parkinson disease (PD) remains unknown. Here we address this issue by taking a broad approach, beginning by using functional MRI to identify brainstem regions differentially affected and resistant to the disease. Relying on these imaging findings, we then profiled gene expression levels from postmortem brainstem regions, identifying a disease-related decrease in the expression of the catabolic polyamine enzyme spermidine/spermine N1-acetyltransferase 1 (SAT1). Next, a range of studies were completed to support the pathogenicity of this finding. First, to test for a causal link between polyamines and α-synuclein toxicity, we investigated a yeast model expressing α-synuclein. Polyamines were found to enhance the toxicity of α-synuclein, and an unbiased genome-wide screen for modifiers of α-synuclein toxicity identified Tpo4, a member of a family of proteins responsible for polyamine transport. Second, to test for a causal link between SAT1 activity and PD histopathology, we investigated a mouse model expressing α-synuclein. DENSPM (N1, N11-diethylnorspermine), a polyamine analog that increases SAT1 activity, was found to reduce PD histopathology, whereas Berenil (diminazene aceturate), a pharmacological agent that reduces SAT1 activity, worsened the histopathology. Third, to test for a genetic link, we sequenced the SAT1 gene and a rare but unique disease-associated variant was identified. Taken together, the findings from human patients, yeast, and a mouse model implicate the polyamine pathway in PD pathogenesis.


Conflict of interest statement

The authors declare no conflict of interest.

Figures

Fig. 1.
Fig. 1.
fMRI identifies brainstem regions targeted by and resistant to PD. (A) Anatomical criteria used to identify an MRI slice of the medulla that contains the DMNV. As shown by the sagittal scout image (Left), MRI slices were acquired from anterior to posterior (three consecutive MRI slices are shown together with their accompanying histological slices), perpendicular to the long axis of the brainstem (black line in scout image). Using strict anatomical criteria (Materials and Methods and SI Text), a single slice (red line in scout image and red-boxed middle images) was identified in each individual subject, containing the DMNV (red circle in the middle boxed histological slice). (B) CBV fMRI maps of the brainstem slice that contains the DMNV were coregistered, and statistical maps comparing PD patients and controls were generated. For anatomical reference, the right half of the figure shows the statistical maps, which are color-coded such that cooler colors indicate less function, and the left half of the figure shows a histological slice where the DMNV is circled in red and the ION is circled in blue. (C) ROI analysis of the DMNV and the ION. The gray vertical line demarcates the midline of the medulla. The red boxes represent the three ROIs in the dorsal medulla, where the box furthest from the midline is the lateral measure, the box closest to the midline represents the medial measure, and the middle box represents the central measure, which contains the DMNV. The blue ovals represent the ROI of the ION. Again, as an anatomical reference, the right half of the figure is the MRI scan, and the left half of the figure is the histological slice. (D) Group data analysis shows selective PD-related dysfunction in the central dorsal medulla (Left). The y axis = %CBV for each ROI (lateral, central, and medial), averaged for PD cases and controls, of both the left and right side of the medulla. No group differences were observed in the ION (Right).
Fig. 2.
Fig. 2.
Imaging-guided microarray identifies a PD-associated decrease in SAT1 expression. (A) Ten molecules whose expression levels via microarray analysis were differentially affected in PD cases vs. controls, comparing the DMNV to the ION. Note that for all 10 transcripts, the expression level was down-regulated in PD vs. controls; P values were calculated by a repeated-measures 2 × 2 factorial ANOVA. (B) Mean expression levels are shown on the graph for SAT1 for mRNA where n = 22 (six DMNV and six ION for PD, and five for each region in controls). Expression within the DMNV was significantly down in PD compared with controls (P = 0.002) (Left). In a new set of brains, protein expression via Western blot, where n = 20 (five DMNV and five ION for each group, control and PD), showed a significant decrease of SAT1 expression (P = 0.045) in the DMNV of PD samples compared with controls, but not in the ION, as seen in the blot image of representative samples and quantified normalized to actin depicted in the right graph. (C) Immunohistochemistry for SAT1 protein in the DMNV (Left) and the ION (Right) showed positive expression within the neuronal cell bodies of both regions, at 40× (Left) and 400× (Right), respectively.
Fig. 3.
Fig. 3.
Yeast studies establish a link between polyamines and α-synuclein. (A) Yeast cells integrated with empty vector (Vec), wild-type α-synuclein (Syn-WT), or mutant α-synuclein (Syn-A53T) were grown in YPGal medium supplemented with spermine at concentrations of 0 mM (Top), 0.2 mM (Middle), and 0.4 mM (Bottom). OD600 was monitored at 1 h intervals using the Bioscreen system. The growth curves shown are representative of three independent experiments. (B) In an unbiased genome-wide yeast screen, Tpo4 was shown to enhance toxicity in cells expressing α-synuclein at a ∼40% higher level (IntTox), in comparison with a known toxicity enhancer (Gyp8) and suppressor (Ypt1). (C) Tpo4 caused α-synuclein to form intracellular foci more rapidly than it otherwise would in the IntTox strain.
Fig. 4.
Fig. 4.
Mice studies establish a link between SAT1 activity and α-synuclein histopathology. Transgenic mice that express wild-type human α-synuclein and nontransgenic controls (nontg) were treated by intracranial infusion via osmotic pumps with PBS, DENSPM, or Berenil for 6 wk. Results for immunoreactivity within the basal ganglia are shown. (A) Mean α-synuclein cell-pixel intensity (cell mean) in the caudoputamen was increased with Berenil (*P = 0.009) and decreased with DENSPM (*P = 0.043) in comparison with transgenic α-synuclein mice treated with PBS (syntgPBS). (B) Tyrosine hydroxylase (TH) fibers were decreased with Berenil treatment (*P = 0.033), and increased with DENSPM (*P = 0.022), compared with syntgPBS, as shown by the cell mean (TH corrected optical density in the caudoputamen). (C) Berenil caused a decrease in MAP2 (*P = 0.013), compared with syntgPBS, whereas DENSPM rescued the transgenic α-synuclein effects. Percent cell mean represents the percentage of the neuropil covered by MAP2 immunoreactive dendrites in the caudoputamen.
Fig. 5.
Fig. 5.
Genetic studies in human patients identify a PD-associated variance in SAT1. (A) Schematic of the SAT1 gene and the location of the deletion within the 3′UTR of SAT1. (B) Sequence chromatograms showing a PD patient heterozygous for the c.786_788delTGT variant, and (C) a wild-type subject.

Comment in

References

    1. Hardy J, Cai H, Cookson MR, Gwinn-Hardy K, Singleton A. Genetics of Parkinson's disease and parkinsonism. Ann Neurol. 2006;60:389–398. - PubMed
    1. Litvan I, et al. The etiopathogenesis of Parkinson disease and suggestions for future research. Part I. J Neuropathol Exp Neurol. 2007;66:251–257. - PubMed
    1. Coppola G, Geschwind DH. Technology insight: Querying the genome with microarrays—progress and hope for neurological disease. Nat Clin Pract Neurol. 2006;2:147–158. - PubMed
    1. Lewandowski NM, Small SA. Brain microarray: Finding needles in molecular haystacks. J Neurosci. 2005;25:10341–10346. - PMC - PubMed
    1. Kerr MK, Martin M, Churchill GA. Analysis of variance for gene expression microarray data. J Comput Biol. 2000;7:819–837. - PubMed

Publication types

Associated data