. 2009 Aug 21;284(34):22938-51.
doi: 10.1074/jbc.M109.035774. Epub 2009 Jun 22.

Loss of parkin or PINK1 function increases Drp1-dependent mitochondrial fragmentation

Affiliations

Loss of parkin or PINK1 function increases Drp1-dependent mitochondrial fragmentation

A Kathrin Lutz et al. J Biol Chem. .

Abstract

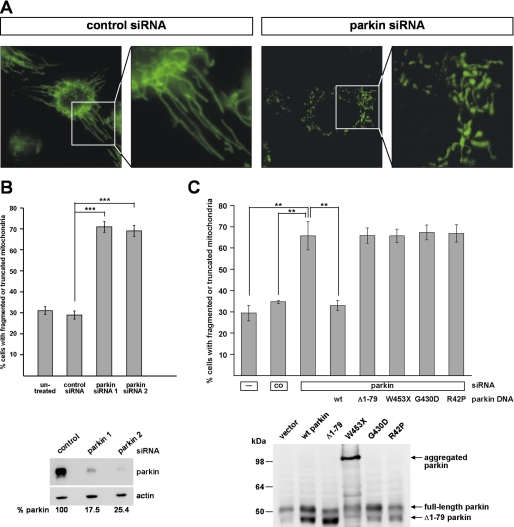
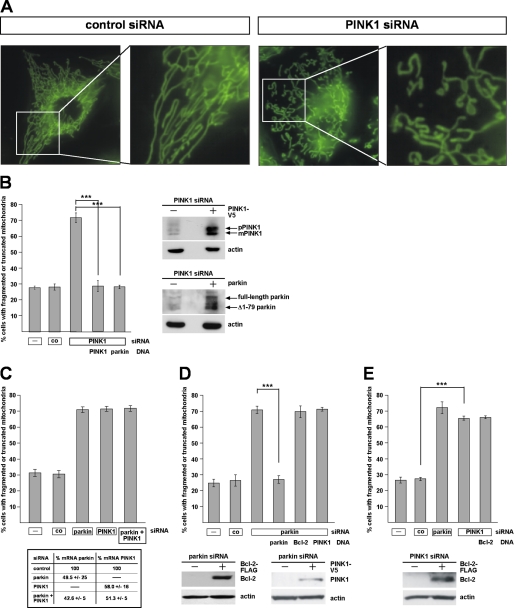
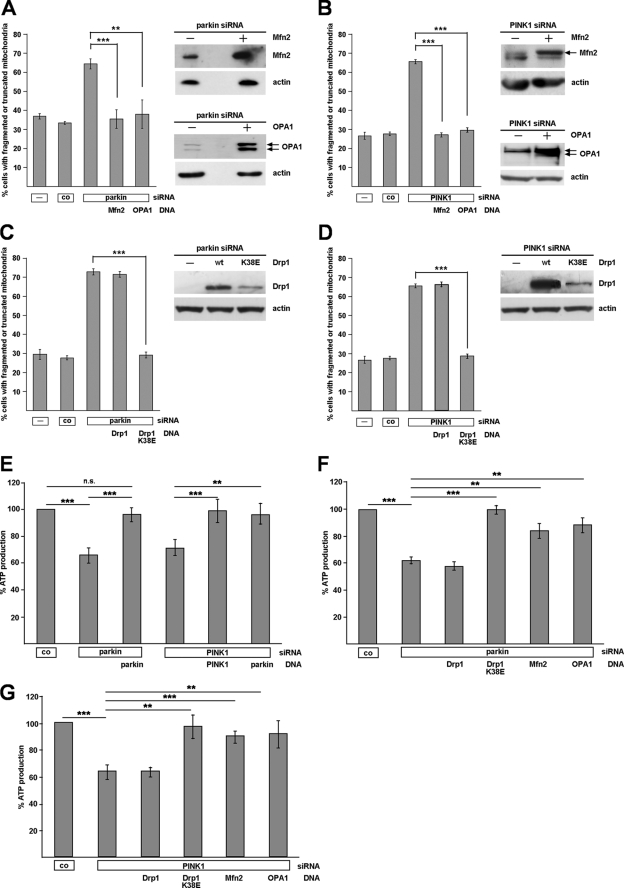
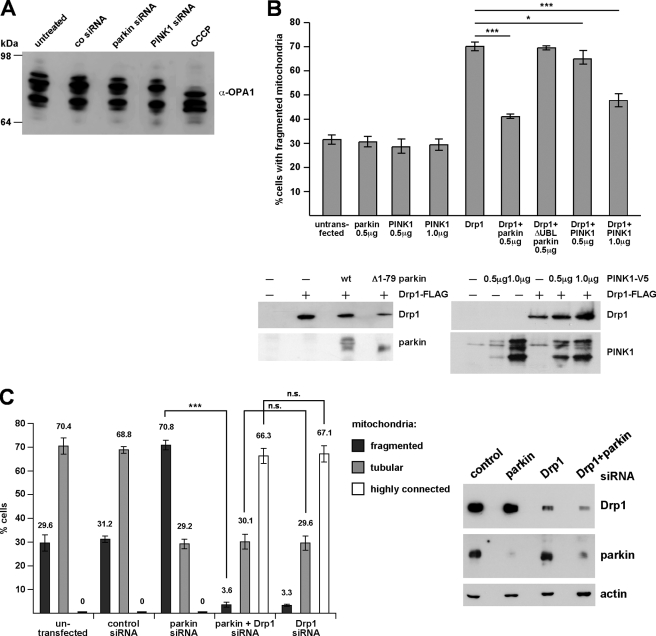
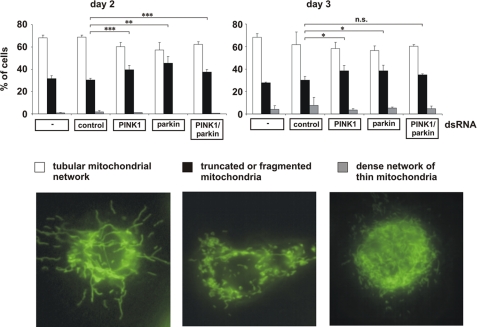
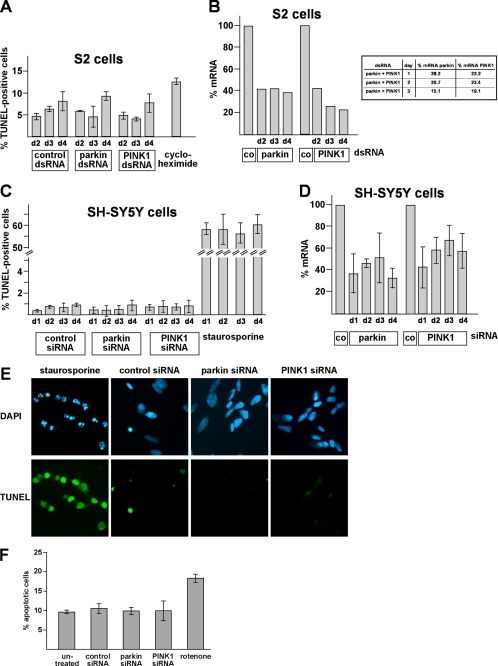
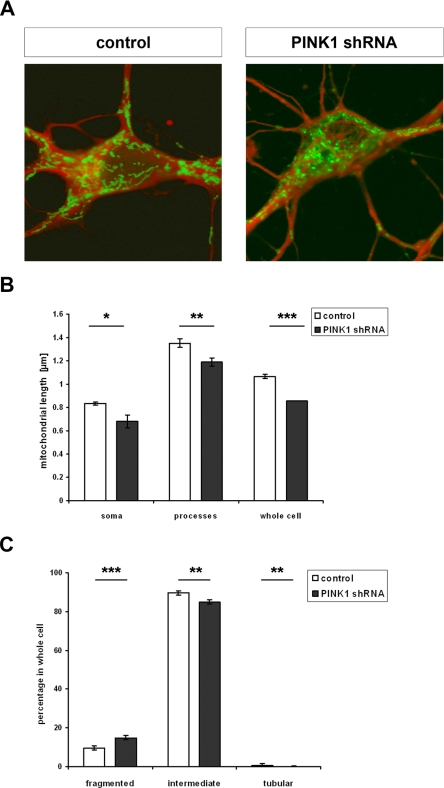
Loss-of-function mutations in the parkin gene (PARK2) and PINK1 gene (PARK6) are associated with autosomal recessive parkinsonism. PINK1 deficiency was recently linked to mitochondrial pathology in human cells and Drosophila melanogaster, which can be rescued by parkin, suggesting that both genes play a role in maintaining mitochondrial integrity. Here we demonstrate that an acute down-regulation of parkin in human SH-SY5Y cells severely affects mitochondrial morphology and function, a phenotype comparable with that induced by PINK1 deficiency. Alterations in both mitochondrial morphology and ATP production caused by either parkin or PINK1 loss of function could be rescued by the mitochondrial fusion proteins Mfn2 and OPA1 or by a dominant negative mutant of the fission protein Drp1. Both parkin and PINK1 were able to suppress mitochondrial fragmentation induced by Drp1. Moreover, in Drp1-deficient cells the parkin/PINK1 knockdown phenotype did not occur, indicating that mitochondrial alterations observed in parkin- or PINK1-deficient cells are associated with an increase in mitochondrial fission. Notably, mitochondrial fragmentation is an early phenomenon upon PINK1/parkin silencing that also occurs in primary mouse neurons and Drosophila S2 cells. We propose that the discrepant findings in adult flies can be explained by the time of phenotype analysis and suggest that in mammals different strategies may have evolved to cope with dysfunctional mitochondria.


Figures

FIGURE 1.
FIGURE 1.
Down-regulation of parkin by RNAi leads to alterations in mitochondrial morphology. A and B, SH-SY5Y cells transfected with control siRNA or siRNA targeting parkin were stained with the fluorescent dye DiOC6(3) to visualize mitochondria and analyzed by fluorescence microscopy. The analysis was performed 3 days after transfection. Cells displaying an intact network of tubular mitochondria were classified as tubular. When this network was disrupted and mitochondria appeared predominantly spherical or rod-like, they were classified as fragmented. B, for quantification, the mitochondrial morphology of at least 300 cells per plate was determined in a blinded manner. Quantifications were based on triplicates of at least three independent experiments. Shown is the percentage of cells with fragmented or truncated mitochondria. Lower panel, the efficiency of parkin knockdown is shown by Western blotting using the monoclonal anti-parkin antibody PRK8. β-Actin was used as a loading control. C, SH-SY5Y cells were transfected with parkin-specific siRNA and either siRNA-resistant wild type (wt) parkin, Δ1–79, W453X, G430D, or R42P mutant parkin. The cells were analyzed by fluorescence microscopy as described under A. Lower panel, expression of parkin or parkin mutants was analyzed by Western blotting using the monoclonal anti-parkin antibody PRK8. Please note that the overexpression of parkin gives rise to two parkin species, full-length parkin of 52 kDa and a smaller parkin species of about 42 kDa, due to the usage of the second translation initiation site (15).
FIGURE 2.
FIGURE 2.
PINK1-deficient SH-SY5Y cells show alterations in mitochondrial morphology similar to parkin-deficient cells. A, SH-SY5Y cells transfected with control siRNA or siRNA targeting PINK1 were stained with the fluorescent dye DiOC6(3) to visualize mitochondria and analyzed by fluorescence microscopy as described in Fig. 1. B, down-regulation of PINK1 by RNAi leads to an increase in mitochondrial fragmentation, which can be rescued by parkin. SH-SY5Y cells were transfected with PINK1-specific siRNA and either siRNA-resistant PINK1 or wild type parkin. The cells were analyzed by fluorescence microscopy as described in Fig. 1. Right panel, expression of PINK1 and parkin was analyzed by Western blotting using a monoclonal anti-V5 antibody or the anti-parkin anti-serum hP1. pPINK1, precursor form; mPINK1, mature form. C, simultaneous down-regulation of parkin and PINK1 does not increase mitochondrial fragmentation over the single parkin or PINK1 knockdown. SH-SY5Y cells were transfected with parkin-specific siRNA and/or PINK1-specific siRNA, and the cells were analyzed by fluorescence microscopy as described above. Lower panel, efficiency of PINK1 and/or parkin down-regulation was determined by quantitative RT-PCR as described under “Experimental Procedures.” D and E, anti-apoptotic Bcl-2 has no effect on the mitochondrial morphology in parkin or PINK1 knockdown cells. PINK1 cannot rescue the parkin knockdown phenotype (D). SH-SY5Y cells were transfected with parkin-specific siRNA (D) or PINK1-specific siRNA (E) and a Bcl-2 or PINK1 expression plasmid. The cells were analyzed as described in Fig. 1. Lower panels, expression of Bcl-2 and PINK1 was analyzed by Western blotting. ***, p ≤ 0.001.
FIGURE 3.
FIGURE 3.
Abnormal mitochondrial morphology and function caused by parkin or PINK1 loss of function can be rescued by increasing mitochondrial fusion or decreasing fission. SH-SY5Y cells were cotransfected with siRNA targeting either parkin or PINK1 and the constructs indicated. The cells were analyzed as described under Fig. 1. A–D, Mfn2, OPA1, and dominant negative Drp1 (Drp1 K38E) rescued the mitochondrial phenotype observed in parkin or PINK1 knockdown cells. Shown is the percentage of cells with fragmented or truncated mitochondria. **, p ≤ 0.01; ***, p ≤ 0.001. wt, wild type. Right panel of each set, expression of Mfn2, OPA1, or Drp1 was analyzed by Western blotting. See supplemental Fig. 1 for mitochondrial images. E–G, steady state cellular ATP levels were measured in SH-SY5Y cells transfected with either parkin siRNA or PINK1 siRNA, and the expression plasmids are indicated. The analysis was performed 3 days after transfection.
FIGURE 4.
FIGURE 4.
A, RNAi-mediated knockdown of parkin or PINK1 does not alter proteolytic processing of OPA1. SH-SY5Y cells transfected with control siRNA or siRNA targeting parkin or PINK1 were analyzed by Western blotting using a polyclonal antibody against OPA1. As a positive control to induce OPA1 processing, cells were treated with carbonyl cyanide 3-chlorophenylhydrazone (CCCP; 20 μm, 30 min). B, parkin and PINK1 (at higher expression levels) can reduce mitochondrial fission induced by Drp1. SH-SY5Y cells were transfected with the constructs indicated. 24 h after transfection mitochondrial morphology of transfected cells (identified by the coexpression of mCherry) was assessed as described in Fig. 1. Lower panel, expression levels of Drp1-FLAG, parkin, and PINK1-V5 in SH-SY5Y cells. 10 μg of protein were loaded per lane. See supplemental Fig. 2 for mitochondrial images. wt, wild type. C, in Drp1-deficient cells the mitochondrial phenotype induced by parkin knockdown does not occur. SH-SY5Y cells were transfected with the siRNAs indicated, and mitochondrial morphology was determined as described in Fig. 1. Right panel, the efficiency of Drp1 and parkin down-regulation by RNAi was shown by Western blotting using a monoclonal anti-Drp1 antibody and the anti-parkin antibody PRK8. β-Actin was used as a loading control. ***, p ≤ 0.001.
FIGURE 5.
FIGURE 5.
In Drosophila S2 cells, mitochondrial fragmentation is an early phenotype of parkin and/or PINK1 loss of function. S2 cells grown on glass coverslips were treated with control dsRNA and parkin- and/or PINK1-specific dsRNA. 48 h (day 2), 60 h (day 3), and 72 h (day 4, data not shown) after dsRNA treatment, S2 cells were stained with the fluorescent dye DiOC6(3) to visualize mitochondria and analyzed by fluorescence microscopy. Cells were categorized in three classes according to their mitochondrial morphology. For quantification, the mitochondrial morphology of at least 300 cells per plate was determined in a blinded manner. Quantifications were based on triplicates of at least two independent experiments. Shown is the percentage of cells with a tubular mitochondrial network (white columns), fragmented or truncated mitochondria (black columns), or a dense network of thin mitochondria (gray columns). Lower panel, fluorescence microscopy images to illustrate the different categories of mitochondrial morphologies. Efficiencies of parkin and PINK1 down-regulation is shown in Fig. 6B. **, p ≤ 0.01; ***, p ≤ 0.001.
FIGURE 6.
FIGURE 6.
The increase in mitochondrial fragmentation observed in parkin- or PINK1-deficient S2 or SH-SY5Y cells is not associated with an increase in apoptosis. A, S2 cells were treated with control dsRNA and parkin-specific or PINK1-specific dsRNA. At days 2, 3, and 4 after treatment, cells were fixed and permeabilized. Apoptotic cells were detected by fluorescently labeling the free 3′-OH ends of DNA strand breaks (TUNEL). As a positive control, cells were treated with cycloheximide (10 μm, 6 h). Shown is the percentage of apoptotic cells, determined by the number of TUNEL-positive cells of at least 300 DAPI-stained cells. Quantifications were based on at least three independent experiments. B, parkin or PINK1 knockdown efficiencies in S2 cells corresponding to the experiments shown in Figs. 5A and 6A. Cells were harvested at days 2, 3, and 4 after treatment. Total cellular RNA was isolated and subjected to quantitative RT-PCR using parkin- and PINK1-specific primers. The amount of RNA of each sample was normalized with respect to the endogenous housekeeping gene Rp49. The efficiencies of the parkin/PINK1 double knockdown are shown in the right panel. C, SH-SY5Y cells were transfected with control siRNA and parkin-specific or PINK1-specific siRNA. At days 1, 2, 3, and 4 after transfection, cells were fixed and permeabilized. Apoptotic cells were detected by the TUNEL assay described in A. As a positive control, cells were treated with staurosporine (1 μm, 4 h). Shown is the percentage of apoptotic cells, determined by the number of TUNEL-positive cells of at least 300 DAPI-stained cells. Quantifications were based on at least three independent experiments. D, quantification of parkin or PINK1 knockdown efficiencies in SH-SY5Y cells corresponding to the experiment shown under C. SH-SY5Y cells were harvested at days 1, 2, 3, and 4 after siRNA transfection. Total cellular RNA was isolated and subjected to quantitative RT-PCR using parkin- and PINK1-specific primers. The amount of mRNA of each sample was normalized with respect to the endogenous housekeeping gene β-actin. E, examples of the direct immunofluorescence analysis described under C. Apoptotic cells (TUNEL-positive) were fluorescein-labeled (green), and nuclei were stained with DAPI (blue). F, in addition to the TUNEL assay, a single cell analysis for activated caspase-3 was performed in SH-SY5Y cells. Two days after transfection with siRNA, SH-SY5Y cells were fixed, permeabilized, and analyzed by indirect immunofluorescence. Activation of caspase-3 was detected using an anti-active caspase-3 antibody. As a positive control, cells were treated with rotenone (10 μm, 3 h). Shown is the percentage of apoptotic cells, determined by the number of activated caspase-3-positive cells of at least 300 DAPI-stained cells. Quantifications were based on triplicates of at least three independent experiments.
FIGURE 7.
FIGURE 7.
PINK1-deficient primary mouse hippocampal neurons show a decrease in the length of mitochondria and an increase in mitochondrial fragmentation. A, hippocampal cells of E15.5 C57/BL6 mice were transduced with pLL3.7 + mito-EYFP lentivirus for control or pLL.3.7 + PINK1 shRNA mito-EYFP for down-regulation of PINK1. Mito-EYFP expression was used to determine mitochondrial morphology (green). To visualize neurons, cells were detected with the anti-β III tubulin antibody by immunocytochemistry (red). B, for quantification, the lengths of mitochondria of 40 neurons per group were determined. Shown is the mean mitochondrial length with S.E. in the soma, processes, and in the whole neuron. Down-regulation of PINK1 by shRNA led to significant decrease in mitochondrial length throughout the neuronal cell (soma, p = 0.014; processes, p = 0.006; whole neuron, p < 0.001). C, mitochondria were categorized into fragmented (<0.5 μm), intermediate (0.5–5 μm), and tubular (>5 μm). Shown is the percentage ± S.E. of mitochondria in these categories in whole neurons (n = 40). PINK1 down-regulation via shRNA resulted in a significant increase in fragmented (p < 0.001) mitochondria at the expense of intermediate (p = 0.002) and tubular (p = 0.005) mitochondria.

References

    1. Abou-Sleiman P. M., Muqit M. M., Wood N. W. (2006) Nat. Rev. Neurosci. 7,207–219 - PubMed
    1. Lin M. T., Beal M. F. (2006) Nature 443,787–795 - PubMed
    1. Schapira A. H. (2008) Lancet Neurol. 7,97–109 - PubMed
    1. Bogaerts V., Theuns J., van Broeckhoven C. (2008) Genes Brain Behav. 7,129–151 - PMC - PubMed
    1. Dodson M. W., Guo M. (2007) Curr. Opin. Neurobiol. 17,331–337 - PubMed

Publication types

MeSH terms

LinkOut - more resources