. 2008 Nov 5;28(45):11731-40.
doi: 10.1523/JNEUROSCI.3419-08.2008.

Oxytocin enhances cranial visceral afferent synaptic transmission to the solitary tract nucleus

Affiliations

Oxytocin enhances cranial visceral afferent synaptic transmission to the solitary tract nucleus

James H Peters et al. J Neurosci. .

Abstract

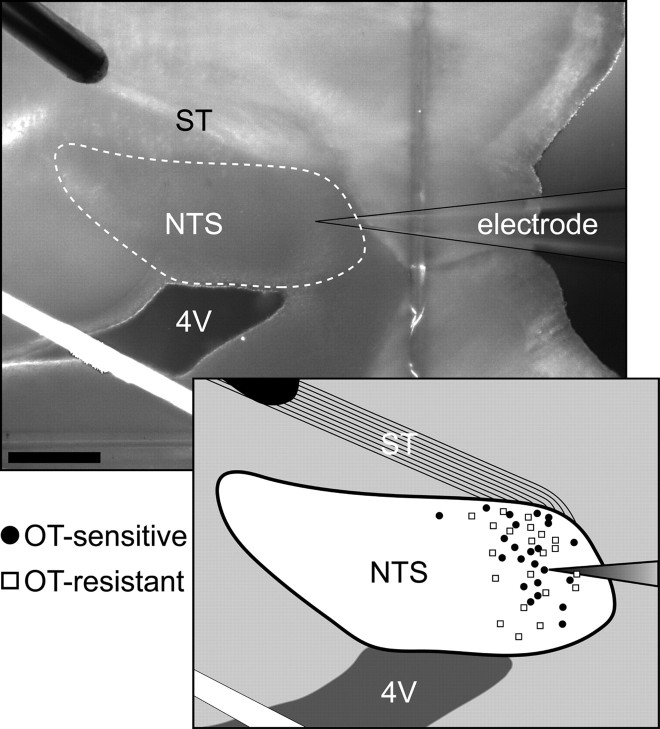
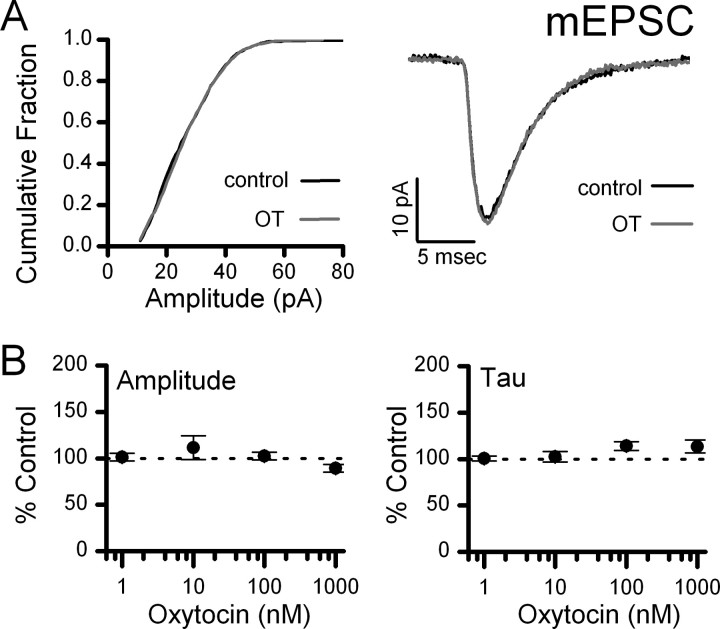
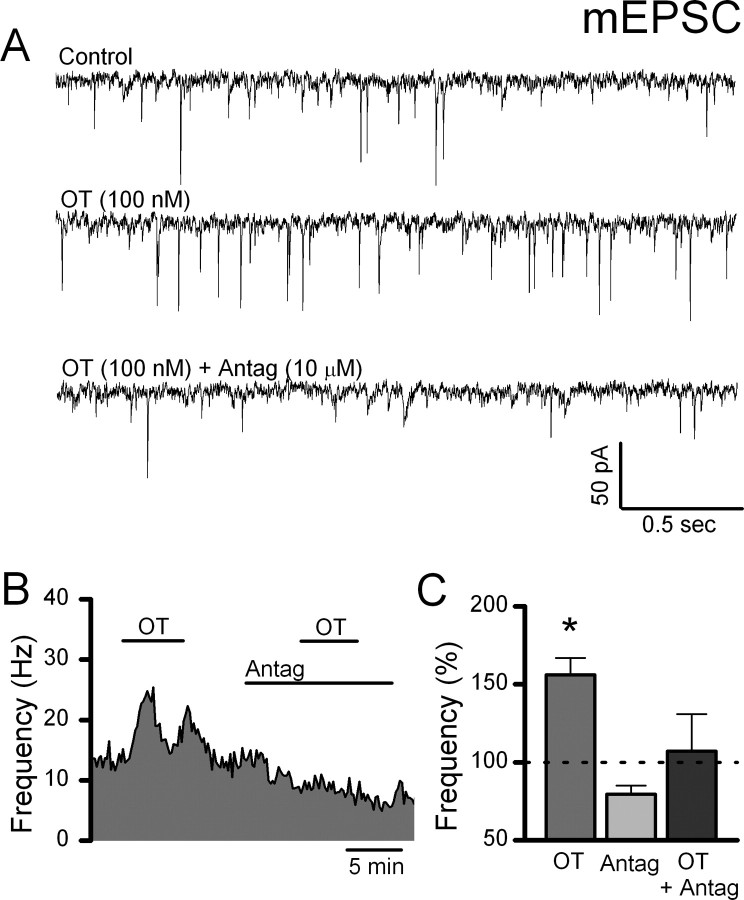
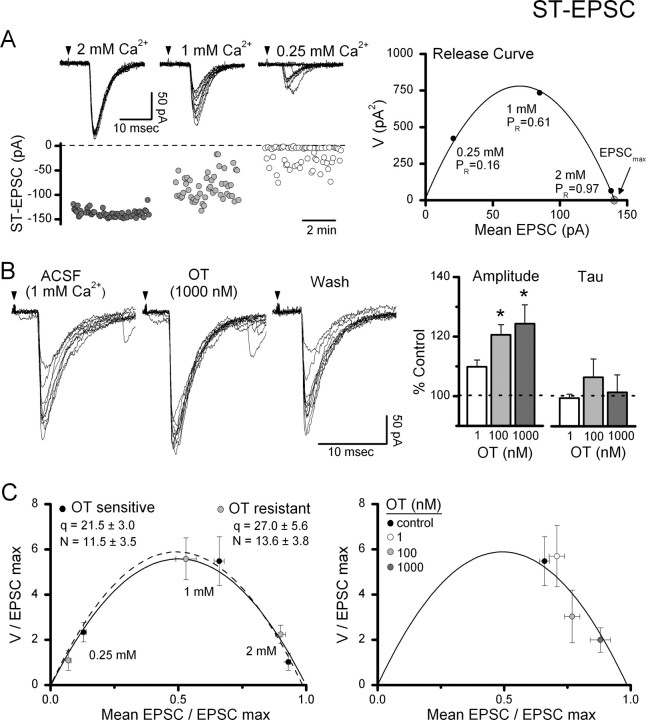
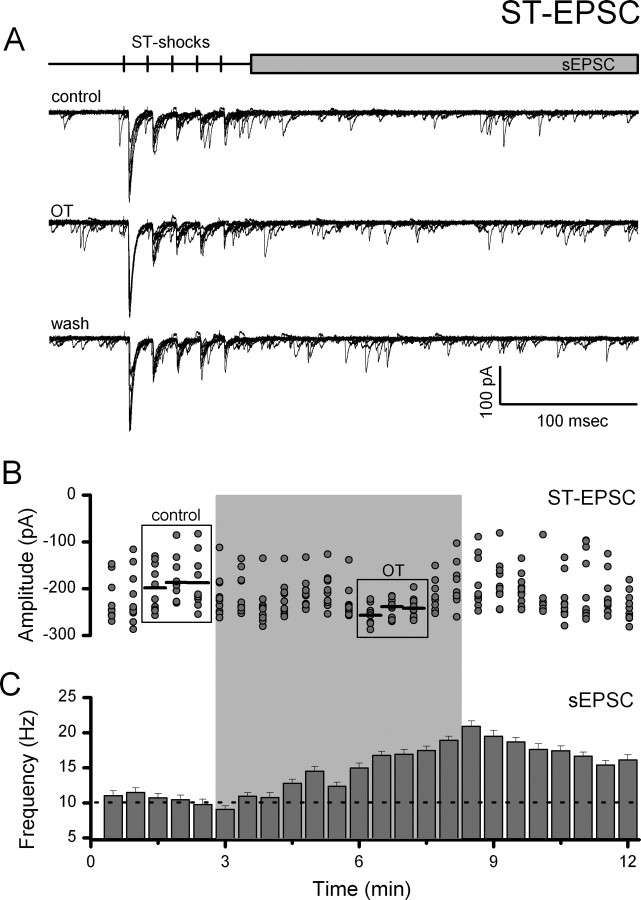
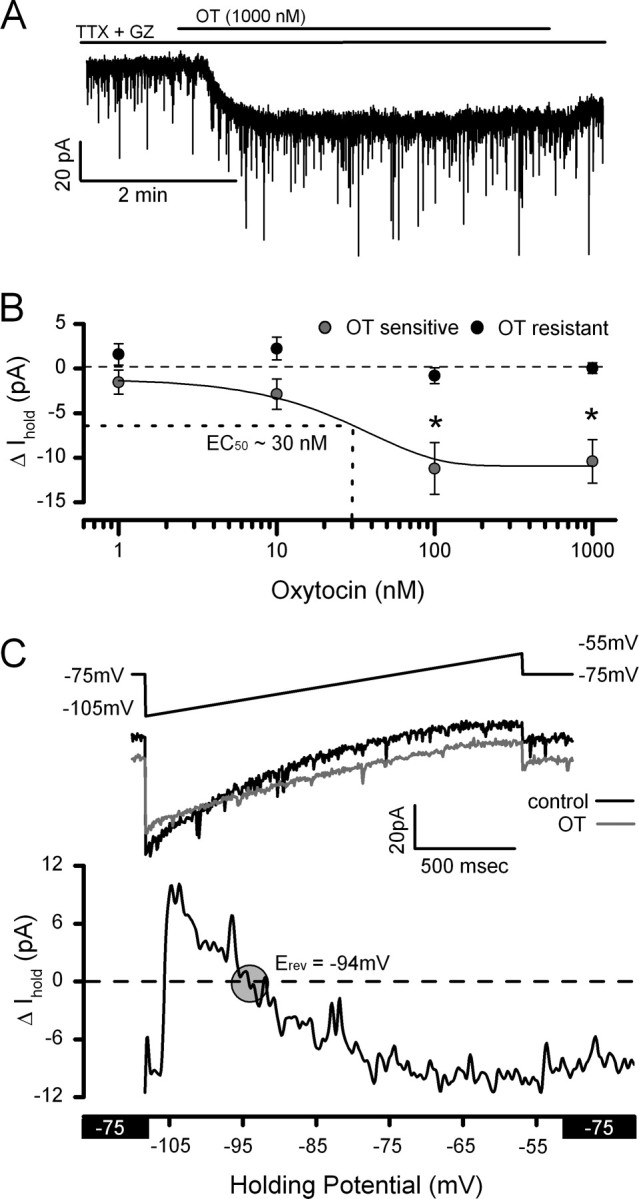
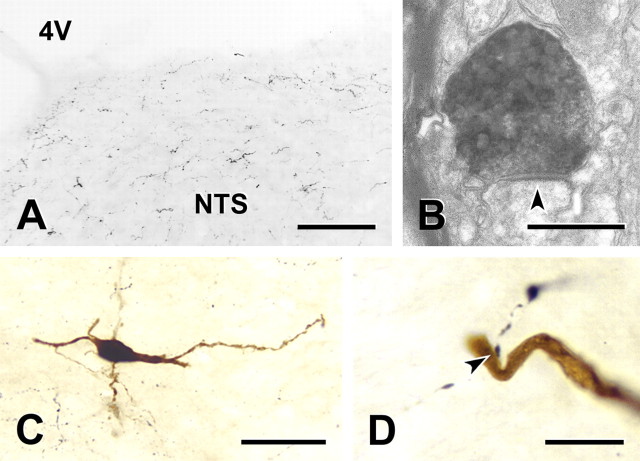
Cranial visceral afferents travel via the solitary tract (ST) to contact neurons within the ST nucleus (NTS) and activate homeostatic reflexes. Hypothalamic projections from the paraventricular nucleus (PVN) release oxytocin (OT) to modulate visceral afferent communication with NTS neurons. However, the cellular mechanisms through which OT acts are poorly understood. Here, we electrophysiologically identified second-order NTS neurons in horizontal brainstem slices by their low-jitter, ST-evoked glutamatergic EPSCs. OT increased the frequency of miniature EPSCs in half of the NTS second-order neurons (13/24) but did not alter event kinetics or amplitudes. These actions were blocked by a selective OT receptor antagonist. OT increased the amplitude of ST-evoked EPSCs with no effect on event kinetics. Variance-mean analysis of ST-evoked EPSCs indicated OT selectively increased the release probability of glutamate from the ST afferent terminals. In OT-sensitive neurons, OT evoked an inward holding current and increased input resistance. The OT-sensitive current reversed at the K(+) equilibrium potential. In in vivo studies, NTS neurons excited by vagal cardiopulmonary afferents were juxtacellularly labeled with Neurobiotin and sections were stained to show filled neurons and OT-immunoreactive axons. Half of these physiologically characterized neurons (5/10) showed close appositions by OT fibers consistent with synaptic contacts. Electron microscopy of medial NTS found immunoreactive OT within synaptic boutons. Together, these findings suggest that OT released from PVN axons acts on a subset of second-order neurons within medial NTS to enhance visceral afferent transmission via presynaptic and postsynaptic mechanisms.


Figures

Figure 1.
Figure 1.
Anatomical distribution of OT-sensitive and -resistant neurons recorded. Top, Photomicrograph of a horizontal brainstem slice oriented to contain the solitary tract (ST) and NTS. The stimulating electrode was placed on the ST distal to the recording electrode. The white dotted line represents the approximate boundary of the NTS. Scale bar, 0.4 mm. 4V, Fourth ventricle. The white band is light reflected off the polyvinyl grid used to secure the slice. Inset, Diagrammatic localization of recorded NTS neurons distributed in the horizontal plane. OT-sensitive (filled circles) and -resistant (open squares) neurons had intermixed distributions within the NTS.
Figure 2.
Figure 2.
OT selectively increases the frequency of mEPSCs. A, Representative current traces in TTX and GZ show that OT (1000 nm) increased the mEPSC frequency in an identified second-order medial NTS neuron (ST-EPSC latency = 7.70 ms with jitter = 163 μs). B, The frequency histogram of this OT-sensitive neuron demonstrates that increases in frequency occurred rapidly and were reversible after wash (bins 10 s). C, OT (gray) significantly shifted cumulative mEPSC frequencies to shorter interevent intervals (K–S test, p < 0.001). D, Normalized group averages for similarly tested OT-sensitive NTS neurons show that OT significantly increased mEPSC frequency beginning at 100 nm (n = 4–8 neurons/conc., *p < 0.05, ANOVA). These results are consistent with OT acting presynaptically to increase glutamate release onto OT-sensitive second-order NTS neurons.
Figure 3.
Figure 3.
OT has no effect on mEPSC waveforms. Individual events were fit for amplitude and decay time-constant. A, Left, OT produced no change in the amplitude distribution (K–S test, p > 0.05). A, Right, Averaged mEPSC events from an OT-sensitive NTS neuron during control and OT (1000 nm) exposure. B, Normalized group averages for similarly tested OT-sensitive NTS neurons across OT concentrations. OT had no significant effect on mEPSC amplitude or decay time-constant (n = 4–8 neurons/conc., p > 0.05, ANOVA).
Figure 4.
Figure 4.
The competitive OT-receptor antagonist ([d(CH2)51,Tyr(Me)2,Thr4,Orn8,des-Gly-NH29]-vasotocin) attenuates the OT-induced increase in mEPSC frequency. TTX and GZ were present throughout to isolate mEPSCs. A, Representative current traces show that OT (100 nm) increased the mEPSC frequency. The competitive oxytocin receptor antagonist was applied at 100-fold excess and blocked the effect of OT. B, In an OT-sensitive NTS neuron, exposure to the OT-receptor antagonist blocked the OT-induced increase in mEPSC frequency. Frequency data were grouped into 10 s bins and plotted over time. C, Normalized group data across similarly treated OT-sensitive NTS neurons under each condition. OT (100 nm) increased the frequency of isolated mEPSCs (*p > 0.05). The presence of the OT receptor antagonist (10 μm) alone did not significantly change mEPSC frequency; however, coapplication with OT (100 nm) attenuated the OT-induced increase in frequency. These results indicate that OT acts specifically via OT receptors to increase glutamate release onto OT-sensitive second-order NTS neurons.
Figure 5.
Figure 5.
Variance–mean analysis of ST–NTS transmission to assess sites of OT action. A, Reductions in external Ca2+ in a single representative second-order NTS neuron reduced the amplitude of ST-EPSCs and increased the variability. In the top left panel, current traces of ST-EPSCs over 10 consecutive trials are overlaid in each Ca2+ condition. Arrows indicate timing of ST shock. Scatter plot of amplitudes (A, bottom left panel) shows the steady state profiles of ST-EPSC amplitudes in each condition. In A (right panel), the mean values of this representative neuron for V and M associated with the three conditions were well fit by a parabolic fit (solid line, r2 = 0.99) and indicate that PR was 0.97 at 2 mm Ca2+. Because the probability of glutamate release was near maximal at 2 mm Ca2+, testing of OT on ST-EPSCs was performed at 1 mm bath Ca2+, which averaged PR = 0.63 ± 0.02 (n = 8). B, OT increased ST-EPSC amplitudes and decreased amplitude variability. B, Left, Representative current traces (10 consecutive trials overlaid) from an OT-sensitive NTS neuron before (ACSF, 1 mm Ca2+), during (OT, 1000 nm), and after OT exposure (wash). B, Right, Across sensitive neurons, OT concentration dependently increased the average ST-EPSC amplitude with no effect on the decay time constant, tau. All values were normalized to Control (n = 8). *Significant differences compared with control (*p < 0.05). C, Left, For comparison across neurons, V and M values from each neuron were normalized by dividing each value by the predicted maximum EPSC amplitude EPSCmax (at p = 1, see V–M relationship in A, right panel). Normalized release curves were not significantly different between OT-sensitive (n = 8) and OT-resistant (n = 10) neurons (p > 0.05), indicating similar release mechanisms across second-order neurons in medial NTS. C (right), Addition of OT concentration-dependently increased the PR from control under constant ionic conditions (1 mm Ca2+) along the parabolic V–M relationship indicating a selective increase in the probability of glutamate release.
Figure 6.
Figure 6.
OT increases ST-EPSC amplitude and decreases amplitude variability coincident with increased spontaneous EPSC frequency. A, Representative current traces (10 consecutive traces overlaid) from an OT-sensitive NTS neuron before (control), during (OT, 1000 nm), and after (wash) OT exposure. Experiments were performed in 1 mm Ca2+ ACSF. Top panel, Diagram of recording protocol. B, Plot of individual EPSC 1 amplitudes over time. Gray shading indicates time of OT exposure. OT rapidly and reversibly increased the mean amplitude of ST-EPSCs and decreased variability in OT-sensitive NTS neurons. Comparisons were made between control and peak OT responses (boxes). Horizontal black lines represent average EPSC amplitude. The SE bars have been removed for clarity. C, sEPSCs recorded simultaneously increased in frequency during OT exposure. Frequency data were grouped into 30 s bins and plotted over time. The dotted line represents the average control frequency. The effects of OT on both evoked and spontaneous glutamate release indicate a common presynaptic pathway through which the probability of glutamate release is increased.
Figure 7.
Figure 7.
OT increases an inward current postsynaptically. A, Representative current trace showing an OT-evoked inward current at a constant holding potential (VH = −75 mV) in an OT-sensitive neuron. Note that numerous downward inflections in the current traces represent spontaneous EPSCs. B, The OT-induced mean inward current was concentration dependent and significantly different from control at 100 nm OT (n = 4–8 neurons/conc., p < 0.05, ANOVA). Data are expressed as the mean ± SEM for each concentration. C, To better characterize the ionic basis of the OT-induced current, a depolarizing ramp protocol (−105 mV to −55 mV, top panel) was performed before (black trace) and during OT (gray trace) exposure. OT consistently increased the input resistance only in OT-sensitive NTS neurons (control: 1.31 ± 0.22 pA/mV vs OT: 1.11 ± 0.24 pA/mV, n = 4, p < 0.05). The difference curve (bottom panel) reverses near the K+ equilibrium potential (−90.5 mV). In addition to presynaptic targets, OT acts postsynaptically to close K+ channels and produce an inward current.
Figure 8.
Figure 8.
OT-containing fibers innervate NTS neurons. A, Representative light micrograph illustrates OT-immunoreactive axons within the NTS. Scale bar, 100 μm. Immunoreactive axons (black profiles) were small with fine varicosities and were distributed evenly throughout the NTS. B, Electron micrograph showing that an OT-immunoreactive terminal containing both small round and large granular vesicles forms an asymmetric synapse (arrow) on a dendrite in the NTS. Scale bar, 500 nm. C, NTS neuron that responded to cardiopulmonary afferent stimulation and was juxtacellularly filled with Neurobiotin (dark brown profile). Section immunostained to show OT-immunoreactive axons (black profiles). This second order neuron was spindle-shaped and had dendrites that could be followed for several hundred micrometers. Scale bar, 50 μm. D, An OT-immunoreactive terminal forms a close apposition (arrow) on the dendrite of the neuron whose cell body is shown in C. Scale bar, 10 μm. OT-immunoreactive terminals formed close appositions with 5 of 10 filled NTS neurons.

References

    1. Allen C, Stevens CF. An evaluation of causes for unreliability of synaptic transmission. Proc Natl Acad Sci U S A. 1994;91:10380–10383. - PMC - PubMed
    1. Andresen MC, Kunze DL. Nucleus tractus solitarius: gateway to neural circulatory control. Annu Rev Physiol. 1994;56:93–116. - PubMed
    1. Andresen MC, Yang MY. Non-NMDA receptors mediate sensory afferent synaptic transmission in medial nucleus tractus solitarius. Am J Physiol. 1990;259:H1307–H1311. - PubMed
    1. Bailey TW, Jin Y-H, Doyle MW, Smith SM, Andresen MC. Vasopressin inhibits glutamate release via two distinct modes in the brainstem. J Neurosci. 2006;26:6131–6142. - PMC - PubMed
    1. Barberis C, Tribollet E. Vasopressin and oxytocin receptors in the central nervous system. Crit Rev Neurobiol. 1996;10:119–154. - PubMed

Publication types

MeSH terms

LinkOut - more resources