. 2009 Jan;85(1):34-43.
doi: 10.1189/jlb.0208101. Epub 2008 Sep 26.

Chronic ethanol induces inhibition of antigen-specific CD8+ but not CD4+ immunodominant T cell responses following Listeria monocytogenes inoculation

Affiliations

Chronic ethanol induces inhibition of antigen-specific CD8+ but not CD4+ immunodominant T cell responses following Listeria monocytogenes inoculation

Prajwal Gurung et al. J Leukoc Biol. 2009 Jan.

Abstract

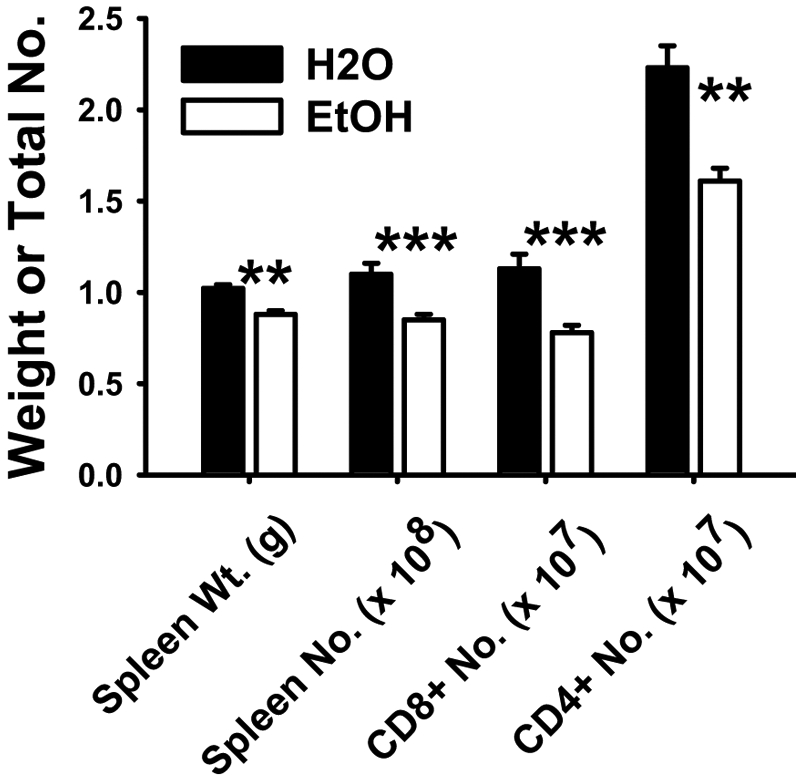
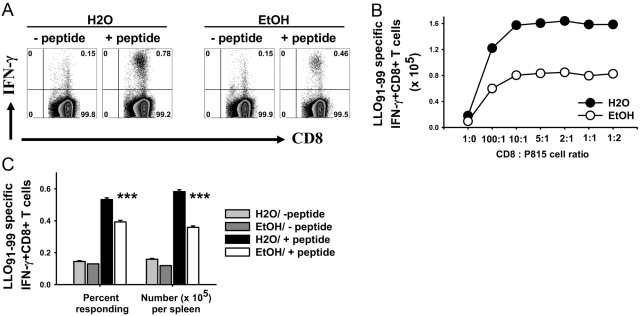
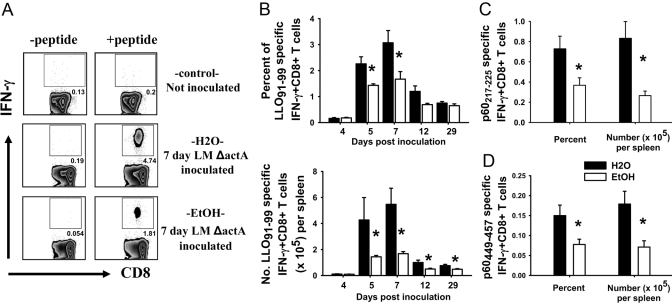
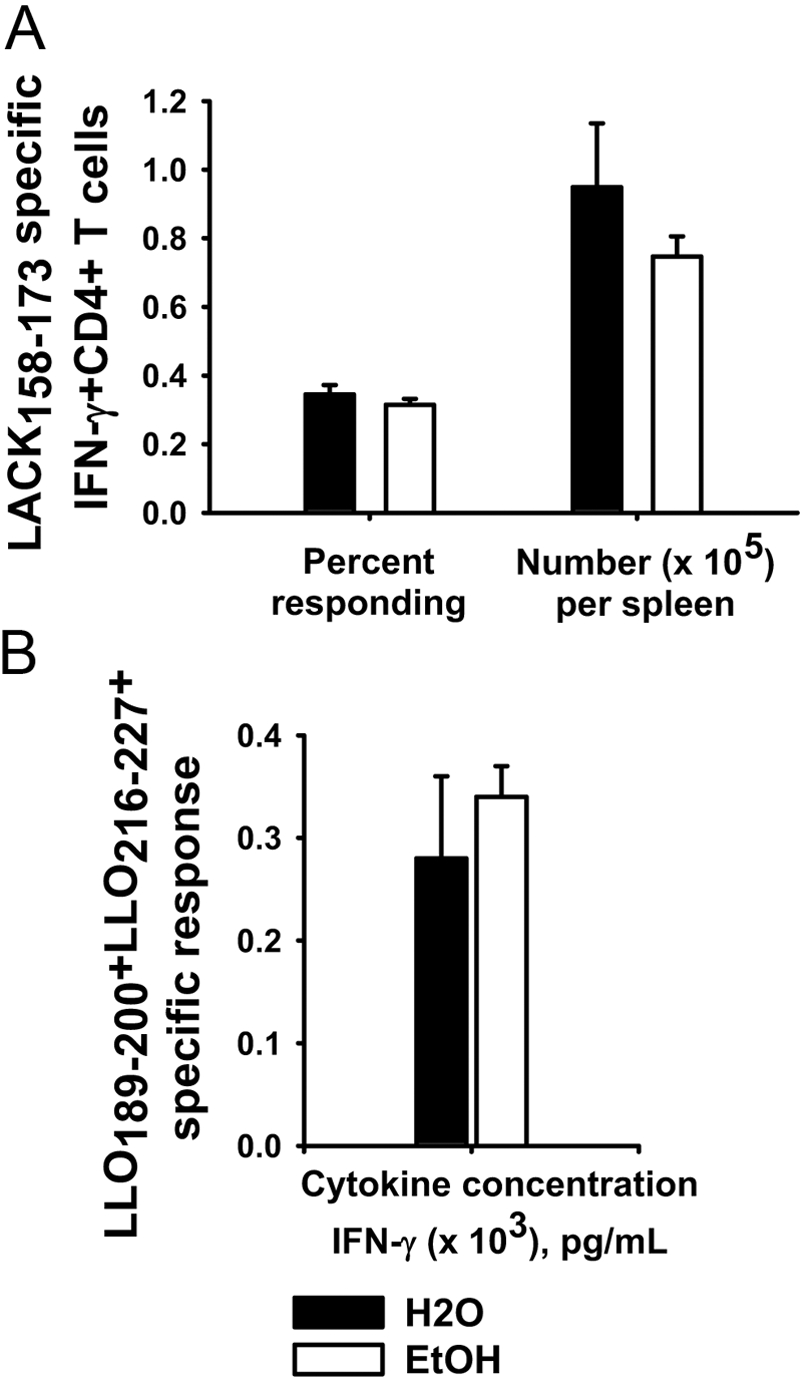
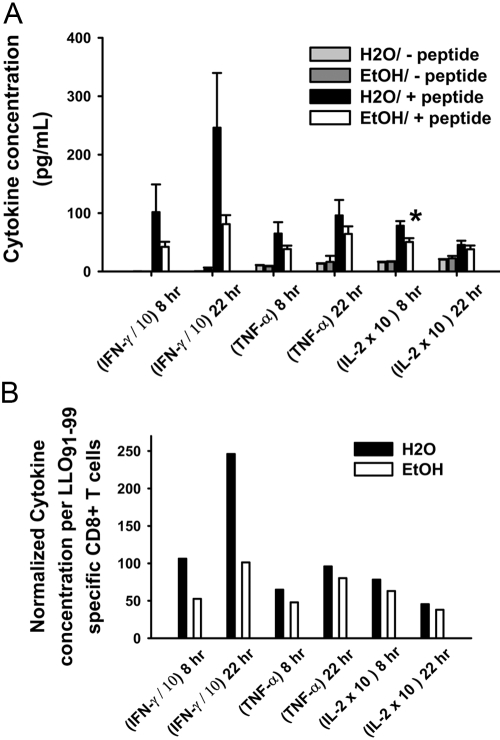
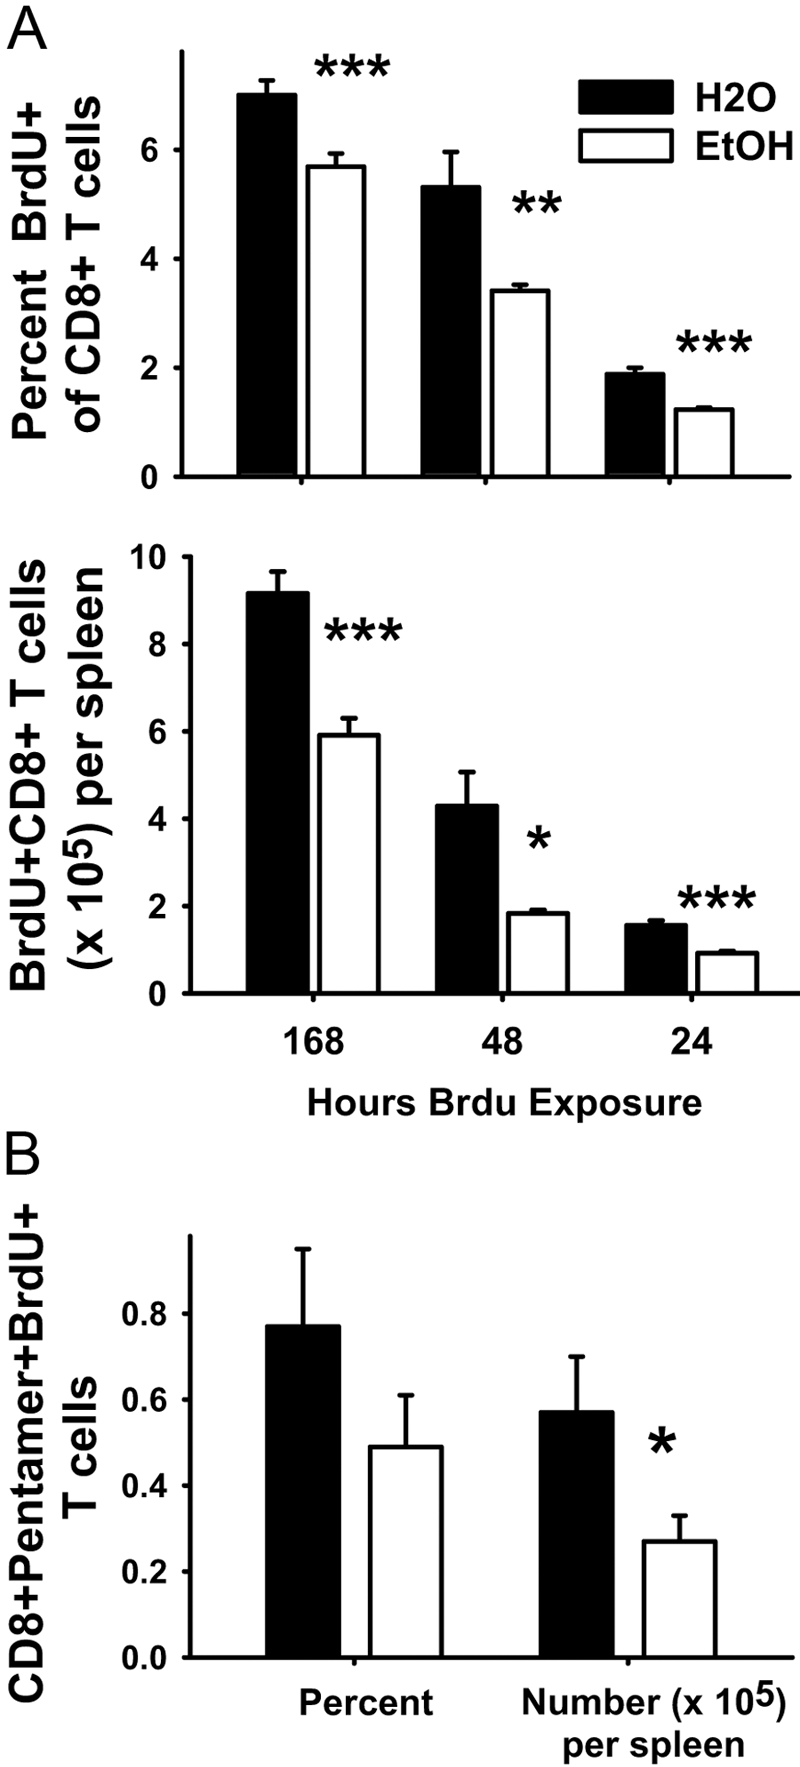
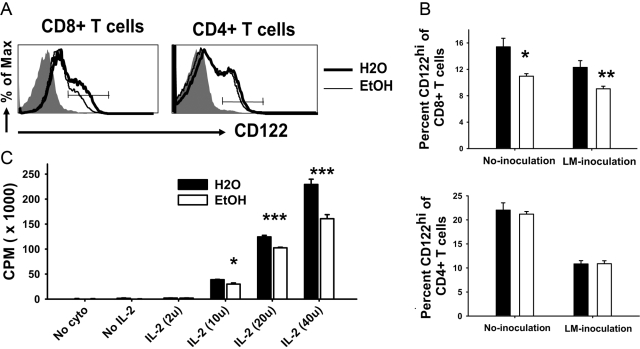
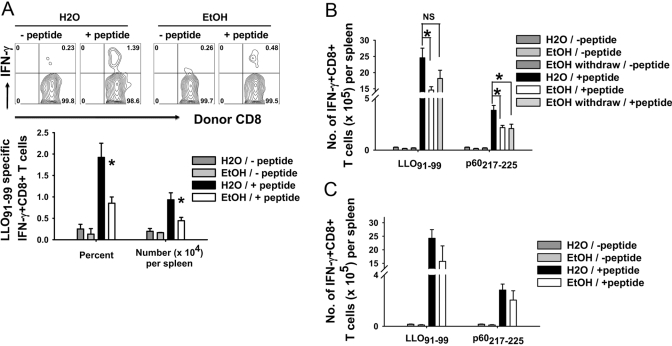
Chronic ethanol consumption results in immunodeficiency. Previous work with chronic ethanol-fed mice has shown reduced splenic weight and cellularity, including reduced numbers of CD8+ T cells. However, antigen-specific CD8+ and CD4+ T cell responses in chronic ethanol-fed mice have been studied relatively little. We have used an attenuated Listeria monocytogenes strain DPL 1942 (LM DeltaactA) to inoculate mice and subsequently used CD4+ and CD8+ immunodominant peptides of LM to measure the CD4+ and CD8+ T cell responses after chronic ethanol exposure. We found no major differences between control and ethanol-fed mice in the kinetics and persistence of antigen-specific CD4+ T cells in response to an immunodominant LM peptide, as measured by intracellular IFN-gamma staining. In contrast to CD4+ responses, three methods of in vitro antigen presentation indicated that the primary response of CD8+ T cells to several different epitopes was reduced significantly in mice chronically fed ethanol. Antigen-specific CD8+ T cells were also reduced in chronic ethanol-fed mice during the contraction phase of the primary response, and memory cells evaluated at 29 and 60 days after inoculation were reduced significantly. BrdU proliferation assays showed that in vivo proliferation of CD8+ T cells was reduced in ethanol-fed mice, and IL-2-dependent in vitro proliferation of naive CD8+ T cells was also reduced. In conclusion, these results suggest that antigen-specific CD4+ T cell responses to LM are affected little by chronic ethanol consumption; however, antigen-specific CD8+ T cell responses are reduced significantly, as are in vivo and in vitro proliferation. The reduction of antigen-specific CD8+ T cells may contribute strongly to the immunodeficiency caused by ethanol abuse.


Figures

Fig. 1.
Fig. 1.
Splenic weight, total cellularity, and T cell numbers in chronic ethanol-consuming mice. Six-week ethanol-administered and matched water control BALB/c female mice were inoculated with LM ΔactA. Mice were killed 7 days post-LM ΔactA inoculation, and spleens were harvested. Spleen weights, total splenocytes/spleen, total number of CD8+ and CD4+ T cells/spleen were measured. N(H2O) = 12; N(EtOH) = 12; **, P < 0.01; ***, P < 0.001.
Fig. 2.
Fig. 2.
Antigen presentation assay. (A) MACS-purified CD8+ T cells from 7-day-inoculated, 32-week ethanol-consuming or control BALB/c female mice were cultured with the LLO91–99 peptide-loaded P815 cell at a 5:1 ratio in the presence of Brefeldin A for 6 h. As a control, CD8+ T cells were cultured with P815 cells not loaded with peptide. Flow cytometry data of one water- and ethanol-administered group in the absence or presence of the LLO91–99 peptide. (B) CD8+ T cells from 7-day-inoculated, 28-week ethanol-consuming and matched control BALB/c female mice were cultured with LLO91–99 peptide-loaded P815 cells at different ratios in the presence of Brefeldin A for 6 h at 37°C. Responding CD8+ T cells were analyzed by intracellular IFN-γ staining. Control wells contained no P815 cells. (C) Statistical analysis of the data shown in A from all mice in the groups; N(H20) = 9; N(EtOH) = 6; ***, P < 0.001.
Fig. 3.
Fig. 3.
Antigen-specific CD8+ T cell responses. (A) Representative flow cytometry plots of noninoculated and water- and ethanol-administered CD8+ T cells with or without the LLO91–99 peptide at 7 days post-LM ΔactA LACK inoculation. Flow cytometry plots are gated on CD8+ T cells. (B–D) BALB/c female mice consuming ethanol and water for 4–44 weeks were inoculated with LM ΔactA or LM ΔactA LACK; spleens were harvested at different days postinoculation and splenocytes cultured 6 h. Time course of LLO91–99-specific CD8+ T cells as percent responding (B, upper) and total number per spleen (B, lower) in water- and chronic ethanol-consuming mice as determined by intracellular IFN-γ staining. Four days, N(H2O) = 4; N(EtOH) = 6. Five days, N(H2O) = 3; N(EtOH) = 4. Seven days, N(H20) = 7; N(EtOH) = 6. Twelve days, N(H2O) = 8; N(EtOH) = 8. Twenty-nine days, N(H2O) = 8; N(EtOH) = 7. (C) p60217–225-specific and (D) p60449–457-specific CD8+ T cell responses at 7 days post-LM ΔactA LACK inoculation; N(H2O) = 7; N(EtOH) = 6; *, P < 0.05.
Fig. 4.
Fig. 4.
Antigen-specific CD4+ T cells. Chronic ethanol- or water-administered BALB/c female mice were inoculated with 1 × 10⁷ cfu LM ΔactA LACK. Mice were killed at 7 days after inoculation, and antigen-specific CD4+ T cell responses were measured in splenocyte cultures. (A) Frequency and total number of LACK158–173-specific CD4+ T cells were measured by intracellular cytoplasmic staining for IFN-γ. (B) Splenocytes were incubated at the same time with two CD4-specific subdominant peptides (LLO189–200+LLO216–227) for 96 h, and supernatants were collected and analyzed for IFN-γ; N(H2O) = 4; N(EtOH) = 4.
Fig. 5.
Fig. 5.
Cytokine production after CD8-specific LLO91–99 peptide restimulation. (A) BALB/c female mice consuming ethanol in water for 4 or 6 weeks were inoculated with LM ΔactA, and spleens were harvested 7 days postinoculation. Whole splenocytes (2×10⁶) were cultured with 10−7M LLO91–99 peptide for 8- and 22-h durations. Supernatants were analyzed using a Th1/Th2 cytokine bead assay. (B) Values from the above experiments were normalized to evaluate cytokines produced per antigen-specific CD8+ T cells. For normalization, ethanol cytokine values were multiplied by an antigen-specific CD8+ T cell ratio of water and ethanol; i.e., ratio = percent antigen-specific CD8+ T cells (H2O/ethanol). IFN-γ values were divided by 10, and IL-2 values were multiplied by 10 to fit in the same graph; N(H2O) = 7; N(EtOH) = 8; *, P < 0.05.
Fig. 6.
Fig. 6.
In vivo CD8+ T cell proliferation assays. (A) In vivo total CD8+ T cell proliferation assays. (Upper panel) Percent BrdU+CD8+ T cells and (lower panel) numbers of BrdU+CD8+ T cells per spleen. Ethanol- and water-administered BALB/c female mice (9–32 weeks) were inoculated with LM ΔactA i.p. One hundred sixty-eight hours: BrdU was injected with LM ΔactA and added to the drinking water or ethanol of water and ethanol mice, which were killed 7 days after LM ΔactA inoculation and BrdU injection; N(H2O) = 8; N(EtOH) = 8. Forty-eight hours: BrdU was injected 5 days after LM ΔactA inoculation and then added to drinking water or ethanol of water and ethanol mice, which were killed 7 days after LM ΔactA inoculation and 2 days after BrdU injection; N(H2O) = 4; N(EtOH) = 5. Twenty-four hours: BrdU was injected 5 days after LM ΔactA inoculation, and mice were killed the next day, i.e., 6 days after LM ΔactA inoculation. BrdU was not added in drinking water or ethanol; N(H2O) = 4; N(EtOH) = 6. Intracellular cytoplasmic staining was performed for BrdU. (B) In vivo antigen-specific CD8+ T cell proliferation. Ethanol (14 weeks)-administered BALB/c female mice and water mice were inoculated with LM ΔactA. Five days after inoculation, BrdU was administered as described for the 48-h exposure (A), and splenocytes were harvested at the peak of the response (Day 7). Whole splenocytes were surface-stained with PerCP-conjugated CD8 mAb and APC-conjugated LLO91–99-loaded class I MHC pentamer and intracellularly stained for incorporated BrdU; N(H20) = 4; N(EtOH) = 4; *, P < 0.05; **, P < 0.01; ***, P < 0.001.
Fig. 7.
Fig. 7.
IL-2R expression and in vitro proliferation of CD8+ T cells. (A) Histogram of CD122 (IL-2Rβ chain) expression on CD8+ and CD4+ T cells from control and 9- to 32-week ethanol-administered BALB/c female mice, as analyzed by flow cytometry. Shaded gray is the isotype control; thick black line is water; and thin line is ethanol CD8+ or CD4+ T cells. A line across the histogram denotes CD122hi populations. (B) Total percentages of CD8+CD122hi (left) and CD4+CD122hi (right) T cells are shown as bar graphs. Some mice were inoculated with 5 × 10⁵ cfu LM ΔactA to generate immune CD8+ T cells. No inoculation, N(H2O) = 8; N(EtOH) = 6. LM ΔactA inoculation, N(H2O) = 12; N(EtOH) = 16. (C) In vitro proliferation of splenic CD8+CD44low T cells. Sort-purified CD8+CD44low T cells from 19-week, ethanol-consuming and control mice were cultured with soluble anti-CD3 mAb, IL-12p70, IFN-α, and increasing concentrations of IL-2 for 3 days. After 3 days, cells were pulsed with 3H-thymidine for 6 h, and the uptake of 3H-thymidine was measured using standard liquid scintillation analysis. One of two similar experiments. No cyto, No added cytokines; No IL-2, no IL-2 added; and IL-2 (2u), units IL-2 added. *, P < 0.05; **, P < 0.01; ***, P < 0.001.
Fig. 8.
Fig. 8.
Secondary CD8+ T cell responses to LM ΔactA LACK reinoculation. (A) Thy 1.2 BALB/c control and 8-week ethanol-administered mice were inoculated with LM and continued on their respective diets. Forty-four days later, 5 × 10⁶ MACS-purified, splenic CD8+ T cells were adoptively transferred to Thy1.1 water mice i.v. Recipient Thy1.1 water mice were inoculated with LM ΔactA LACK 1 day later, and the secondary response of donor-immune Thy1.2+CD8+ T cells was analyzed by intracellular cytoplasmic staining for IFN-γ on Day 5 after inoculation. Thy 1.1 recipients received water source cells N(H2O) = 4 or ethanol source cells N(EtOH) = 6. (B) Water- and 46-week chronic ethanol-administered mice were inoculated with LM ΔactA LACK. Twenty days following inoculation, some ethanol-administered mice were withdrawn from ethanol for 15 days. All three groups—H2O, EtOH, and EtOH-withdrawn mice—were reinoculated with LM ΔactA LACK, and the secondary CD8+ T cell responses were measured on Day 5. N(H2O) = 4; N(EtOH) = 5; N(EtOH withdrawn) = 5. (C) Normal water mice (no ethanol history) were inoculated with LM ΔactA LACK. Sixteen days postinoculation, some water mice were started on EtOH. After 5 weeks of EtOH administration, mice were reinoculated with LM ΔactA LACK, and the secondary CD8+ T cell responses were measured on Day 5 by intracellular cytoplasmic staining for IFN-γ. N(H2O) = 5; N(EtOH) = 3; *, P < 0.05. NS, Not significant.

References

    1. Breitkopf K, Hass S, Wiercinska E, Singer M V, Dooley S. Anti-TGF-β strategies for the treatment of chronic liver disease. Alcohol Clin Exp Res. 2005;29:121S–131S. - PubMed
    1. Cook R T. Alcohol abuse, alcoholism, and damage to the immune system—a review. Alcohol Clin Exp Res. 1998;22:1927–1942. - PubMed
    1. Cook R T, Zhu X, Coleman R A, Ballas Z K, Waldschmidt T J, Ray N B, LaBrecque D R, Cook B L. T-cell activation after chronic ethanol ingestion in mice. Alcohol. 2004;33:175–181. - PubMed
    1. Happel K I, Nelson S. Alcohol, immunosuppression, and the lung. Proc Am Thorac Soc. 2005;2:428–432. - PubMed
    1. Lewohl J M, Wixey J, Harper C G, Dodd P R. Expression of MBP, PLP, MAG, CNP, and GFAP in the human alcoholic brain. Alcohol Clin Exp Res. 2005;29:1698–1705. - PubMed

Publication types

MeSH terms