. 2008:4:162.
doi: 10.1038/msb.2008.4. Epub 2008 Mar 4.

eQED: an efficient method for interpreting eQTL associations using protein networks

Affiliations

eQED: an efficient method for interpreting eQTL associations using protein networks

Silpa Suthram et al. Mol Syst Biol. 2008.

Abstract

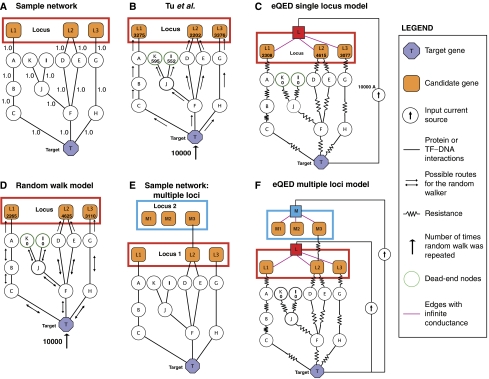
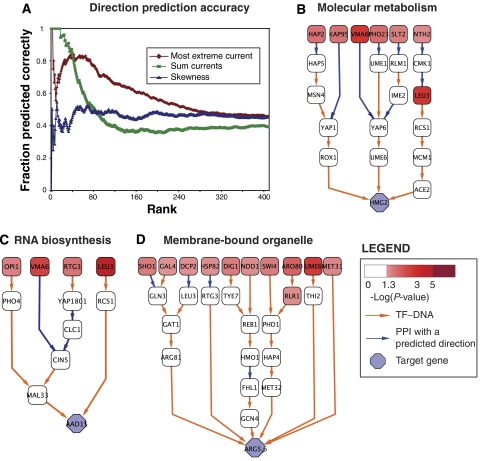
Analysis of expression quantitative trait loci (eQTLs) is an emerging technique in which individuals are genotyped across a panel of genetic markers and, simultaneously, phenotyped using DNA microarrays. Because of the spacing of markers and linkage disequilibrium, each marker may be near many genes making it difficult to finely map which of these genes are the causal factors responsible for the observed changes in the downstream expression. To address this challenge, we present an efficient method for prioritizing candidate genes at a locus. This approach, called 'eQTL electrical diagrams' (eQED), integrates eQTLs with protein interaction networks by modeling the two data sets as a wiring diagram of current sources and resistors. eQED achieved a 79% accuracy in recovering a reference set of regulator-target pairs in yeast, which is significantly higher than the performance of three competing methods. eQED also annotates 368 protein-protein interactions with their directionality of information flow with an accuracy of approximately 75%.


Figures

Figure 1
Figure 1
Examples of the electrical circuit approach and the eQED model. (A) Sample network. (B) The ‘greedy' random walk approach by Tu et al (2006). (C) The single-locus model of eQED. Gene T in the blue octagon is the target gene. The locus marked by the red box, containing candidate genes L1, L2 and L3, associates significantly with the target T. The numbers next to the locus genes correspond to the number of times they were visited in the random walk approaches or the amount of current through them in the electric circuit approach. (D) The random walk derived from (C). (E) The sample network with two significant loci. (F) The multiple-loci model of eQED.
Figure 2
Figure 2
Flowchart of the eQED method.
Figure 3
Figure 3
Inferred pathways and directionality prediction. (A) The accuracy of the direction prediction methods. The ‘gold' standard protein interactions were ranked according to the different metrics (x-axis), and the cumulative percent accuracy represented as y-axis. (BD) The regulatory networks for three example target genes. The nodes colored in shades of red correspond to predicted causal genes. The intensity of color corresponds to their P-value of association with the target.

References

    1. Albert-László Barabási RA (1999) Emergence of scaling in random networks. Science 286: 509–512 - PubMed
    1. Berger MF, Philippakis AA, Qureshi AM, He FS, Estep PW III, Bulyk ML (2006) Compact, universal DNA microarrays to comprehensively determine transcription-factor binding site specificities. Nat Biotechnol 24: 1429–1435 - PMC - PubMed
    1. Beyer A, Bandyopadhyay S, Ideker T (2007) Integrating physical and genetic maps: from genomes to interaction networks. Nat Rev Genet 8: 699–710 - PMC - PubMed
    1. Beyer A, Workman C, Hollunder J, Radke D, Möller U, Wilhelm T, Ideker T (2006) Integrated assessment and prediction of transcription factor binding. PLoS Comput Biol 2: e70. - PMC - PubMed
    1. Brem RB, Kruglyak L (2005) The landscape of genetic complexity across 5700 gene expression traits in yeast. Proc Natl Acad Sci USA 102: 1572–1577 - PMC - PubMed

Publication types

LinkOut - more resources