Comparative Study
. 2008 Jan;27(2):284-93.
doi: 10.1111/j.1460-9568.2007.06000.x. Epub 2008 Jan 8.

Parkin occurs in a stable, non-covalent, approximately 110-kDa complex in brain

Affiliations
Comparative Study

Parkin occurs in a stable, non-covalent, approximately 110-kDa complex in brain

Cindy Van Humbeeck et al. Eur J Neurosci. 2008 Jan.

Abstract

Mutations in the gene for parkin, a 52-kDa E3 ubiquitin ligase, are a major cause of hereditary Parkinson's disease (PD). In vitro studies have identified a large number of parkin-interacting proteins. Whether parkin exists as a monomer or as part of a stable protein complex in vivo is uncertain. Here we demonstrate that endogenous parkin occurs in a stable, non-covalent, approximately 110-kDa complex in native extracts from mouse brain, heart and skeletal muscle, while monomeric parkin is undetectable. Partial denaturation experiments indicate that this complex is at least a tetramer. Reported parkin-binding partners do not show detectable association with the parkin complex on native gels. Upon overexpression in COS1, SH-SY5Y or CHO cells, parkin accumulates predominantly as a monomer, suggesting that the interactors required for complex formation are available in limiting amounts in these cells. Importantly, PD-linked parkin mutations significantly impair parkin complex formation. These data demonstrate that parkin oligomerizes into a stable, non-covalent, heteromeric complex in vivo, and suggest that parkin may have as yet unidentified stable binding partners.


Figures
F<sc>ig</sc>. 1
Fig. 1
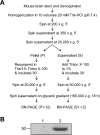
Tissue extraction, glycerol gradient centrifugation and blue-native-polyacrylamide gel electrophoresis (BN-PAGE) procedure. (A) Schematic overview of the procedure. (B) Mouse brain stem and diencephalon were homogenized as described in Materials and methods, and centrifuged at 350 g for 5 min. The pellet (Lane 1) and supernatant (Lane 2) obtained after the 350 g spin were compared for parkin content. SDS was added to the supernatant at a final concentration of 2%, and the pellet was resuspended in 2% SDS/20 mm Tris, pH 7.4. After boiling for 10 min and centrifugation at 14 000 g for 5 min, 60 µg of protein extract was loaded in each lane and examined by SDS–PAGE and Western blotting with the monoclonal anti-parkin antibody PRK109. The mobility of a 50-kDa molecular weight marker is shown on the left of the blot.
F<sc>ig</sc>. 2
Fig. 2
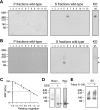
BN-PAGE reveals a stable, non-covalent, ∼110-kDa parkin complex in brain. (A and B) Extracts of brain stem and diencephalon from wild-type and parkin knockout (KO) mice were separated into pellet (P) and supernatant (S) fractions, as described in Materials and methods and Fig. 1A. P and S fractions were further fractionated by glycerol gradient centrifugation. Twelve P and 12 S fractions (numbered from the top of the glycerol gradient to the bottom) were analysed by BN-PAGE, followed by Western blotting with either the polyclonal anti-parkin antibody CS2132 (A) or the monoclonal anti-parkin antibody PRK109 (B) The CS2132 antibody detected a 450–550-kDa band in fraction S6, which was also found in parkin-null extract (A). By contrast, the PRK109 antibody (B) revealed a band in fraction S5 at a lower molecular weight (indicated by the arrow), which was absent in parkin knockout brain. The PRK109 antibody also showed some minor, non-specific immunoreactivity at higher molecular weights (indicated by the asterisk) in S5 from both wild-type and parkin knockout. (C) The graph shows how BN gels were calibrated based on the relative mobilities of native protein size markers to determine the molecular weight (MW) of the parkin complex. Markers, denoted by black circles, were thyroglobulin (669 kDa), ferritin (440 kDa), catalase (232 kDa), lactate dehydrogenase (140 kDa) and bovine serum albumin (67 kDa). The dotted line indicates the estimated MW of the parkin complex. (D) In the left and middle panels, heating brain fraction S5 at 100 °C in 1.5% sodium dodecyl sulphate (SDS) for 10 min immediately prior to BN-PAGE disrupted the ∼110-kDa parkin complex and led to the appearance of monomeric parkin (indicated by the arrow). In the rightmost panel, approximately 50 ng of purified recombinant parkin was analysed by BN-PAGE and Western blot with PRK109 without heat treatment or addition of SDS, revealing a band (indicated by the arrow) with apparent molecular weight (∼50 kDa) consistent with that of monomeric parkin. (E) Omission of Triton X-100 from the extraction protocol did not change the native molecular mass of the parkin complex from brain or the amount of parkin extracted. Numbers to the left of (A), (B), (D) and (E) indicate MWs of the native protein size markers.
F<sc>ig</sc>. 3
Fig. 3
Demonstration of the parkin complex in brain by gel filtration chromatography. (A) Fraction S prepared in the absence of detergents was applied to a gel filtration column. Fractions of 0.5 mL were eluted from the column and fractions 11–70 were analysed with dot blot for parkin using the PRK109 antibody. Fraction numbers are indicated to the left of the blot. Molecular weights (MWs) indicate the elution patterns of the protein size markers thyroglobulin (669 kDa), ferritin (440 kDa), lactate dehydrogenase (140 kDa), bovine serum albumin (67 kDa), vitamin D-binding protein (55 kDa) and protein phosphatase 2A phosphatase activator (36 kDa). (B) Calibration graph of the gel filtration column. The black circles denote the protein size markers. Kav = (VeVo)/(VtVo), where Ve = elution volume, Vo = void volume and Vt = total column volume. The dotted line indicates the estimated MW of the parkin complex.
F<sc>ig</sc>. 4
Fig. 4
Formation of the ∼110-kDa parkin complex is conserved across tissues. S fractions were prepared from mouse heart, skeletal muscle and brain (Br.). The samples were analysed with glycerol gradient centrifugation, BN-PAGE and Western blotting with the monoclonal anti-parkin antibody PRK8. The arrow indicates the position of the ∼110-kDa parkin complex.
F<sc>ig</sc>. 5
Fig. 5
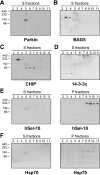
Known parkin-interacting proteins do not show detectable association with parkin on native gels. (A–F) S and P fractions from brain were separated by glycerol gradient centrifugation and BN-PAGE, followed by Western blotting for the protein indicated. The dotted ellipses indicate the position of the parkin band, as determined by reprobing each blot with anti-parkin.
F<sc>ig</sc>. 6
Fig. 6
Lack of a detectable stable complex of parkin with tubulin. (A) Fraction S from brain was separated by glycerol gradient centrifugation, and fractions S4–S6 were analysed by BN-PAGE and Western blotting for parkin, α-tubulin or β-tubulin (β-Tub.). The dotted ellipses indicate the position of the parkin band, as determined by reprobing each blot with anti-parkin. In the rightmost panel, fraction S was boiled in 1.5% sodium dodecyl sulphate (SDS) for 10 min before BN-PAGE to identify the monomeric tubulin band. (B) Fractions S4–S6 were incubated for 90 min with 5 µg of control rabbit IgG, rabbit anti-α-tubulin (Tub. Ab), or buffer alone (Tris) before BN-PAGE. After Western blotting (WB) with mouse anti-α-tubulin (left panel), the blot was stripped and reprobed with mouse anti-parkin (right panel). Pre-incubation with polyclonal anti-α-tubulin fully shifted the α-tubulin bands to higher molecular weights due to antibody binding and cross-linking of tubulin complexes (left panel), but did not shift the parkin band (right panel). (C) The migration pattern of native β-tubulin from parkin knockout (KO) brain is similar to that in the wild-type extracts shown in (A).
F<sc>ig</sc>. 7
Fig. 7
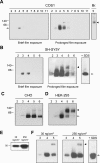
Overexpressed parkin accumulates predominantly as a monomer in several cell lines. (A) COS1 cells were transiently transfected with parkin and extracted in 1% Triton X-100, followed by glycerol gradient centrifugation of the extract. Glycerol gradient fractions 2–11 were analysed by BN-PAGE and immunoblotting for parkin. Upon overexpression parkin migrated as a monomer (indicated by the arrow on the left of the first panel). After more prolonged film exposure, a small amount of the ∼110-kDa complex was detected, as illustrated by comparison with the endogenous parkin band (indicated by the arrowhead) from brain (Br.). (B–D) SH-SY5Y (B), CHO (C) and HEK-293 (D) cells were transiently transfected with parkin and extracted in 1% Triton X-100. Glycerol gradient fractions 2–6 were analysed by BN-PAGE and immunoblotting for parkin. (B) The results of both brief and more prolonged film exposure are shown. In the rightmost panel of (B), total Triton-soluble extract from transfected SH-SY5Y cells was boiled in 1.5% SDS for 10 min immediately before BN-PAGE to identify the monomeric parkin band. The arrows and arrowheads indicate monomeric parkin and the ∼110-kDa parkin complex, respectively. (E) Either 30 or 250 ng of parkin cDNA was transfected per cm2 of COS1 cell culture. For each transfection condition, 20 µg of total protein extract was examined by sodium dodecyl sulphate (SDS)–PAGE and Western blotting, showing different total parkin expression levels. The mobility of a 50-kDa molecular weight marker is shown on the left of the blot. (F) Extracts of COS1 cells transfected with either 30 or 250 ng of parkin cDNA per cm2 were analysed by glycerol gradient centrifugation, and fractions 3–5 were subjected to BN-PAGE and parkin immunoblotting to visualize monomer (arrow) and ∼110-kDa complex (arrowhead). In the right panel, total Triton-soluble extract from COS1 cells transfected with 250 ng/cm2 of parkin cDNA was boiled in 1.5% SDS for 10 min immediately before BN-PAGE to identify the monomeric parkin band. When only 10 ng/cm2 of parkin cDNA was transfected, the protein was not detectable with the glycerol gradient centrifugation and BN-PAGE assay (not shown).
F<sc>ig</sc>. 8
Fig. 8
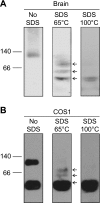
Partial dissociation of the parkin complex. (A) Heating fraction S from brain to 65 °C for 10 min in 1.5% sodium dodecyl sulphate (SDS) before BN-PAGE led to the appearance of three parkin bands (indicated by the arrows), suggesting that the ∼110-kDa complex was at least a tetramer. In the rightmost panel, fraction S was heated to 100 °C in 1.5% SDS for 10 min before BN-PAGE to dissociate the parkin complex completely and identify the position of the monomeric parkin band. (B) COS1 cells were transiently transfected with parkin and extracted in 1% Triton X-100. The cell extracts were treated in the same way as the brain extracts in (A).
F<sc>ig</sc>. 9
Fig. 9
Comparison of ∼110-kDa complex formation between wild-type (WT) parkin and PD-linked parkin variants. COS1 cells were transiently transfected with 70 ng/cm2 of WT or R256C mutant parkin cDNA, 50 ng/cm2 of A82E or K161N parkin cDNA, 30 ng/cm2 of K211N cDNA and 120 ng/cm2 of R275W cDNA. (A) Transfected COS1 cells were extracted in 1% Triton X-100, followed by glycerol gradient centrifugation of the extracts. Fractions 2–6 of the gradient were analysed by BN-PAGE and parkin immunoblotting to visualize monomer (arrowhead) and ∼110-kDa complex (arrow). (B) In the experiments shown in (A), the amounts of parkin complex and parkin monomer were quantified. The graph represents the amount of parkin complex, expressed as a percentage of the sum of parkin complex and monomer. Asterisks denote significant difference (P < 0.05) from WT. (C and D) In parallel with each of the experiments shown in (A and B), 15 µg of Triton-soluble protein extract was analysed with SDS–PAGE and parkin immunoblotting to compare soluble parkin protein levels between WT and mutant variants. At the low signal intensity of the blots shown in (C), parkin appeared as a doublet due to the presence of an N-terminally truncated parkin species generated through an internal translation initiation site (Henn et al., 2005). No endogenous parkin signal could be observed by SDS–PAGE in untransfected (Untransf.) COS1 cells (C), except after very prolonged film exposures (not shown). The graph in (D) shows SDS–PAGE and Western blot quantification of the Triton-soluble parkin levels. Within each experiment, the level of the parkin mutants was normalized to that of WT parkin. There were no significant differences in soluble parkin levels between WT, A82E, K161N, K211N or R256C (P = 0.96 by one-way anova).

References

    1. Baulac S, Lavoie MJ, Strahle J, Schlossmacher MG, Xia W. Dimerization of Parkinson's disease-causing DJ-1 and formation of high molecular weight complexes in human brain. Mol. Cell. Neurosci. 2004;27:236–246. - PubMed
    1. Capell A, Grunberg J, Pesold B, Diehlmann A, Citron M, Nixon R, Beyreuther K, Selkoe DJ, Haass C. The proteolytic fragments of the Alzheimer's disease-associated presenilin-1 form heterodimers and occur as a 100–150-kDa molecular mass complex. J. Biol. Chem. 1998;273:3205–3211. - PubMed
    1. Chung KK, Zhang Y, Lim KL, Tanaka Y, Huang H, Gao J, Ross CA, Dawson VL, Dawson TM. Parkin ubiquitinates the α-synuclein-interacting protein, synphilin-1: implications for Lewy-body formation in Parkinson disease. Nat. Med. 2001;7:1144–1150. - PubMed
    1. Corti O, Hampe C, Koutnikova H, Darios F, Jacquier S, Prigent A, Robinson JC, Pradier L, Ruberg M, Mirande M, Hirsch E, Rooney T, Fournier A, Brice A. The p38 subunit of the aminoacyl-tRNA synthetase complex is a parkin substrate: linking protein biosynthesis and neurodegeneration. Hum. Mol. Genet. 2003;15:1427–1437. - PubMed
    1. Dachsel JC, Lücking CB, Deeg S, Schultz E, Lalowski M, Casademunt E, Corti O, Hampe C, Patenge N, Vaupel K, Yamamoto A, Dichgans M, Brice A, Wanker EE, Kahle PJ, Gasser T. Parkin interacts with the proteasome subunit α4. FEBS Lett. 2005;579:3913–3919. - PubMed

Publication types