. 2007:3:129.
doi: 10.1038/msb4100170. Epub 2007 Jul 31.

Increased glycolytic flux as an outcome of whole-genome duplication in yeast

Affiliations

Increased glycolytic flux as an outcome of whole-genome duplication in yeast

Gavin C Conant et al. Mol Syst Biol. 2007.

Erratum in

  • Mol Syst Biol. 2008;4():204

Abstract

After whole-genome duplication (WGD), deletions return most loci to single copy. However, duplicate loci may survive through selection for increased dosage. Here, we show how the WGD increased copy number of some glycolytic genes could have conferred an almost immediate selective advantage to an ancestor of Saccharomyces cerevisiae, providing a rationale for the success of the WGD. We propose that the loss of other redundant genes throughout the genome resulted in incremental dosage increases for the surviving duplicated glycolytic genes. This increase gave post-WGD yeasts a growth advantage through rapid glucose fermentation; one of this lineage's many adaptations to glucose-rich environments. Our hypothesis is supported by data from enzyme kinetics and comparative genomics. Because changes in gene dosage follow directly from post-WGD deletions, dosage selection can confer an almost instantaneous benefit after WGD, unlike neofunctionalization or subfunctionalization, which require specific mutations. We also show theoretically that increased fermentative capacity is of greatest advantage when glucose resources are both large and dense, an observation potentially related to the appearance of angiosperms around the time of WGD.


Figures
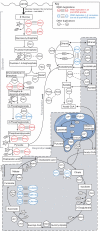
Figure 1
Figure 1
Overview of three catabolic pathways in S. cerevisiae: glycolysis, alcohol fermentation and the TCA cycle. Enzymes catalyzing each reaction are illustrated by circled gene names. Single lines joining pairs of enzymes indicate paralogous genes. Enzymes joined by three lines indicate paralogous enzymes derived from whole-genome duplication. The WGD pairs shown in red are preserved in double copy in four extant yeast species: S. cerevisiae, S. bayanus, C. glabrata and S. castellii. Protein localization for the CIT, ADH and ALD genes is taken from Huh et al (2003). The multi-enzyme complex which constitutes PDH is illustrated by the darker blue enclosure.
Figure 2
Figure 2
(A) Changes in the concentration of key metabolites in response to overall decreases in the Vmax values for the reactions of glycolysis (blue, left axis scale), as well as the change in PYK flux over the same range (red, right axis scale). (B) Ratio of the flux through pyruvate decarboxylase (PDC, fermentative pathways) to the flux through pyruvate dehydrogenase (PDH, respiratory pathway) as a function of pyruvate concentration and the ratio of NAD+ to NADH concentration (because NAD+ and NADH are two oxidation states of the same molecule, their concentrations vary inversely and hence are constrained to sum to 8.01 in B; Theobald et al, 1997). (C) Effect of compartmentalization on the relative fluxes of the first reaction in respiration (PDH) and in fermentation (PDC). On the x-axis is the relative enzyme concentration modeling a change from a rough pre-duplication state of 0.65 to a post-duplicate value of 1.0 (see A). On the y-axis is given the ratio of the fluxes between the two reactions relative to the flux when [E] on the x-axis is equal to 1.0.
Figure 3
Figure 3
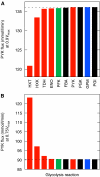
(A) Effect on flux through glycolysis (PYK flux) when the maximal enzymatic rates (Vmax) for the 10 relevant enzymes are individually reduced. Note that the TPI reaction is assumed to be at equilibrium and is not included in this analysis. On the x-axis are plotted the 10 reactions in question sorted in order of their effect on flux. On the y-axis is plotted the reduction in flux when Vmax is reduced by 10% for the reaction in question. Red bars indicate genes preserved in duplicate since WGD as well as the HXT genes (see text). PFK values are shown in green, as this reaction is catalyzed by a pair of more ancient duplicates. The blue bar indicates a WGD pair of enzymes in S. cerevisiae that is not maintained across all four post-WGD species (GPM). Bars in black are single-copy genes in S. cerevisiae. Flux through PYK for the unaltered model was 136.1 mmol/l/min (dashed line). (B) Effect on flux through glycolysis (PYK flux) when Vmax is first reduced to 75% of the current value for all reactions, and then individually increased to 100% of the current value for a single reaction. Thus the y-axis gives the flux through the pathway when all reactions except the one indicated have had their Vmax reduced to 75% of the current value. Reactions are shown in the same order as in panel A for comparison. The dashed line indicates the flux through PYK of 90.2 mmol/l/min seen when all enzymes have their Vmax values reduced to 75% of the current value.
Figure 4
Figure 4
Relative growth advantage of one population over another for a range of potential resource distributions. On the x-axis is the volume of a resource patch (l); on the y-axis is the concentration of glucose (mmol/l) in that patch. The total mass of glucose is the product of the axes, but note that because metabolic rate does not scale linearly with concentration, equivalent masses of glucose at differing concentrations will give rise to differing competitive advantages. The scale indicates the ratio of the cell mass for each population when resources are exhausted. Thus, values greater than 1.0 indicate regions where a rapidly fermenting population has a competitive advantage. (A) Ratio of final cell masses between two populations, one of which has a 5% advantage in maximal fermentation rate (at a cost of ∼10% loss of efficiency in terms of grams of cell mass produced per gram of glucose consumed). (B) Comparison of a respiring and a fermenting yeast population. Blue regions (ratio<1.0) correspond to conditions under which respiration is favored; orange, where fermentation is favored.

References

    1. Aon MA, Mónaco ME, Cortassa S (1995) Carbon and energetic uncoupling are associated with block of division at different stages of the cell cycle in several cdc mutants of Saccharomyces cerevisiae. Exp Cell Res 217: 42–51 - PubMed
    1. Ashburner A (1998) Speculations on the subject of alcohol dehydrogenase and its properties in Drosophila and other flies. BioEssays 20: 949–954 - PubMed
    1. Aury JM, Jaillon O, Duret L, Noel B, Jubin C, Porcel BM, Segurens B, Daubin V, Anthouard V, Aiach N, Arnaiz O, Billaut A, Beisson J, Blanc I, Bouhouche K, Camara F, Duharcourt S, Guigo R, Gogendeau D, Katinka M, Keller AM, Kissmehl R, Klotz C, Koll F, Le Mouel A, Lepere G, Malinsky S, Nowacki M, Nowak JK, Plattner H, Poulain J, Ruiz F, Serrano V, Zagulski M, Dessen P, Betermier M, Weissenbach J, Scarpelli C, Schachter V, Sperling L, Meyer E, Cohen J, Wincker P (2006) Global trends of whole-genome duplications revealed by the ciliate Paramecium tetraurelia. Nature 444: 171–178 - PubMed
    1. Bakalinsky AT, Snow R (1990) The chromosomal constitution of wine strains of Saccharomyces cerevisiae. Yeast 6: 367–382 - PubMed
    1. Betina S, Goffrini P, Ferrero I, Wésolowski-Louvel M (2001) RAG4 gene encodes a glucose sensor in Kluyveromyces lactis. Genetics 158: 541–548 - PMC - PubMed

Publication types

Substances