. 2007 Aug 15;166(4):447-55.
doi: 10.1093/aje/kwm097. Epub 2007 Jun 7.

Using risk-based sampling to enrich cohorts for endpoints, genes, and exposures

Affiliations

Using risk-based sampling to enrich cohorts for endpoints, genes, and exposures

Clarice R Weinberg et al. Am J Epidemiol. .

Abstract

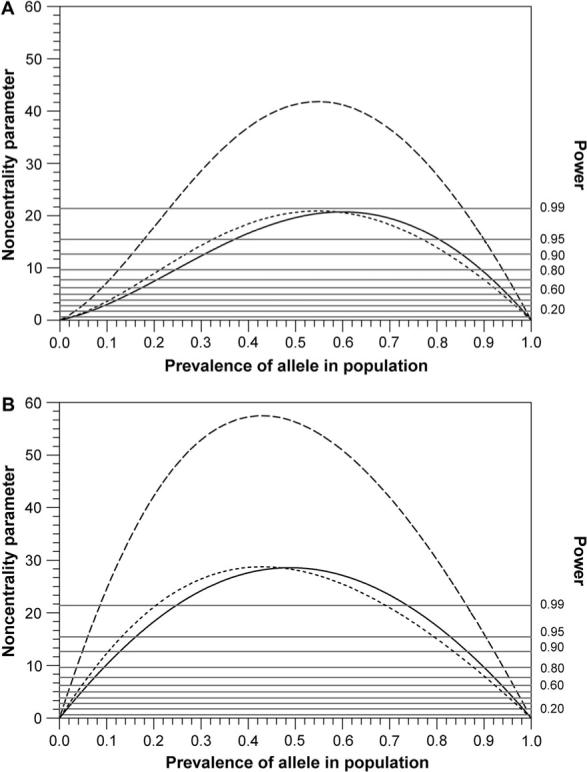
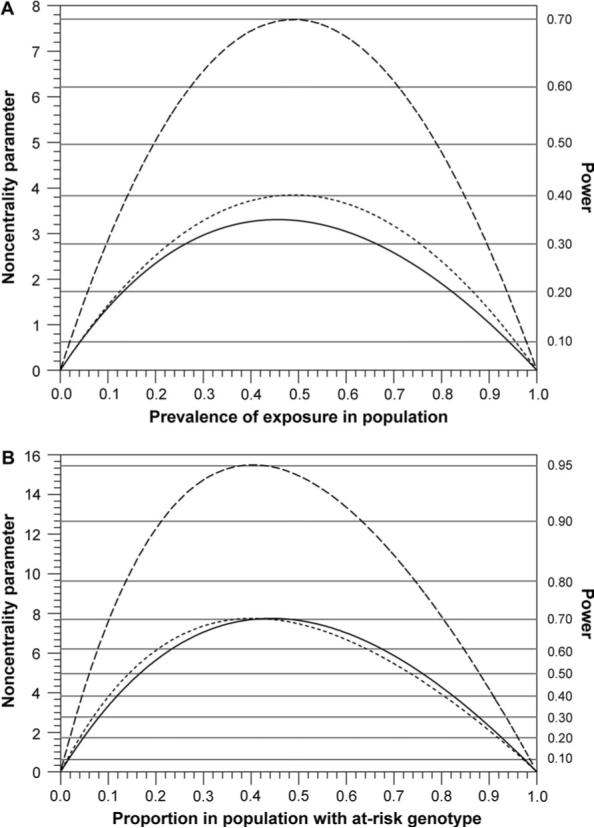
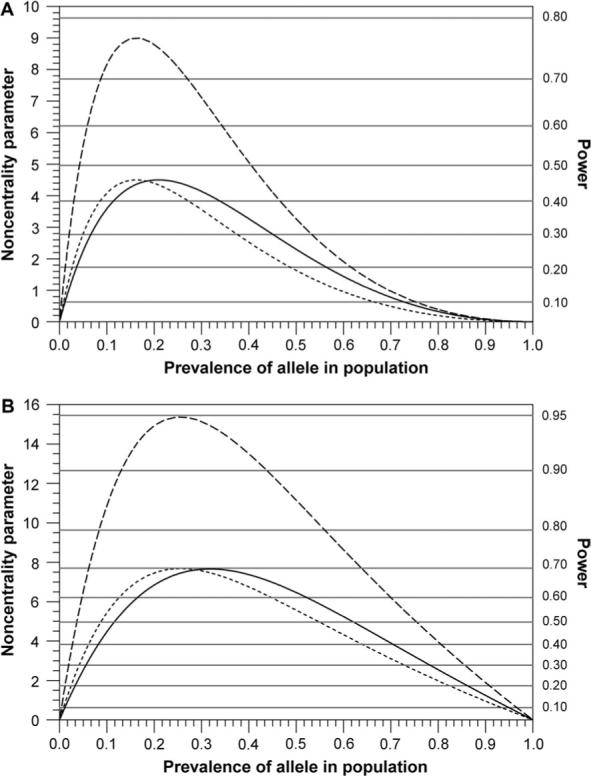
Targeting the first-degree relatives of people with a particular complex disease can offer a powerful approach to building a risk-based cohort for prospective studies of etiologic factors. Such a cohort provides both a sizable increase in the rate of accrual of newly incident cases, enriching for risk factors that are known or even unknown, and a high level of motivation among participants. A nationwide study of breast cancer in the United States and Puerto Rico, the Sister Study, made up of women who are each the sister of a woman with breast cancer, exemplifies this approach. In this paper, the authors provide power calculations to aid in the design of such studies and quantify their benefits for detecting both genetic variants related to risk and interactive effects of genetic and environmental factors. While the risk-based cohort can have markedly increased prevalences of rare causative alleles, most of the power advantages for this design is due to the increased rate of accrual of newly incident cases rather than the increase in any one individual allele.


Figures

FIGURE 1
FIGURE 1
Noncentrality parameter (left y-axis) and associated power (right y-axis) as a function of allele prevalence for a 2-degrees-of-freedom chi-square likelihood ratio test for genetic main effects. Calculations assume a nested case-control study with 400 cases and 800 controls within a risk-based cohort (short-dash line) or a randomly sampled cohort (solid line). An example curve corresponding to doubled accrual, based on 800 cases and 1,600 controls, within the risk-based cohort, is also shown (long-dash line). The genetic risk scenarios are A) R1 = 1.2, R2 = 2.0, T = U1 = U2 = 1.0; and B) R1 = 1.5, R2 = 2.5, T = U1 = U2 = 1.0. Parameters R1 and R2 denote the relative risks for offspring with one and with two copies of the variant allele, respectively, relative to those with no copies. The parameter T is the relative risk associated with exposure. U1 and U2 are the multiplicative interaction parameters for exposure acting jointly with one and with two inherited copies of the allele, respectively.
FIGURE 2
FIGURE 2
Noncentrality parameter (left y-axis) and associated power (right y-axis) for a 2-degrees-of-freedom chi-square likelihood ratio test for interaction. The risk scenario is for a pure interaction: R1 = R2 = T = 1.0, U1 = U2 = 2.0. Calculations assume a nested case-control study with 400 cases and 800 controls within a risk-based cohort (short-dash line) or a randomly sampled cohort (solid line). An example curve corresponding to doubled accrual within the risk-based cohort, based on 800 cases and 1,600 controls, is also shown (long-dash line). Noncentrality is plotted as a function of A) exposure prevalence, with allele prevalence fixed at 0.05; and B) proportion of the population that carries the allele, with exposure prevalence fixed at 0.4. Parameters R1 and R2 denote the relative risks for offspring with one and with two copies of the variant allele, respectively, relative to those with no copies. The parameter T is the relative risk associated with exposure. U1 and U2 are the multiplicative interaction parameters for exposure acting jointly with one and with two inherited copies of the allele, respectively.
FIGURE 3
FIGURE 3
Noncentrality parameter (left y-axis) and associated power (right y-axis) as a function of allele prevalence for a 2-degrees-of-freedom chi-square likelihood ratio test for interaction effects. The interaction risk scenario: R1 = 1.5, R2 = 3.0, T = 1, U1 = U2 = 2.0, with exposure prevalence fixed at 0.15. Calculations assume a nested case-control study with 400 cases and 800 controls within a risk-based cohort (short-dash line) or a randomly sampled cohort (solid line). An example curve corresponding to doubled accrual within the risk-based cohort, based on 800 cases and 1,600 controls, is also shown (long-dash line). Noncentrality is based on A) a multiplicative null model for no interaction, and B) an additive null model for no interaction. Parameters R1 and R2 denote the relative risks for offspring with one and with two copies of the variant allele, respectively, relative to those with no copies. The parameter T is the relative risk associated with exposure. U1 and U2 are the multiplicative interaction parameters for exposure acting jointly with one and with two inherited copies of the allele, respectively.
FIGURE 4
FIGURE 4
Noncentrality parameter (left y-axis) and associated power (right y-axis) as a function of exposure prevalence for a test of exposure main effects, showing the influence of unstudied genetic effects. Risk scenario: R1 = R2 = 1.0, T = 1.5, U1 = U2 = 2.0, with allele prevalence fixed at 0.2. Calculations assume a nested case-control study with 400 cases and 800 controls within a risk-based cohort (short-dash line) or a randomly sampled cohort (solid line). An example curve corresponding to doubled accrual within the risk-based cohort, based on 800 cases and 1,600 controls, is also shown (long-dash line). Parameters R1 and R2 denote the relative risks for offspring with one and with two copies of the variant allele, respectively, relative to those with no copies. The parameter T is the relative risk associated with exposure. U1 and U2 are the multiplicative interaction parameters for exposure acting jointly with one and with two inherited copies of the allele, respectively.

References

    1. Smithells R, Sheppard S, Schorah C, et al. Possible prevention of neural-tube defects by periconceptional vitamin supplementation. Lancet. 1980;1:339–40. - PubMed
    1. Antoniou A, Easton D. Polygenic inheritance of breast cancer: implications for design of association studies. Genet Epidemiol. 2003;25:190–202. - PubMed
    1. Collaborative Group on Hormonal Factors in Breast Cancer Familial breast cancer: collaborative reanalysis of individual data from 52 epidemiological studies including 58,209 women with breast cancer and 101,986 women without the disease. Lancet. 2001;358:1389–99. - PubMed
    1. Muhle R, Trentacoste S, Rapin I. The genetics of autism. Pediatrics. 2004;113:472–86. - PubMed
    1. White JE. A two stage design for the study of the relationship between a rare exposure and a rare disease. Am J Epidemiol. 1982;115:119–28. - PubMed

Publication types