

Estimate of overdiagnosis of breast cancer due to mammography after adjustment for lead time. A service screening study in Italy
- PMID: 17147789
- PMCID: PMC1797026
- DOI: 10.1186/bcr1625
Estimate of overdiagnosis of breast cancer due to mammography after adjustment for lead time. A service screening study in Italy
Abstract
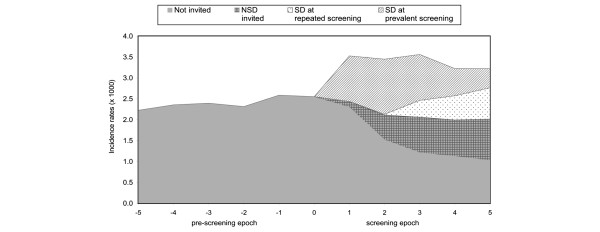
Introduction: Excess of incidence rates is the expected consequence of service screening. The aim of this paper is to estimate the quota attributable to overdiagnosis in the breast cancer screening programmes in Northern and Central Italy.
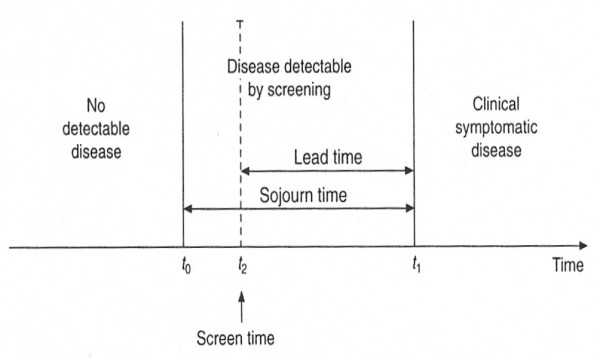
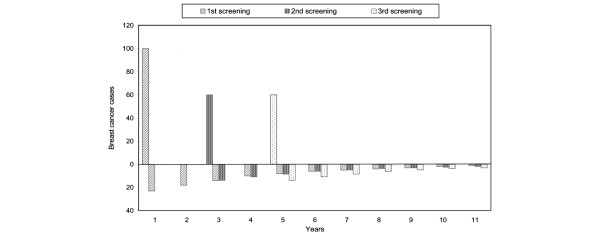
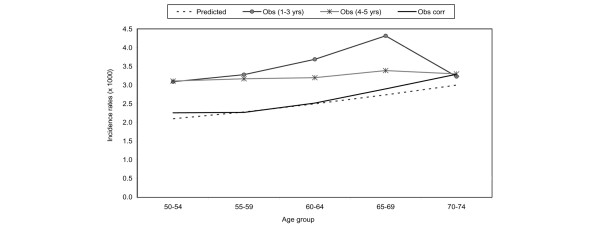
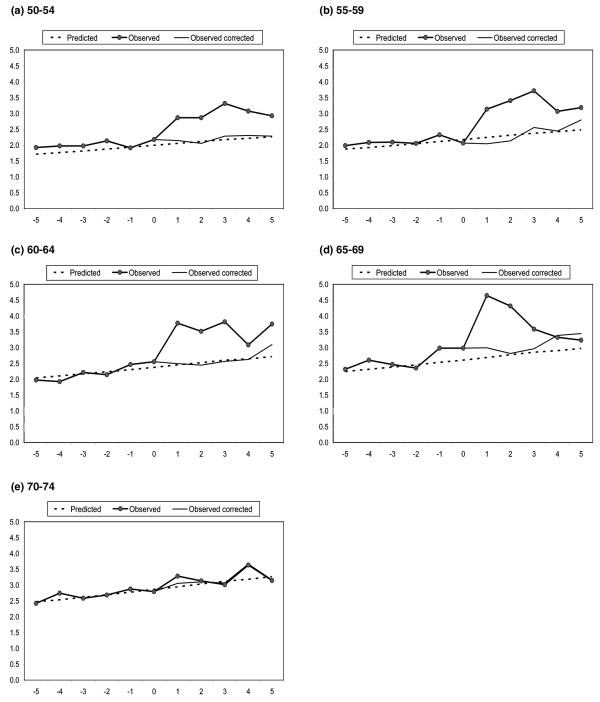
Methods: All patients with breast cancer diagnosed between 50 and 74 years who were resident in screening areas in the six years before and five years after the start of the screening programme were included. We calculated a corrected-for-lead-time number of observed cases for each calendar year. The number of observed incident cases was reduced by the number of screen-detected cases in that year and incremented by the estimated number of screen-detected cases that would have arisen clinically in that year.
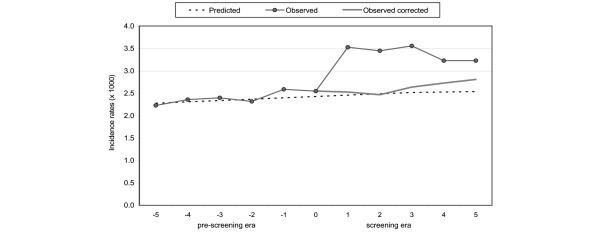
Results: In total we included 13,519 and 13,999 breast cancer cases diagnosed in the pre-screening and screening years, respectively. In total, the excess ratio of observed to predicted in situ and invasive cases was 36.2%. After correction for lead time the excess ratio was 4.6% (95% confidence interval 2 to 7%) and for invasive cases only it was 3.2% (95% confidence interval 1 to 6%).
Conclusion: The remaining excess of cancers after individual correction for lead time was lower than 5%.
Figures
References
-
- GISMA website http://www.gisma.it
-
- The National Centre for Screening Monitoring 4th Report. Epidemiol Prev. 2006;30(Suppl 3):7–16.
-
- Perry N, Broeders M, de Wolf C, Tornberg S, Holland R, von Karsa L, Puthar E, eds . European Guidelines for Quality Assurance in Breast Cancer Screening and Diagnosis. 4. Luxembourg: Office for Official Publications of the European Commission; 2006. - PubMed
-
- Morrison A. Screening in Chronic Disease. 2. New York: Oxford University Press; 1992.
Publication types
MeSH terms
LinkOut - more resources
Full Text Sources
Medical
