Comparative Study
. 2006 Feb;8(1):51-61.
doi: 10.2353/jmoldx.2006.050079.

Molecular classification of Crohn's disease and ulcerative colitis patients using transcriptional profiles in peripheral blood mononuclear cells

Affiliations
Comparative Study

Molecular classification of Crohn's disease and ulcerative colitis patients using transcriptional profiles in peripheral blood mononuclear cells

Michael E Burczynski et al. J Mol Diagn. 2006 Feb.

Abstract

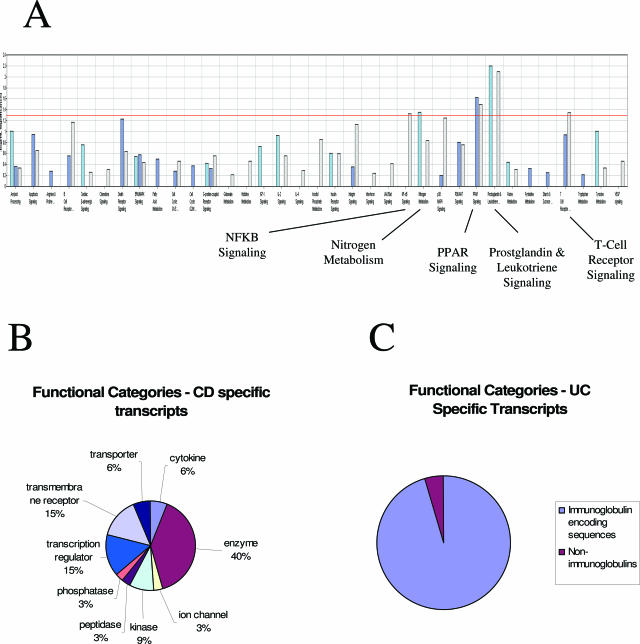
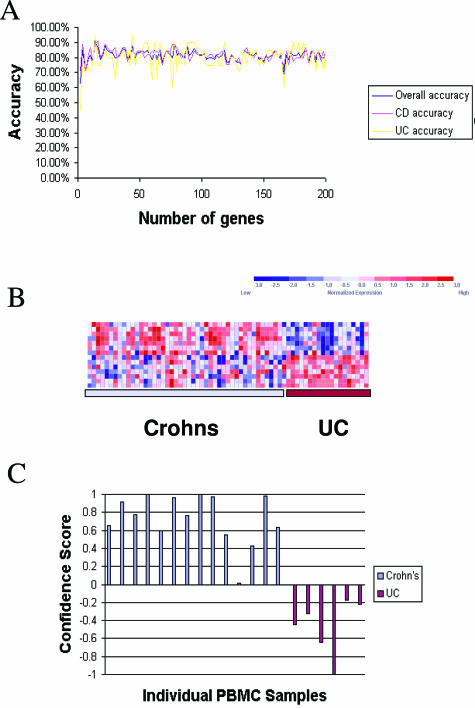
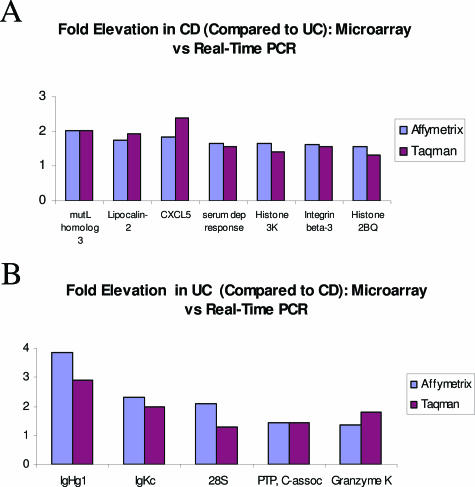
Ulcerative colitis (UC) and Crohn's disease (CD) are common inflammatory bowel diseases producing intestinal inflammation and tissue damage. Although emerging evidence suggests these diseases are distinct, approximately 10% of patients remain classified as indeterminate inflammatory bowel disease even after invasive colonoscopy intended for diagnosis. A molecular diagnostic assay using a clinically accessible tissue would greatly assist in the classification of these diseases. In the present study we assessed transcriptional profiles in peripheral blood mononuclear cells from 42 healthy individuals, 59 CD patients, and 26 UC patients by hybridization to microarrays interrogating more than 22,000 sequences. Supervised analysis identified a set of 12 genes that distinguished UC and CD patient samples with high accuracy. The alterations in transcript levels observed by microarray were verified by real-time polymerase chain reaction. The results suggest that a peripheral blood mononuclear cell-based gene expression signature can provide a molecular biomarker that can complement the standard diagnosis of UC and CD.


Figures

Figure 1
Figure 1
Functional annotation and categories of transcripts identified as CD-associated, UC-associated, and differentially expressed between UC and CD. A: Canonical pathways overrepresented in the CD versus normal analysis of covariance comparison (light blue); the UC versus normal analysis of covariance comparison (dark blue), and the UC versus CD analysis of covariance comparison (light purple). In this panel the negative log10 of the P value is plotted to highlight more significant associations. The pathways interrogated (in order) were as follows: amyloid processing, apoptosis signaling, arginine and proline metabolism, B-cell receptor signaling (nonimmunoglobulin), cardiac β-adrenergic signaling, chemokine signaling, death receptor signaling, ERK/MAPK signaling, fatty acid metabolism, cell cycle regulation (G1/S), cell cycle regulation (G2/M), GPCR signaling, glutamate metabolism, histidine metabolism, IGF-1 signaling, IL-2 signaling, IL-4 signaling, inositol phosphate metabolism, insulin receptor signaling, integrin signaling, interferon signaling, JAK/STAT signaling, NF-κB signaling, nitrogen metabolism, p38 MAPK signaling, PI3K/AKT signaling, PPAR signaling, prostaglandin and leukotriene metabolism, purine metabolism, pyrimidine metabolism, starch and sucrose metabolism, T-cell receptor signaling, tryptophan metabolism, tyrosine metabolism, and VEGF signaling. B: CD-specific transcripts in PBMCs were functionally annotated using the Ingenuity pathway analysis system (Ingenuity), and the relative distribution of transcripts in each of the chosen functional categories for the CD-associated genes are presented in the pie chart. C: UC-specific transcripts in PBMCs were functionally annotated manually, and the relative distribution of transcripts in immunoglobulin versus nonimmunoglobulin categories is presented.
Figure 2
Figure 2
Supervised class prediction of CD and UC using PBMC profiles. A: The relative overall accuracy, accuracy of CD classification, and accuracy of UC classification for gene classifiers of increasing size are presented. The smallest predictive model with the highest accuracy (94%) on LOOCV was a classifier composed of 14 gene sequences. B: Expression levels for the 14 most class-correlated sequences (rows) are indicated for each of the patients in the training set (columns). Expression data for each gene across the entire data set were normalized to a mean of zero and a variance of one and relative expression is indicated according to the color scale of blue (low expression) to red (high expression) as indicated in the key. C: Results of weighted voting class assignment in the test set of samples. Confidence scores in favor of CD are presented as positive values, and confidence scores of the class assignments in favor of UC are presented as negative values. The overall accuracy of class assignment was 100% in the test set, in which 15 of 15 Crohn’s patients were correctly classified as Crohn’s, and 6 of 6 UC patients were correctly classified as UC, based solely on expression patterns in PBMCs. The actual origins of the PBMC profiles are indicated by color (CD patients, light blue; UC patients, maroon).
Figure 3
Figure 3
Real-time PCR confirmation of classifier transcript levels in CD and UC sample sets. A: Average fold elevation of gene classifier transcripts detected as up-regulated in CD as detected by Affymetrix microarray hybridization (blue) or real-time RT-PCR (maroon). B: Average fold elevation of gene classifier transcripts detected as up-regulated in UC as detected by Affymetrix microarray hybridization (blue) or real-time RT-PCR (maroon).

References

    1. Podolsky DK. Inflammatory bowel disease. N Engl J Med. 2002;347:417–429. - PubMed
    1. Bouma G, Strober W. The immunological and genetic basis of inflammatory bowel disease. Nat Rev Immunol. 2003;3:521–533. - PubMed
    1. Warner EE, Dieckgraefe BK. Application of genome-wide gene expression profiling by high-density DNA arrays to the treatment and study of inflammatory bowel disease. Inflamm Bowel Dis. 2002;8:140–157. - PubMed
    1. Lawrance IC, Fiocchi C, Chakravarti S. Ulcerative colitis and Crohn’s disease: distinctive gene expression profiles and novel susceptibility candidate genes. Hum Mol Genet. 2001;10:445–456. - PubMed
    1. Rockett JC, Burczynski ME, Fornace Jr AJ, Hermann PC, Krawetz SA, Dix DJ. Surrogate tissue analysis: monitoring toxicant exposure and health status of inaccessible tissues through the analysis of accessible tissues and cells. Toxicol Appl Pharmacol. 2004;194:189–199. - PubMed