. 2005 Aug;138(4):1828-41.
doi: 10.1104/pp.105.066563. Epub 2005 Jul 22.

Effect of temperature on geminivirus-induced RNA silencing in plants

Affiliations

Effect of temperature on geminivirus-induced RNA silencing in plants

Padmanabhan Chellappan et al. Plant Physiol. 2005 Aug.

Abstract

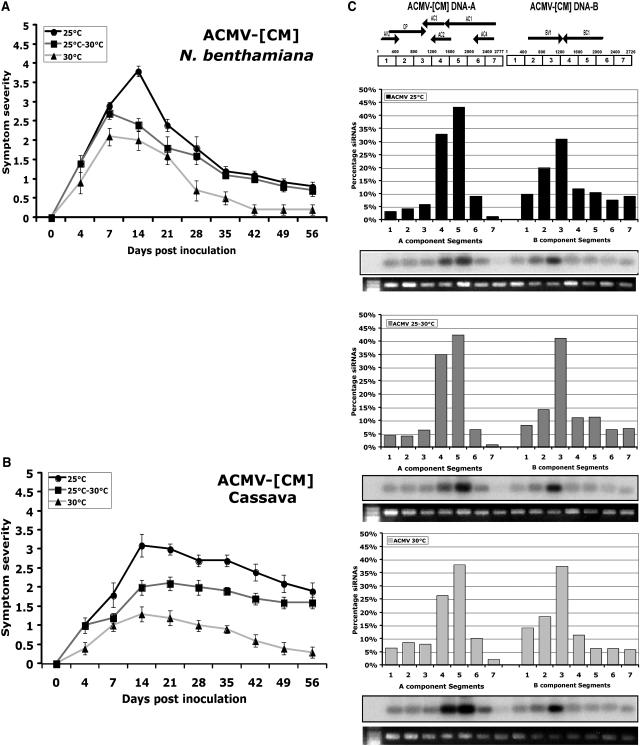
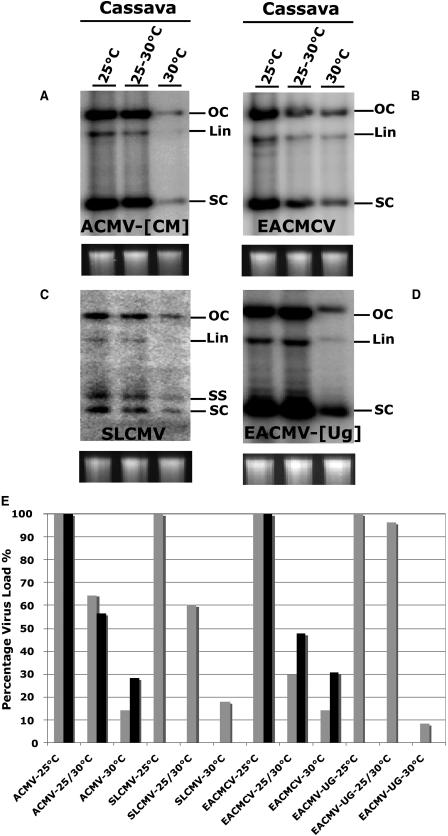
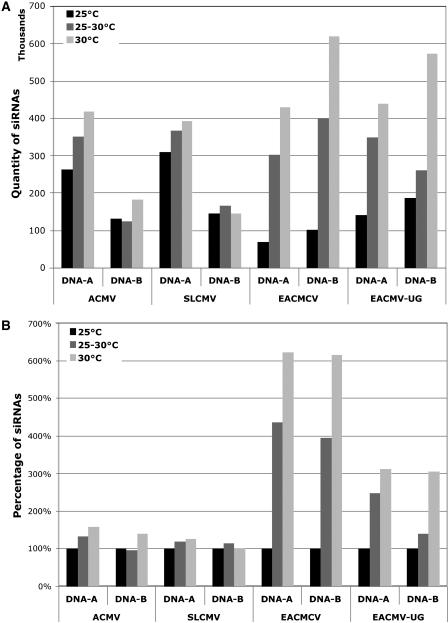
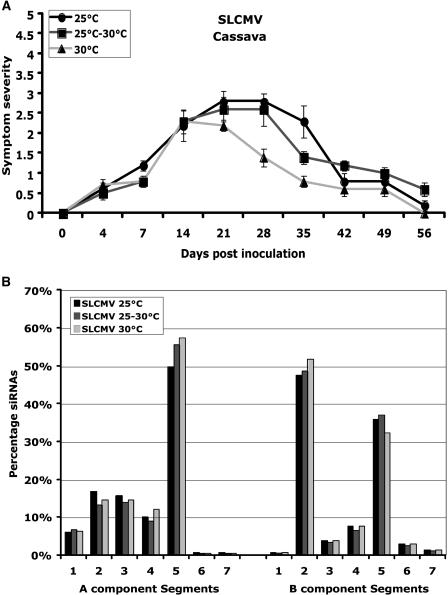
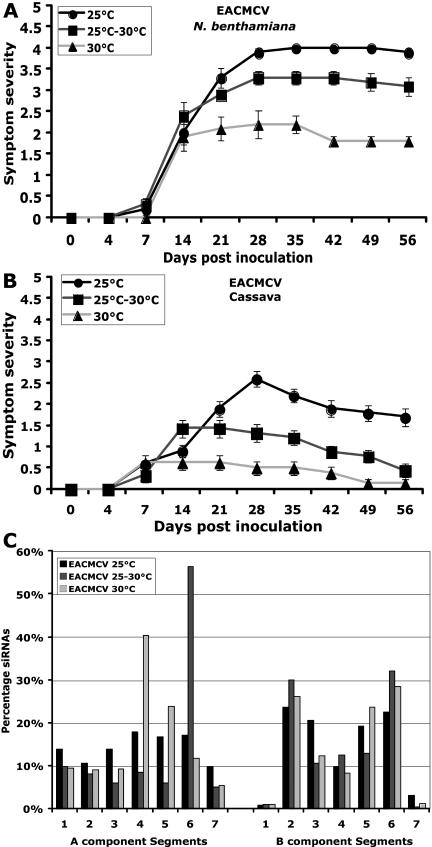
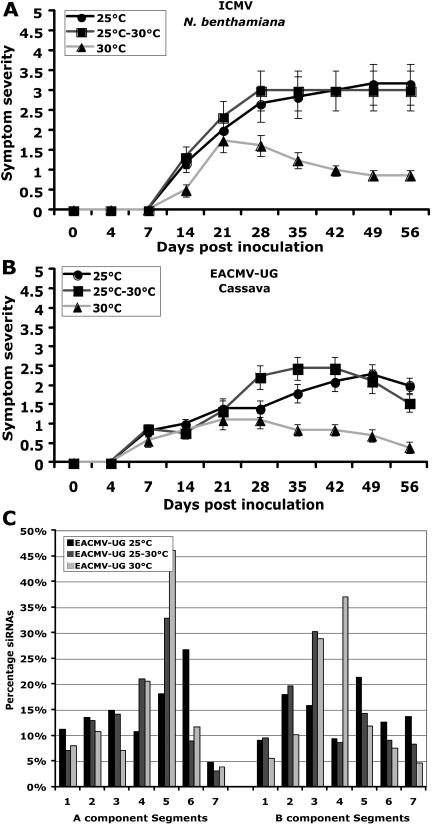
Short-interfering RNAs (siRNAs), the molecular markers of posttranscriptional gene silencing (PTGS), are powerful tools that interfere with gene expression and counter virus infection both in plants and animals. Here, we report the effect of temperature on geminivirus-induced gene silencing by quantifying virus-derived siRNAs and by evaluating their distribution along the virus genome for isolates of five species of cassava geminiviruses in cassava (Manihot esculenta, Crantz) and Nicotiana benthamiana. Cassava geminivirus-induced RNA silencing increased by raising the temperature from 25 degrees C to 30 degrees C, with the appearance of less symptomatic newly developed leaves, irrespective of the nature of the virus. Consequently, nonrecovery-type geminiviruses behaved like recovery-type viruses under high temperature. Next, we evaluated the distribution of virus-derived siRNAs on the respective virus genome at three temperatures (25 degrees C, 25 degrees C-30 degrees C, and 30 degrees C). For recovery-type viruses, siRNAs accumulated at moderately higher levels during virus-induced PTGS at higher temperatures, and there was no change in the distribution of the siRNA population along the virus genome. For nonrecovery-type viruses, siRNAs accumulated at strikingly higher levels than those observed for infections with recovery-type viruses at high temperature. As determined for an RNA virus, temperature influences gene silencing for single-stranded DNA geminiviruses. It is possible that other mechanisms besides gene silencing also control geminivirus accumulation at high temperatures. The findings presented here should be taken into consideration when implementing PTGS-based strategies to control plant virus accumulation.


Figures

Figure 1.
Figure 1.
Genome structure of ACMV-[CM], a typical bipartite cassava geminivirus. Genome is split into two components termed DNA-A (left) and DNA-B (right). DNA-A comprises six open reading frames (ORFs), and each ORF encodes a specific protein. AC1, Replication-associated protein (Rep); AC2, transcriptional activator protein (TrAP); AC3, replication enhancer protein (REn); AC4, RNA-silencing suppressor; AV1, coat protein (CP); AV2, precoat. DNA-B has two ORFs; BV1 encodes nuclear-shuttle protein (NSP), and BC1 encodes movement protein (MP). V, Virion-sense ORFs; C, complementary-sense ORFs.
Figure 2.
Figure 2.
Effect of temperature on ACMV-[CM]-induced symptom severity in N. benthamiana and cassava, and the distribution of siRNAs in infected cassava. A and B, ACMV-[CM]-induced symptom severity trend in N. benthamiana (A) and in cassava (B) at three temperatures: 25°C, 25°C to 30°C, and 30°C. Ten cassava and N. benthamiana plants were inoculated as five plants in two experiments. Bars in symptom severity curve indicate se values of 10 plants. C, Effect of temperature on the level and distribution of ACMV-[CM] siRNA accumulation at three temperatures. ACMV-[CM] has a split genome; the total length of DNA-A is 2,777 bp, and DNA-B is 2,726 bp. PCR-amplified approximately 400-bp DNA segments from 1 through 7 for DNA-A and segments 1 through 7 for DNA-B of ACMV-[CM] separated in an ethidium bromide-stained 1% agarose gel were blotted and hybridized with 5′-end-labeled small 21- to 26-nt RNAs purified from ACMV-[CM]-infected cassava plants grown at 25°C, 25°C to 30°C, and 30°C. The blots were quantified and values were plotted. Values on the y axis represent the percentage of siRNAs derived from either DNA-A or DNA-B of ACMV-[CM]. Each bar represents the amount of siRNAs for respective DNA segments in comparison to the total amount of siRNAs either for DNA-A or DNA-B. Blots were quantified using image quant (IqMacV1.2) software. Numbers on the x axis indicate the PCR-amplified DNA fragments representing various regions of the ACMV-[CM] genome. The graph following each blot represents the distribution and intensity of ACMV-[CM]-derived siRNAs at 25°C (top), at 25°C to 30°C (middle), and at 30°C (bottom).
Figure 3.
Figure 3.
The levels of viral DNA accumulation in infected cassava plants in three temperatures conditions: 25°C, 25°C to 30°C, and 30°C. Southern blots show the levels of viral DNA accumulation: A, ACMV-[CM]; B, EACMCV; C, SLCMV; D, EACMV-[Ug]. Total genomic DNA at the bottom of each blot serves as the loading control. Various forms of viral DNAs are shown: OC, open circular; Lin, linear; SS, single stranded; SC, supercoiled. E, Comparison of the virus loads in two host plants. Recovery-type viruses, ACMV-[CM] and SLCMV; nonrecovery-type viruses, EACMCV and EACMV-[Ug]. Shown are the levels of ACMV-[CM] in cassava (light gray) and N. benthamiana (black); SLCMV in cassava; EACMCV in cassava (light gray) and N. benthamiana (black); and EACMV-[Ug] in cassava. The y axis represents virus load in percentage (%), and the x axis represents different viruses as indicated.
Figure 4.
Figure 4.
A, Comparison of virus-derived siRNA accumulation for each of the DNA-A and DNA-B components of ACMV, SLCMV, EACMCV, and EACMV-[Ug] at 25°C, 25°C to 30°C, and 30°C temperatures. Values on the y axis represent the sum of intensities of signals (103). The x axis represents the DNA-A and the DNA-B components of ACMV, SLCMV, EACMCV, and EACMV-[Ug] at three temperatures: 25°C, 25°C to 30°C, and 30°C. B, Comparison of virus-derived siRNA accumulation for each of the DNA-A and DNA-B components of ACMV, SLCMV, EACMCV, and EACMV-[Ug] at 25°C, 25°C to 30°C, and 30°C temperatures, relative to the values at 25°C (100%). Values on the y axis represent the percentage of siRNAs relative to the value at 25°C for each DNA component and for each virus. The x axis represents the DNA-A and the DNA-B components of ACMV, SLCMV, EACMCV, and EACMV-[Ug] at three temperatures: 25°C, 25°C to 30°C, and 30°C.
Figure 5.
Figure 5.
Effect of temperature on symptom severity of SLCMV on cassava, and the level and distribution of virus genome siRNAs in infected cassava plants. A, SLCMV symptom severity trend in cassava in three temperatures conditions: 25°C, 25°C to 30°C, and 30°C. Ten cassava plants were inoculated as five plants in two experiments. Bars in symptom severity curve indicate se values of 10 plants. B, Gel blots (first seven segments for DNA-A and second seven segments for DNA-B) were subjected to gel-blot hybridization using 5′-labeled virus-derived siRNAs purified from SLCMV-infected plants grown at 25°C, 25°C to 30°C, and 30°C. The intensity of signals in the blots was quantified and plotted into graphs. Values on the y axis represent the percentage of siRNAs derived from either DNA-A or DNA-B of SLCMV. Each bar represents the amount of siRNAs for respective DNA segments in comparison to the total amount of siRNAs either for DNA-A or DNA-B. Blots were quantified using image quant (IqMacV1.2) software. Numbers in the x axis indicate the PCR-amplified DNA fragments representing various regions of the SLCMV genome.
Figure 6.
Figure 6.
Effect of temperature on symptom severity of EACMCV on N. benthamiana and cassava, and the level and distribution of virus genome siRNAs in infected cassava plants. A and B, EACMCV symptom severity trend in N. benthamiana (A) and in cassava (B) at three ranges of temperature: 25°C, 25°C to 30°C, and 30°C. Ten N. benthamiana and cassava plants were inoculated as five plants in two experiments. Bars in symptom severity curve indicate se values of 10 plants. C, Effect of temperature on the level and distribution of EACMCV genome siRNA accumulation at three different temperatures. EACMCV has a split genome; the total length of DNA-A is 2,802 bp, and DNA-B has 2,741 bp. Gel blots (first seven segments for DNA-A and second seven segments for DNA-B) were subjected to hybridization using 5′-labeled virus-derived siRNAs purified from EACMCV-infected plants grown at 25°C, 25°C to 30°C, and 30°C. The intensity of signals in the blots was quantified and plotted into graphs. Values on the y axis represent the percentage of siRNAs derived from either DNA-A or DNA-B of EACMCV. Each bar represents the amount of siRNAs for respective DNA segments in comparison to the total amount of siRNAs either for DNA-A or DNA-B. Blots were quantified using image quant (IqMacV1.2) software. Numbers in the x axis indicate the PCR-amplified DNA fragments representing various regions of the EACMCV genome.
Figure 7.
Figure 7.
Effect of temperature on symptom severity of ICMV in N. benthamiana and on EACMV-[Ug] infection in cassava, and the level and distribution of EACMV-[Ug] genome siRNAs in infected cassava plants. A and B, ICMV symptom severity trend in N. benthamiana (A) and EACMV-[Ug] in cassava (B) in three ranges of temperature: 25°C, 25°C to 30°C, and 30°C. Ten plants were inoculated as five plants in two experiments. Bars in symptom severity curve indicate se values of 10 plants. C, The level and distribution of virus-derived siRNA accumulation were assessed only in virus infection in cassava. Gel blots (first seven segments for DNA-A and second seven segments for DNA-B) were subjected to hybridization using 5′-labeled virus-derived siRNAs purified from EACMV-[Ug]-infected plants grown at 25°C, 25°C to 30°C, and 30°C. The intensity of signals in the blots was quantified and plotted into graphs. Values on the y axis represent the percentage of siRNAs derived from either DNA-A or DNA-B of EACMV-[Ug]. Each bar represents the amount of siRNAs for respective DNA segments in comparison to the total amount of siRNAs either for DNA-A or DNA-B. Blots were quantified using image quant (IqMacV1.2) software. Numbers in the x axis indicate the PCR-amplified DNA fragments representing various regions of the SLCMV genome.

References

    1. Anandalakshmi R, Pruss GJ, Ge X, Marathe R, Mallory AC, Smith TH, Vance VB (1998) A viral suppressor of gene silencing in plants. Proc Natl Acad Sci USA 95: 13079–13084 - PMC - PubMed
    1. Baulcombe D (2004) RNA silencing in plants. Nature 431: 356–363 - PubMed
    1. Bernstein E, Caudy AA, Hammond SM, Hannon GJ (2001) Role for a bidentate ribonuclease in the initiation step of RNA interference. Nature 409: 363–366 - PubMed
    1. Chapman EJ, Prokhnevsky AI, Gopinath K, Dolja VV, Carrington JC (2004) Viral RNA silencing suppressors inhibit the microRNA pathway at an intermediate step. Genes Dev 18: 1179–1186 - PMC - PubMed
    1. Chellappan P, Masona MV, Vanitharani R, Taylor NJ, Fauquet CM (2004. b) Broad spectrum resistance to ssDNA viruses associated with transgene-induced gene silencing in cassava. Plant Mol Biol 56: 601–611 - PubMed

Publication types