. 2005 Aug;42(2):343-52.
doi: 10.1002/hep.20798.

Early response of alpha2(I) collagen to acetaldehyde in human hepatic stellate cells is TGF-beta independent

Affiliations

Early response of alpha2(I) collagen to acetaldehyde in human hepatic stellate cells is TGF-beta independent

Gianluca Svegliati-Baroni et al. Hepatology. 2005 Aug.

Abstract

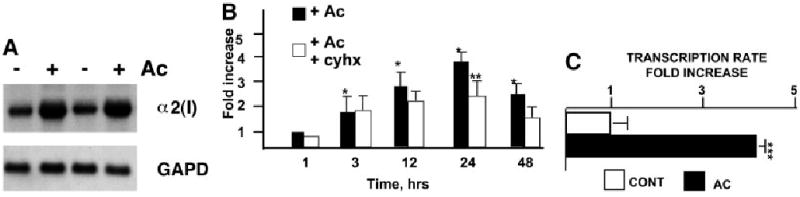
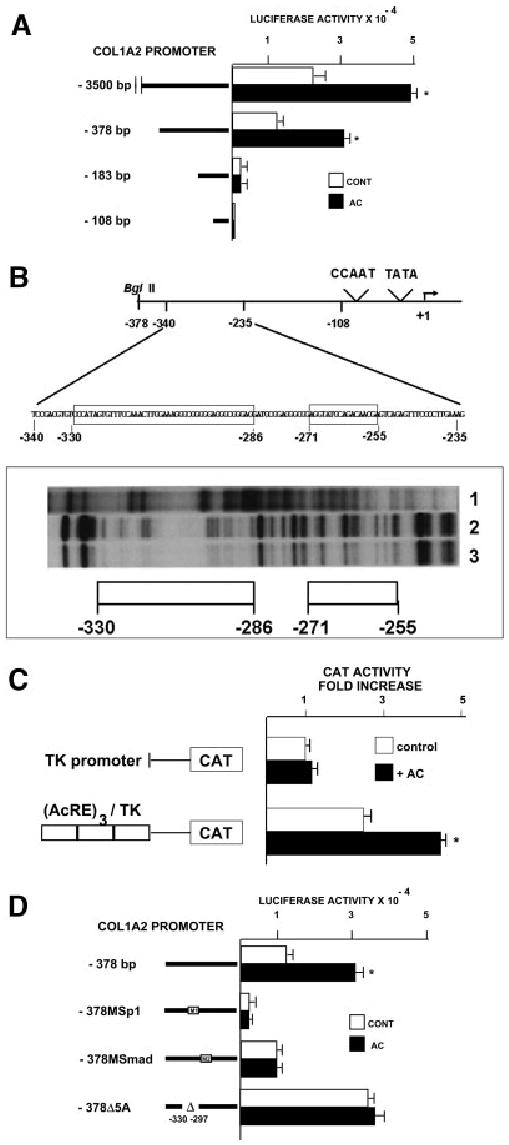
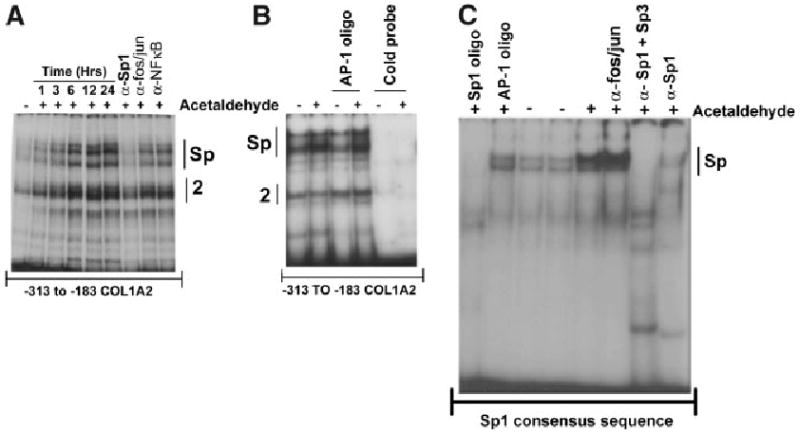
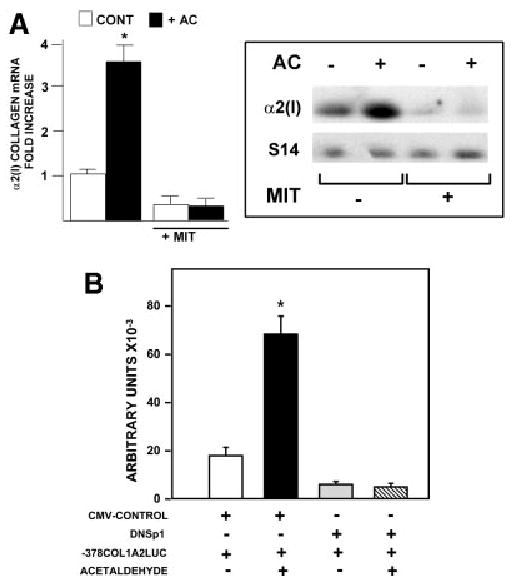
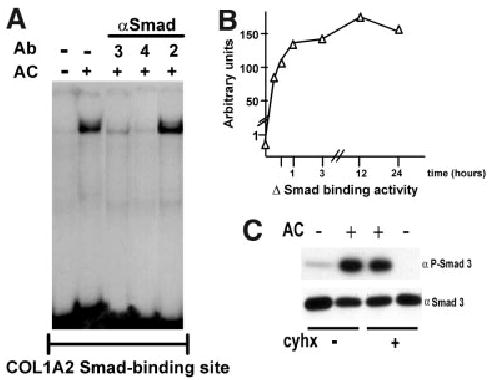
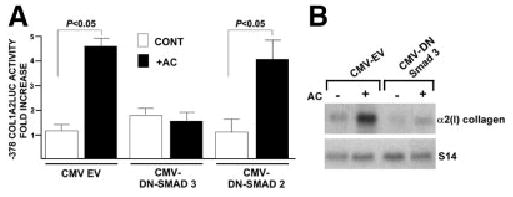
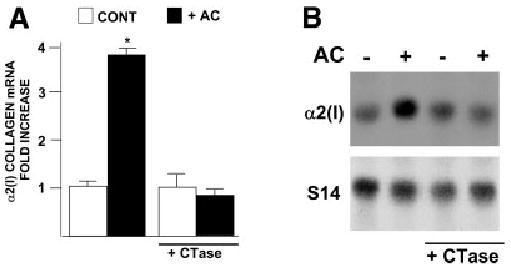
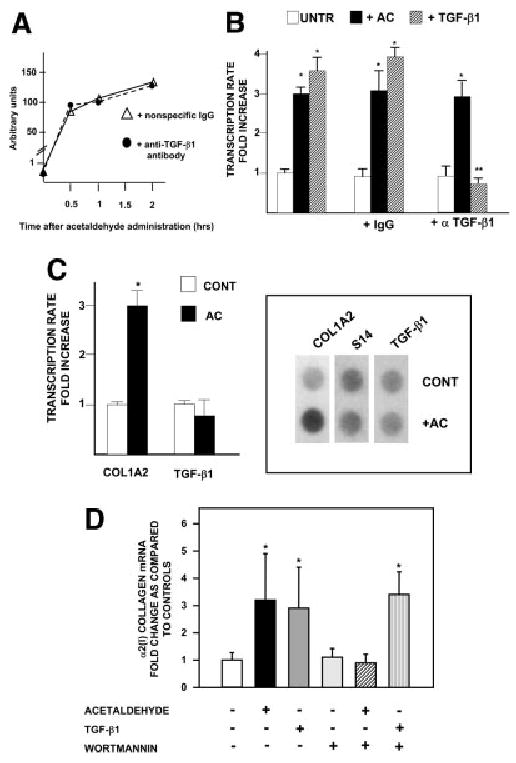
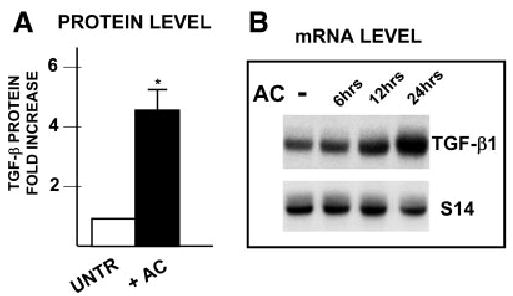
Acetaldehyde is fibrogenic and induces the expression of type I collagen genes in hepatic stellate cells. Some of these acetaldehyde-dependent events are mediated by H(2)O(2) and thus establish a direct connection between oxidative stress and collagen upregulation. We localized to the -378 to -183 region of the alpha2(I) collagen (COL1A2) promoter an acetaldehyde-responsive element (AcRE) functional in human hepatic stellate cells (HHSCs) and investigated molecular mechanisms whereby acetaldehyde stimulates and modulates its transcriptional activity. Because the AcRE co-localized with a previously described transforming growth factor beta (TGF-beta)1-responsive element, and both acetaldehyde and this cytokine induce their effects through H(2)O(2), we investigated whether all fibrogenic actions of acetaldehyde were mediated by this cytokine. Here we show that acetaldehyde-induced COL1A2 upregulation in HHSCs recognizes two distinct but overlapping early and late stages that last from 1 to 6 hours and from 6 to 24 hours, respectively. We present several lines of evidence to show that early acetaldehyde-mediated events are independent of TGF-beta1. These include significant time-course differences in the expression of COL1A2 and TGF-beta1 mRNAs and inability of neutralizing antibodies to TGF-beta1 to inhibit acetaldehyde-dependent collagen gene transcription and Smad 3 phosphorylation. We also show that although acetaldehyde-dependent upregulation of collagen was PI3K dependent, that of TGF-beta1 was PI3K independent. In conclusion, acetaldehyde-dependent mechanisms involved in COL1A2 upregulation are similar, but not identical, to those of TGF-beta1. We suggest that early acetaldehyde-dependent events induce the late expression of TGF-beta1 and create an H(2)O(2)-dependent autocrine loop that may sustain and amplify the fibrogenic response of this alcohol metabolite.


Conflict of interest statement

Potential conflict of interest: Nothing to report.

Figures

Fig. 1
Fig. 1
Acetaldehyde stimulates COL1A2 gene expression at the transcriptional level by protein synthesis– dependent and –independent mechanisms. (A) Northern blot analysis of total RNA extracted from HHSCs cultured in the presence or absence of acetaldehyde (AC) for 6 hours; the identity of the probes is indicated on the right side of the autoradiograph. (B) Time-course analysis COL1A2 mRNA expression in AC-treated cells cultured in the absence or presence of cycloheximide (cyhx). (C) Run-on transcription assays of the endogeneous COL1A2 gene in HHSCs treated with AC for 3 hours. *P < .05 when compared with control, untreated HSCs. **P < .05 when compared with AC-treated cells.***P < .05 when compared with control values.
Fig. 2
Fig. 2
The acetaldehyde-responsive element of the COL1A2 gene in HHSCs is located between nucleotides −378 and −183. (A) Deletion analysis in control and acetaldehyde (AC)-treated HHSCs transfected with luciferase reporter constructs driven by different lengths of the COL1A2 promoter. The length of each of the constructs used is shown on the left side of the figure. *P < .05 vs control without AC. (B) Footprinting analysis of the −378 to the −183 COL1A2 promoter region performed with nuclear extracts from control (lane 2) and acetaldehyde-treated HHSCs (lane 3) for 3 hours. As a negative control, DNA incubated without nuclear extracts was used (lane 1). (C) CAT activity in control and acetaldehyde-treated HHSCs (AC) transfected with a reporter CAT vector driven by the TK promoter alone or with a vector containing 3 copies in tandem of the acetaldehyde-responsive element (AcRE) upstream of the TK promoter. *P < .05 vs. cells transfected with the (AcRE)3 TKCAT vector without AC. (D) Mutation analysis in control and acetaldehyde-treated HHSCs transfected with luciferase reporter constructs driven by mutated versions of the −378 COL1A2LUC vector. For these experiments, the following sequences of the −378COL1A2LUC were mutated: −301 to −302, −292 to −291 and −275 to 274, sequences corresponding to the 3 COL1A2 Sp1 binding sites (MSp1 COL1A2/LUC) or the −272 to −249 sequence corresponding to the SMAD binding site (MCAGA COL1A2/LUC). In addition, a construct in which the −330 to −297 area was deleted (Δ5A) was also used. *P < .05 vs. control cells without AC.
Fig. 3
Fig. 3
Acetaldehyde enhances binding of a Sp1-containing complex to the −313 to −183 region of the COL1A2 gene in HHSCs and to a Sp1 high-recognition sequence. (A) Electrophoretic mobility shift assays of nuclear extracts from control (−) and acetaldehyde-treated (+) HHSCs for 1, 3, 6, 12, and 24 hours using the −313 to −183 COL1A2 region. As shown in this panel, acetaldehyde significantly enhances protein binding to this region. Antibody interference assays demonstrated that the upper complex contains Sp1, but not AP-1 (fos/jun) or NFκB. The identity of the lower complex (labeled “complex 2” remains unknown). (B) The complexes formed after acetaldehyde treatment (3 hours) are specific, as they can be competed by unlabeled −313 to −183 COL1A2 sequence (“cold probe”) but not by an AP-1 high-affinity recognition oligonucleotide. (C) Increased binding of nuclear extracts of HSCs treated for 24 hours with AC to an Sp1 high-recognition oligonucleotide. The complex is specific, as it can be competed with excess (100-fold molar) unlabeled Sp1 consensus sequence, but not AP-1, and is recognized by antibodies to Sp1 and Sp3 (α-Sp1 + α-Sp3) but not AP-1 (anti-fos/jun). Panel C also shows that whereas the combination of α-Sp1 + α-Sp3 antibodies completely eliminates (or supershifts) the DNA–protein complexes obtained with acetaldehyde, the α-Sp1 antibody was less efficient and did not eliminate the complex completely.
Fig. 4
Fig. 4
Sp1 is essential for the acetaldehyde-dependent upregulation of the COL1A2 gene in HHSCs. (A) Northern blot analysis of α2(I) collagen mRNA performed with total RNA extracted from control and acetaldehyde (AC)-treated HHSCs cultured in the presence or absence of 100 nmol/L mithramycin (MIT) for 6 hours. The histogram on the left summarizes the results of quadruplicate experiments. The right panel depicts a representative Northern blot. Differences in loading were corrected with the signal generated with an S14 mRNA probe. *P < .05 versus control cells without AC. (B) Effect of acetaldehyde on HHSCs transiently co-transfected with the −378 COL1A2LUC reporter construct and a dominant negative Sp1 expression plasmid (DNSp1). Activity is expressed as arbitrary units of luciferase activity. As a control for these experiments, some HHSCs were co-transfected with the −378 COL1A2LUC and an empty CMV expression vector (CMV-CONTROL). * P < .05 versus control cells without AC.
Fig. 5
Fig. 5
Acetaldehyde enhances phosphorylation of Smad 3 and binding of a Smad3/4-containing complex to the −272 to −249 COL1A2 region by a protein synthesis–independent mechanism. (A) Electrophoretic mobility shift assay performed with nuclear extracts from control and acetaldehyde (AC)-treated HHSCs for 6 hours, using an oligonucleotide containing 3 copies in tandem of the COL1A2 Smad binding site (CAGA)3 as probe. Antibody interference assays with antibodies (Ab) to either Smads 2, 3, or 4 revealed that the complex contained Smads 3/4 but not Smad 2. (B) Time-course analysis of the effect of acetaldehyde on the binding of the Smad 3/4-containing complex to the (CAGA)3 oligonucleotide. The graph was constructed with values obtained after densitometric analysis of bands generated in duplicate electrophoretic mobility shift assays performed at the indicated times and expressed as arbitrary units. (C) Western blot analysis of nuclear extracts obtained from control and acetaldehyde (AC)-treated HHSCs for 6 hours in the presence or absence of cycloheximide (cyhx). Samples were probed with an anti-Smad3 antibodies directly (αSmad3) or after immunoprecipitation with an anti-phosphoserine antibody (αP-Smad3).
Fig. 6
Fig. 6
Smad 3 but not Smad 2 is essential for acetaldehyde-dependent COL1A2 gene upregulation in HHSCs. (A) Effect of acetaldehyde (AC) on luciferase activity of HHSCs transiently co-transfected with the −378 COL1A2LUC reporter vector and either a control empty CMV vector, or dominant negative Smad3 (DN-SMAD3) or Smad2 (DN-SMAD2) expression vectors. Values are expressed as fold increase above controls. (B) Northern blot analysis of total RNA extracted from HHSCs harboring stably integrated copies of an empty CMV vector or an expression vector encoding DN-Smad3 cultured in the presence or absence of AC. The identity of the probes is indicated on the right side of the autoradiography.
Fig. 7
Fig. 7
Catalase abrogates acetaldehyde-induced α2(I) collagen mRNA expression in HHSCs. Northern blot analysis of α2(I) collagen mRNA performed with total RNA extracted from control and acetaldehyde (AC)-treated HHSCs cultured in the presence or absence of catalase (1,000 U/mL) for 24 hours. (A) The histogram summarizes the results of quadruplicate experiments. (B) Representative Northern blot. Differences in loading were corrected with the signal generated with an S14 mRNA probe. *P < .05 versus control cells without AC.
Fig. 8
Fig. 8
TGF-β1 is not involved in early acetaldehyde-dependent up-regulation of the COL1A2 gene. (A) Effect of neutralizing antibodies to TGF-β1 on acetaldehyde-induced phosphorylation of Smad3. HHSCs were incubated with acetaldehyde in the presence of a nonspecific immunoglobulin G (triangles) or an anti–TGF-β1 neutralizing antibody (circles). At the indicated times, nuclear extracts were obtained for Western blot analysis of phosphorylated Smad 3 as described in Materials and Methods. The graph was constructed with values obtained after densitometric analysis of bands generated in duplicate Western blots performed at the indicated times and expressed as arbitrary units. (B) Run-on transcription assays of control and acetaldehyde-treated HHSCs for 3 hours in the presence or absence of a nonspecific immunoglobulin G or a neutralizing antibody to TGF-β1 (α TGF-β1). As a control for these experiments, some HHSCs were treated with 2 ng/mL of TGF-β1 in the absence or presence of the neutralizing antibody to the cytokine. *P < .05 versus control untreated cells. **P < .05 when compared with TGF-β1–treated cells in the absence of the neutralizing antibody. (C) Run-on transcription assays of COL1A2 and TGF-β1 gene expression performed with nuclear extracts from control and acetaldehyde (AC)–treated HHSCs for 1 hour. The histogram on the left summarizes the results of triplicate experiments. The right panel depicts a representative run-on assay. Differences in loading were corrected with the signal generated with an S14 probe.*P < .05 versus control cells without AC. (D) Northern blot analysis of HHSCs treated with either acetaldehyde (200 μmol/L) or TGF-β1 (2 ng/mL) in the absence or presence of 100 nmol/L wortmannin. For these experiments, HHSCs were pretreated for 3 hours with wortmannin followed by 12 hours with acetaldehyde or TGF-β1. The histogram summarizes results of triplicate experiments, and the results are expressed as fold-increase above control untreated HHSCs. *P < .05 versus control cells without AC, TGF-β1, or wortmannin.
Fig. 9
Fig. 9
Acetaldehyde induces late expression of α2(I) collagen mRNA by a TGF-β1– dependent mechanism. (A) Western blot analysis of TGF-β1 expression in control and acetaldehyde-treated HHSCs for 24 hours. The histogram summarizes triplicate experiments, and the results are expressed as fold increase above untreated controls. *P < .05 versus control cells without AC. (B) Time-course analysis of TGFβ1 mRNA expression in HHSCs treated with 200 μmol/L acetaldehyde. The identity of the probes is indicated on the right side of the autoradiograph.

References

    1. McClain CJ, Barve S, Deaciuc I, Kugelmas M, Hill D. Cytokines in alcoholic liver disease. Semin Liver Dis. 1999;19:205–219. - PubMed
    1. McClain CJ, Barve S, Barve S, Deaciuc I, Hill DB. Tumor necrosis factor and alcoholic liver disease. Alcohol Clin Exp Res. 1998;22:248S–252S. - PubMed
    1. Hill DB, Marsano L, Cohen D, Allen J, Shedlofsky S, McClain CJ. Increased plasma interleukin-6 concentrations in alcoholic hepatitis. J Lab Clin Med. 1992;119:547–552. - PubMed
    1. Nieto N, Dominguez-Rosales JA, Fontana L, Salazar A, Armendariz-Borunda J, Greenwel P, et al. Rat hepatic stellate cells contribute to the acute-phase response with increased expression of alpha1(I) and alpha1(IV) collagens, tissue inhibitor of metalloproteinase-1, and matrix-metalloproteinase-2 messenger RNAs. Hepatology. 2001;33:597–607. - PubMed
    1. Greenwel P, Rojkind M. Accelerated development of liver fibrosis in CCl4-treated rats by the weekly induction of acute phase response episodes: upregulation of alpha1(I) procollagen and tissue inhibitor of metal-loproteinase-1 mRNAs. Biochim Biophys Acta. 1997;1361:177–184. - PubMed

Publication types